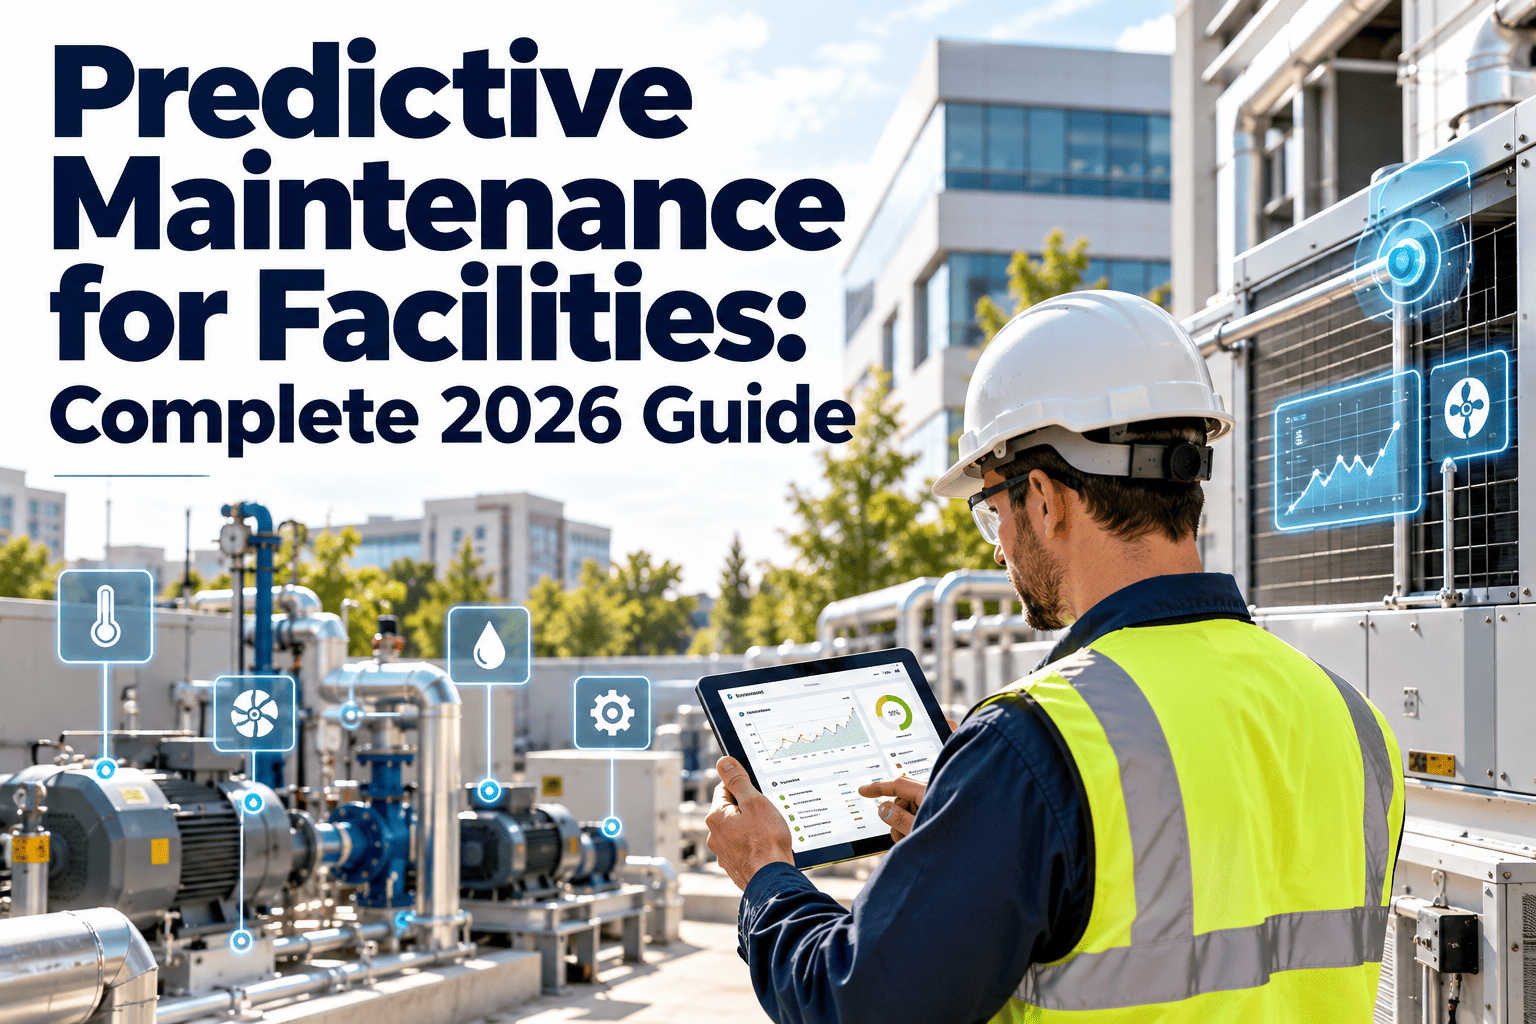
Most facility teams already run preventive maintenance, yet chillers, pumps, fans, and switchgear still fail between scheduled visits. Predictive maintenance closes that gap by using real condition data, such as vibration, temperature, and building automation trends, to time repairs when equipment actually needs them. Done well, it moves a building from emergency callouts toward planned work. This guide covers which assets qualify first and how a CMMS turns a sensor alert into finished work, and you can start a free trial to test it.
Predictive Maintenance for Facilities: Repair Equipment Before It Fails, Not After
What Predictive Maintenance Means Inside a Building
Predictive maintenance monitors equipment while it runs and uses trends to estimate when a developing defect will become a failure. In facilities that usually means vibration on motors and fans, temperature on electrical gear, and trend data already sitting in the building management system.
| Strategy | What triggers the work | Facility example | Strength | Weak spot |
|---|---|---|---|---|
| Reactive | Equipment failure | Restroom exhaust fan or a non-critical sump pump | No planning effort | Emergency labor, secondary damage, tenant disruption |
| Preventive | Calendar or runtime interval | Filter changes, belt checks, quarterly lubrication | Simple and easy to audit | Over-services healthy assets and misses failures between visits |
| Condition-based | A reading crosses a fixed limit | Alarm when bearing temperature passes a set point | Acts on actual condition | Fixed limits can fire late and need reliable sensors |
| Predictive | A trend or model forecasts failure | Rising vibration slope on a chilled water pump motor | Repairs timed early and parts staged | Needs baselines, history, and disciplined follow-up |
What the Research Actually Reports, and How to Read It
Published results are encouraging, but most come from industrial plants, so treat them as directional for buildings. The ranges below are widely cited from McKinsey, Deloitte, and the U.S. Department of Energy O&M Best Practices Guide.
How to use these numbers responsibly
- Build budgets on the conservative end of each range, then replace it with your own measured baseline.
- Remember that mature programs produce the top-end results, while a first pilot rarely does.
- A noisy model that raises too many false alarms can cost more in wasted technician visits than it saves.
Which Facility Assets Deserve Monitoring First
Not every asset earns a sensor. Rank equipment by what happens when it fails and by whether it gives early warning signs, then start in the top-right quadrant.
The Signals That Predict Failure, Asset by Asset
Match the signal to the failure mode. A fan bearing announces itself through vibration, while a loose electrical lug shows up as heat.
| Asset | Condition signal | Method | What it can reveal | Typical work order |
|---|---|---|---|---|
| Chillers | Approach temperature, refrigerant pressures, motor current | BMS trends and clamp sensors | Fouled tubes, low charge, compressor wear | Tube cleaning or leak check |
| Air handler fans and motors | Vibration, bearing temperature, static pressure | Wireless vibration sensors | Imbalance, misalignment, bearing wear | Bearing replacement or realignment |
| Pumps | Vibration, discharge pressure, motor amps | Sensors plus drive data | Cavitation, seal leakage, impeller wear | Seal or impeller service |
| Boilers and steam traps | Stack temperature, acoustic signature | Ultrasound and BMS data | Failed traps, scaling, burner drift | Trap replacement or tuning |
| Electrical panels and switchgear | Surface temperature at connections | Infrared thermography | Loose or corroded connections | Retorque and re-inspect |
| Compressed air and vacuum | Leak noise, run hours, pressure decay | Ultrasonic survey | Leaks, worn valves, failing motors | Leak tagging and repair |
The Five-Layer Predictive Maintenance Stack
Predictive Playbooks by Building System
Each building system fails in its own way, so the monitoring approach should follow the failure mode rather than a single sensor package.
Where AI Helps Predictive Maintenance in 2026, and Where It Does Not
AI adds the most value where data is plentiful and failure patterns repeat. It adds the least where records are thin or every building behaves differently.
Working well today
- Anomaly detection that learns each asset's normal pattern from building automation data
- Ranking alerts so technicians see the few that matter first
- Plain-language summaries of what changed on an asset and when
- Spotting slow efficiency drift in chillers and air handlers that people rarely notice
Still needs care
- Remaining useful life estimates, which need real failure history that most buildings lack
- Models trained on one site and applied to another without local baselines
- Automated decisions on life safety equipment, which should stay under human review
- Forecasts built on incomplete work order records
A 90-Day Pilot Plan That Produces Evidence
Data Quality Rules That Protect Your Alerts
- Tag every sensor to a single asset ID so readings never float free of the asset register.
- Measure at the same point and orientation every time, especially on motors and fans.
- Log operating state, because a fan at low speed and a fan at full speed read very differently.
- Keep clocks consistent so sensor events line up with work order timestamps.
- Record a fresh baseline after any major repair or replacement.
- Recalibrate or retire sensors that drift, or that stay silent for long periods.
From Sensor Alert to Completed Work Order
Oxmaint brings asset records, preventive maintenance schedules, work orders, inspections, mobile workflows, inventory, and reporting dashboards into one system, so condition alerts land in the same queue technicians already work from. You can book a demo to see an alert-to-work-order flow built around your equipment.
Building the Business Case: A Simple ROI Worksheet
Finance teams respond to a worksheet built on your own numbers rather than industry averages. Use these five inputs and revisit them after the pilot.
Keep the worksheet honest by logging false alarms as a cost and counting an avoided failure only when a technician confirms the defect during inspection.
Why Predictive Programs Stall, and How to Avoid It
Most stalled programs share one root cause: the technology works, but nobody owns the response. Compare the two operating models below.
Alerts without a workflow
- Alarms land in an inbox nobody owns
- Technicians learn to ignore repeated false alarms
- No record of what was found, so thresholds never improve
- Parts are ordered after diagnosis, adding days of delay
Alerts inside a CMMS
- Every alert becomes a tracked work order with an owner
- False alarms are coded and used to tune rules
- Findings stay on the asset record for the next technician
- Critical spares are reserved when the work order is created
The KPIs That Prove Predictive Maintenance Is Working
Pick four to six measures, publish them monthly, and review them with operations leadership. Measures tied to tenant comfort and downtime hours tend to move budgets more than measures only maintenance staff see.
Predictive Maintenance Readiness Checklist
- Asset register is complete, with unique IDs, locations, and criticality ratings
- Failure history exists for the last two to three years, even if it is imperfect
- Preventive maintenance schedules are current and technicians complete them on time
- Critical assets are ranked by consequence of failure and by detectable warning signs
- Building automation points are documented and accessible
- Someone owns alert review and has authority to raise work orders
- Critical spares are identified and stocked or reservable
- Success measures are agreed before the pilot starts



.jpeg)

