Waste diversion and circular economy practices in facility management have shifted from sustainability storytelling to measurable operational discipline — the kind that shows up in diversion rates, vendor contracts and ESG disclosures. A well-run facility waste management ESG program turns what was once a pure cost line into a defensible contribution to your organization's circular economy targets. The teams winning at circular economy building operations treat waste like any other asset lifecycle: tracked, maintained, optimized and auditable. If you are still managing facility recycling programs on spreadsheets and clipboard logs, Start Free Trial with OxMaint to see how a modern CMMS closes the measurement gap.
Can your facility prove a 75% waste diversion rate — backed by audit-ready data?
Circular economy facility management demands real measurement, vendor accountability and closed-loop tracking. Most buildings claim diversion targets but cannot produce the transaction-level records auditors and ESG frameworks now require. OxMaint turns every waste pickup, recycling stream and asset reuse into traceable work-order data your team can defend.
What is a waste diversion rate and why it anchors circular economy FM
Facility waste diversion rate measures the percentage of total building waste redirected from landfill through recycling, composting, reuse or recovery — the single most cited metric in facility waste ESG reporting.
A 500,000 sq ft commercial portfolio generating 1,200 tons of waste annually that diverts 840 tons achieves a 70% diversion rate. Pushing that to 85% via organics capture and reuse programs removes an additional 180 tons from landfill — typically worth $12K–$18K per year in avoided tipping fees alone.
How to build a facility recycling program that actually moves the diversion needle
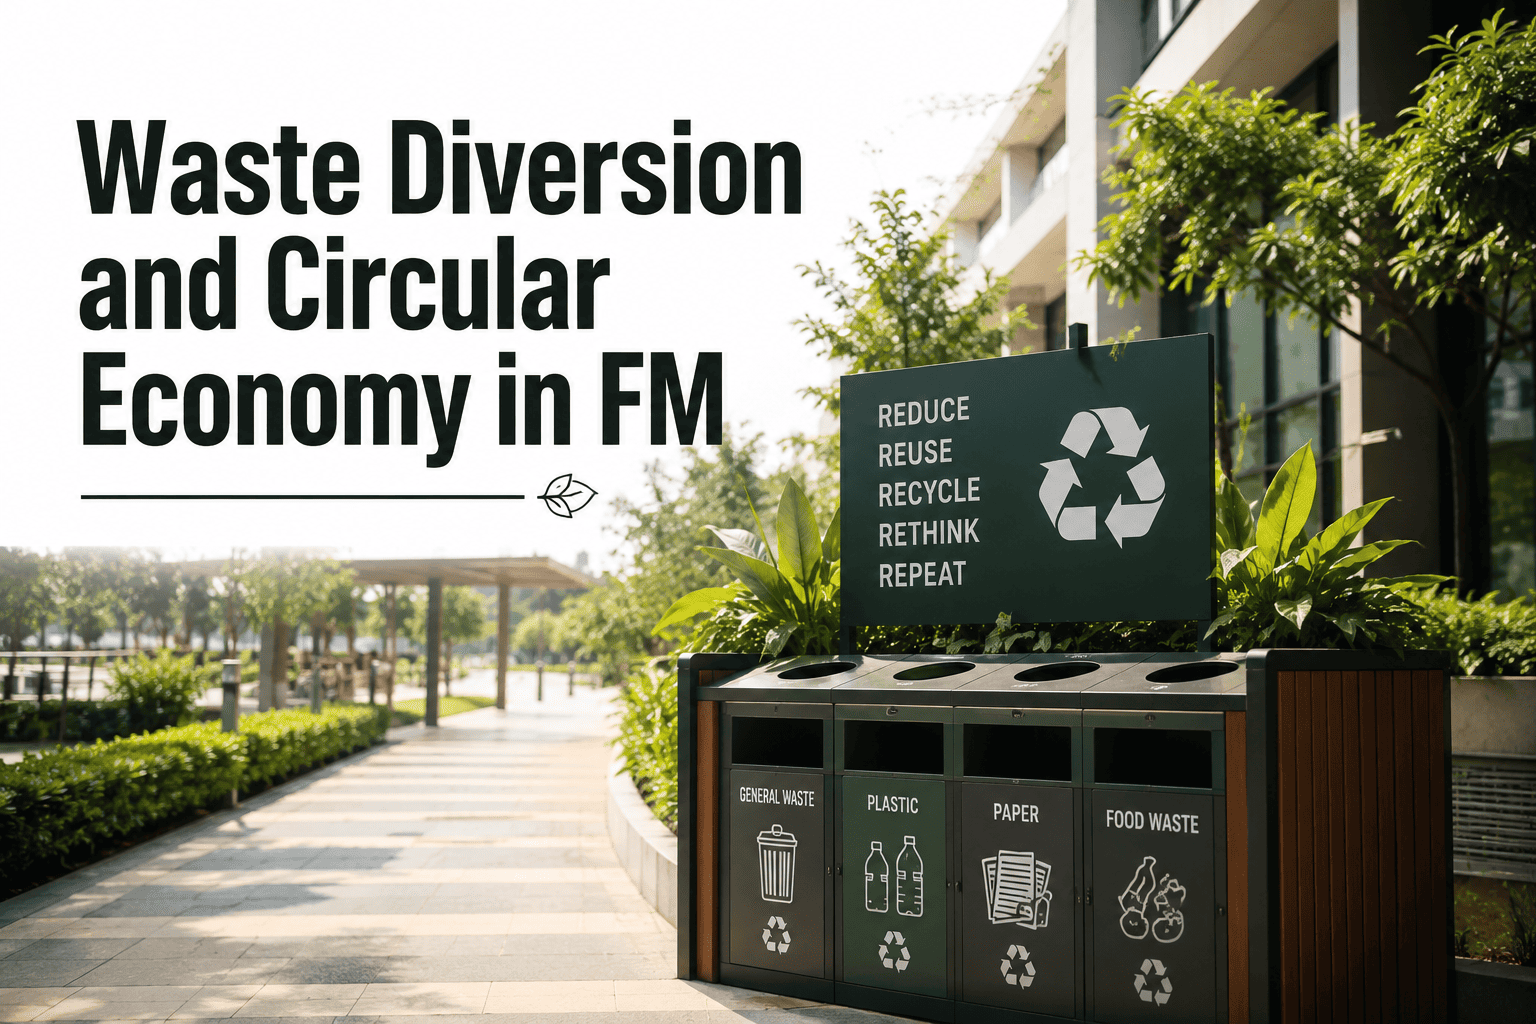
A waste reduction facility management program fails when it lives on a laminated poster. It succeeds when every stream — mixed recyclables, organics, e-waste, construction debris, universal waste — is mapped to a vendor, a pickup cadence and a weigh-back record inside your maintenance system.
Mixed Recyclables
Paper, cardboard, rigid plastics, glass and metal. Target 90% capture. Tie pickup frequency to compactor fullness sensors rather than fixed schedules to cut overflow and missed pickups by 25%.
Organics & Compost
Food waste, landscaping debris, soiled paper. Often 30–40% of building waste by weight yet the least captured stream. On-site or hauler composting can lift overall diversion by 15–20 percentage points.
E-Waste & Universal
Lamps, ballasts, batteries, electronics. Regulated in most jurisdictions. Track serial numbers and disposal certificates per item — auditors demand chain-of-custody proof, not aggregate weights.
Construction & Demo Debris
Drywall, concrete, metal studs, ceiling tile from TI and renovation projects. Can represent 60%+ of a building's waste by weight in a retrofit year. Require vendor diversion reports on every project over $10K.
Furniture & Asset Reuse
Chairs, desks, partitions, IT hardware. The circular economy facility management lever — redirect to refurbishment, donation or resale instead of disposal. Requires asset-level tracking in your CMMS.
Hazardous & Special
Solvents, paints, adhesives, refrigerants. Excluded from diversion-rate calculations but critical to facility waste ESG compliance. Manifest every container with generator ID, hauler license and disposal facility receipt.
A 6-month roadmap for circular economy building operations
Moving from ad-hoc waste handling to a defensible circular FM operations program takes roughly two quarters. Each phase delivers a standalone compliance and cost benefit.
Baseline Audit & Stream Mapping
Conduct a 7-day waste characterization study. Weigh every stream leaving the building. Identify your current diversion rate — most facilities discover it is 15–20 points lower than estimated.
Vendor Integration & Contracts
Rewrite hauler contracts to require weight tickets per pickup, monthly diversion reports and contamination penalties. Onboard vendors as tracked resources in OxMaint so every pickup auto-logs against the correct cost center.
Infrastructure & Signage Rollout
Standardize bin color-coding and station density (one station per 40 occupants). Deploy QR-coded collection points that auto-generate work orders when contamination or overflow is reported.
Asset Reuse & Circular Procurement
Launch refurbishment and donation workflows for furniture and IT assets. Tag reusable items in OxMaint's asset register with condition status and circular disposition path. Set procurement guidelines requiring recycled-content thresholds.
Data Validation & ESG Reporting
Generate your first audit-ready diversion report directly from OxMaint maintenance analytics. Cross-check weight tickets against hauler invoices. Map data to GRI 306, LEED v4.1 and TRUE certification frameworks.
Optimization & Continuous Improvement
Analyze 6 months of stream data to identify contamination hotspots, underperforming vendors and high-yield reuse opportunities. Set quarterly diversion-rate targets and tie them to FM team KPIs.
Why most building waste diversion claims fail an ESG audit
Auditors reject diversion claims for three reasons: no transaction-level weight records, no vendor chain-of-custody documentation and no reconciliation between hauled tonnage and actual disposal facility receipts.
| Dimension | Spreadsheet-Based Waste Tracking | OxMaint-Powered Circular FM |
|---|---|---|
| Weight Records | Monthly aggregate estimates from hauler invoices | Per-pickup digital weight tickets with photo proof and GPS timestamp |
| Vendor Accountability | No way to verify disposal facility or catch contamination fees | Vendor scorecards auto-generated from work-order data and SLA breaches |
| ESG Report Prep Time | 3–5 days per quarter of manual data consolidation | One-click diversion report filtered by building, stream and date range |
| Audit Readiness | Scattered PDFs, email chains and clipboard logs | Complete chain-of-custody trail attached to every waste work order |
| Asset Reuse Tracking | Furniture and IT disposals untracked — no circular contribution | Full lifecycle tracking from deployment through refurbishment to resale |
| Cost Visibility | Waste buried in general FM budget — no per-stream cost | Real-time cost per ton per stream with trend analysis and benchmarking |
How OxMaint powers waste diversion facility operations
A real worked example: a 1.2M sq ft corporate campus spending $48K annually on waste hauling was reporting a 62% diversion rate that failed its first ESG audit — no weight-ticket records existed. After implementing OxMaint, the team achieved a verified 81% diversion rate within 8 months and cut hauling costs 18%.
Digital Waste Work Orders
Every waste pickup, bin overflow and contamination incident becomes a tracked work order with vendor assignment, weight-ticket attachment and photo evidence. Eliminates clipboard logs and gives auditors a complete transaction trail per stream.
Real-Time Diversion Analytics
Maintenance analytics dashboard auto-calculates diversion rate by building, stream and month. Spot contamination trends, vendor underperformance and seasonal volume shifts before they become ESG reporting problems.
Circular Asset Lifecycle Tracking
Tag furniture, IT hardware and building components with circular disposition paths — refurbish, donate, resell or recycle. OxMaint's asset register tracks condition, reuse history and recovery value, turning disposal into a measurable circular economy contribution.
Predictive Preventive Maintenance
AI-driven maintenance scheduling on compactors, balers and recycling equipment prevents the breakdowns that cause waste backups, emergency hauling surcharges and missed diversion targets. Equipment uptime directly sustains your diversion rate.
The cost of staying on spreadsheets vs. switching to OxMaint
For a typical 500K–1M sq ft facility portfolio generating 800–1,200 tons of waste annually, the financial gap between ad-hoc tracking and CMMS-powered circular operations is significant.
| Cost & Value Driver | Current (Spreadsheets) | With OxMaint | Annual Impact |
|---|---|---|---|
| Hauling & Tipping Fees | $48,000/yr (baseline) | $39,400/yr (optimized pickup frequency + reduced tonnage) | −$8,600 |
| ESG Report Preparation | $6,400/yr (3–5 days × 4 quarters of staff time) | $800/yr (automated reporting, under 2 hours/quarter) | −$5,600 |
| Asset Recovery Value | $0 (disposal untracked) | $14,200/yr (furniture + IT reuse and resale) | +$14,200 |
| Contamination Penalties | $4,800/yr (undetected stream contamination) | $900/yr (real-time issue detection and vendor accountability) | −$3,900 |
| Audit Penalty Exposure | $15,000+ risk per failed ESG audit | Negligible (complete chain-of-custody documentation) | Risk eliminated |
| Net Annual Value | — | — | +$32,300/yr |
"Within eight months on OxMaint we moved from an unverifiable 62% diversion rate to an audit-certified 81% — and our hauling costs dropped 18% because we finally had per-stream data to renegotiate pickup frequency."
— Facilities Director, 1.2M sq ft corporate campus portfolio
See OxMaint turn your waste streams into audit-ready ESG data
Book a 30-minute demo and we will map your facility's waste streams, vendors and diversion targets to the OxMaint platform — live on your own building data.
Waste diversion and circular economy facility management — answered
What is a good waste diversion rate for a facility?
A facility waste diversion rate of 75% or higher is considered strong and aligns with TRUE Gold and LEED v4.1 circular economy credits. Most buildings without a formal program sit at 30–40%. Hitting 75%+ typically requires capturing organics (which alone can add 15–20 percentage points), tight vendor management and per-pickup weight tracking — all of which OxMaint standardizes through digital work orders and real-time analytics.
How does circular economy facility management differ from traditional recycling?
Traditional facility recycling programs focus on diverting common recyclables (paper, plastic, glass) from landfill. Circular economy FM operations go further: they track the full lifecycle of building assets — furniture, IT hardware, building materials — and actively redirect them into refurbishment, donation or resale loops. It also embeds circular procurement criteria and measures recovery value, not just diversion weight. You can Book a Demo to see how OxMaint's asset register supports circular disposition tracking.
How do you measure and report facility waste diversion for ESG?
Diversion rate is calculated as diverted waste (recycled + composted + reused) divided by total waste generated, multiplied by 100. For ESG reporting under GRI 306 or similar frameworks, you need transaction-level records: per-pickup weight tickets, vendor chain-of-custody documentation and disposal-factory receipts. Most teams fail audits because they rely on monthly hauler invoice estimates. OxMaint captures every waste transaction as a work order with attached weight tickets, producing audit-ready reports in minutes.
What waste streams should a facility recycling program include?
At minimum, a building waste diversion program should track six streams: mixed recyclables, organics/compost, e-waste and universal waste (lamps, batteries), construction and demolition debris, furniture/asset reuse, and hazardous/special waste. Each stream needs a dedicated vendor, a documented pickup cadence and weight-tracking records. Streams like organics and asset reuse deliver the largest diversion-rate gains because they capture weight categories that traditional recycling misses entirely.
How long does it take to implement a waste diversion program in facility operations?
A properly structured implementation takes 4–6 months: Month 1 for baseline auditing and stream mapping, Month 2 for vendor integration and contract updates, Month 3 for infrastructure and signage rollout, Month 4 for asset reuse and circular procurement workflows, and Months 5–6 for data validation, ESG report generation and optimization. Teams using OxMaint typically compress this timeline because the CMMS platform handles work-order creation, vendor tracking and analytics from day one — eliminating the data infrastructure build.
Stop estimating your diversion rate. Start proving it.
Join the facility teams using OxMaint to turn waste handling into measurable, audit-defensible circular economy contributions — with real weight tickets, real vendor accountability and real diversion gains.
Free 14-day trial · No credit card