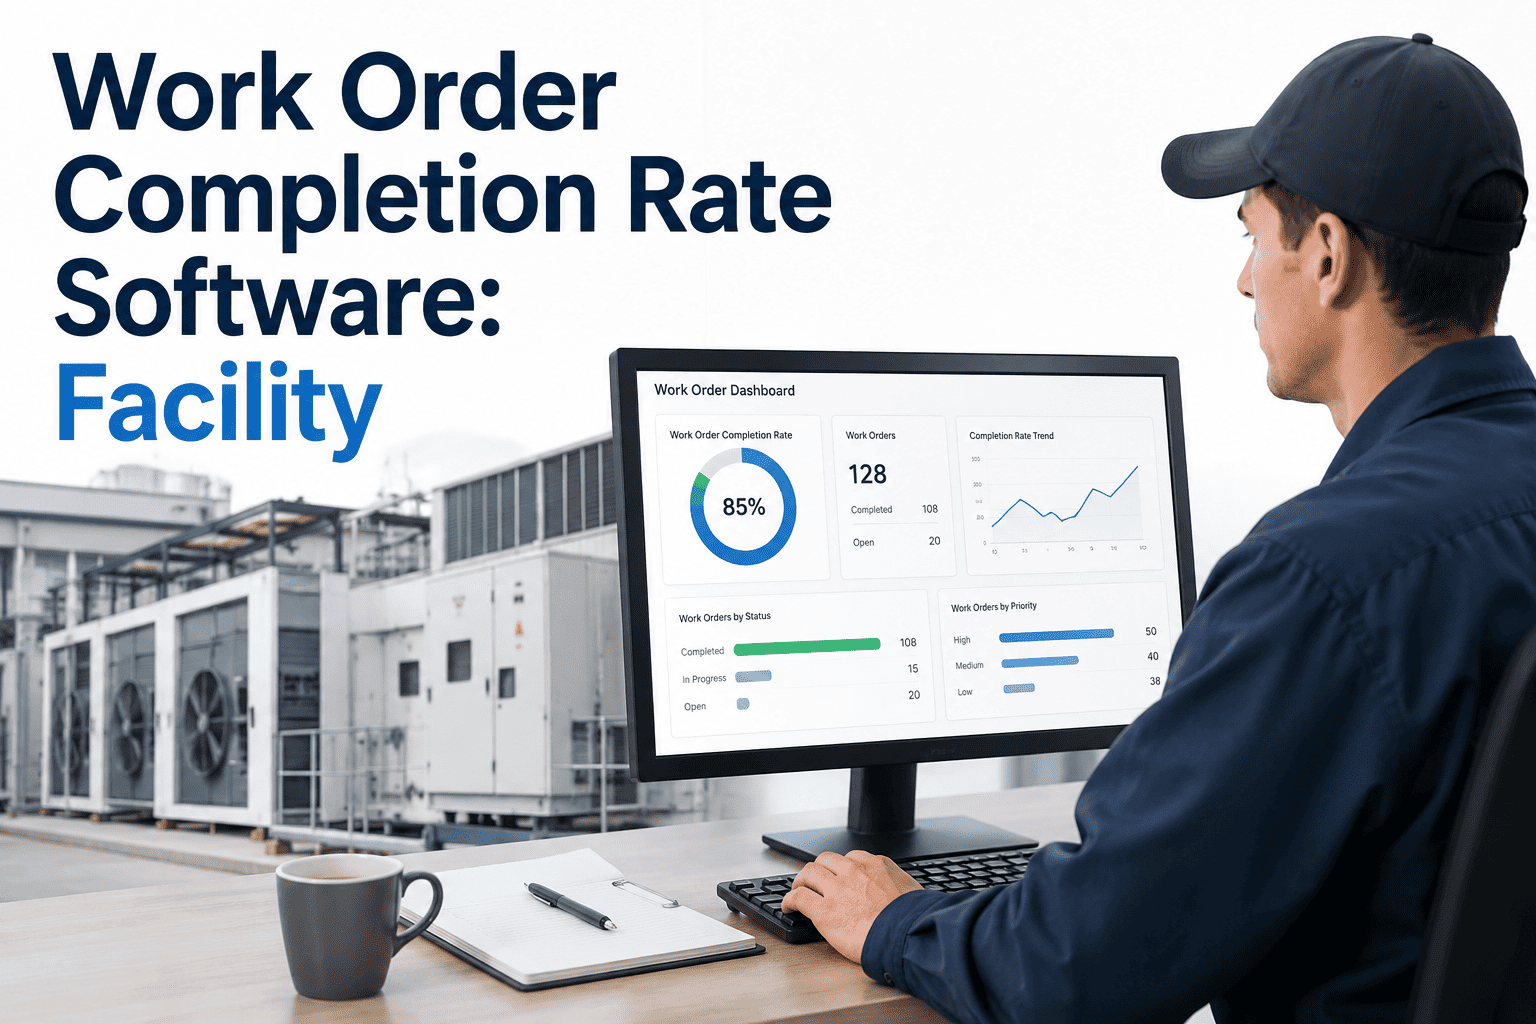
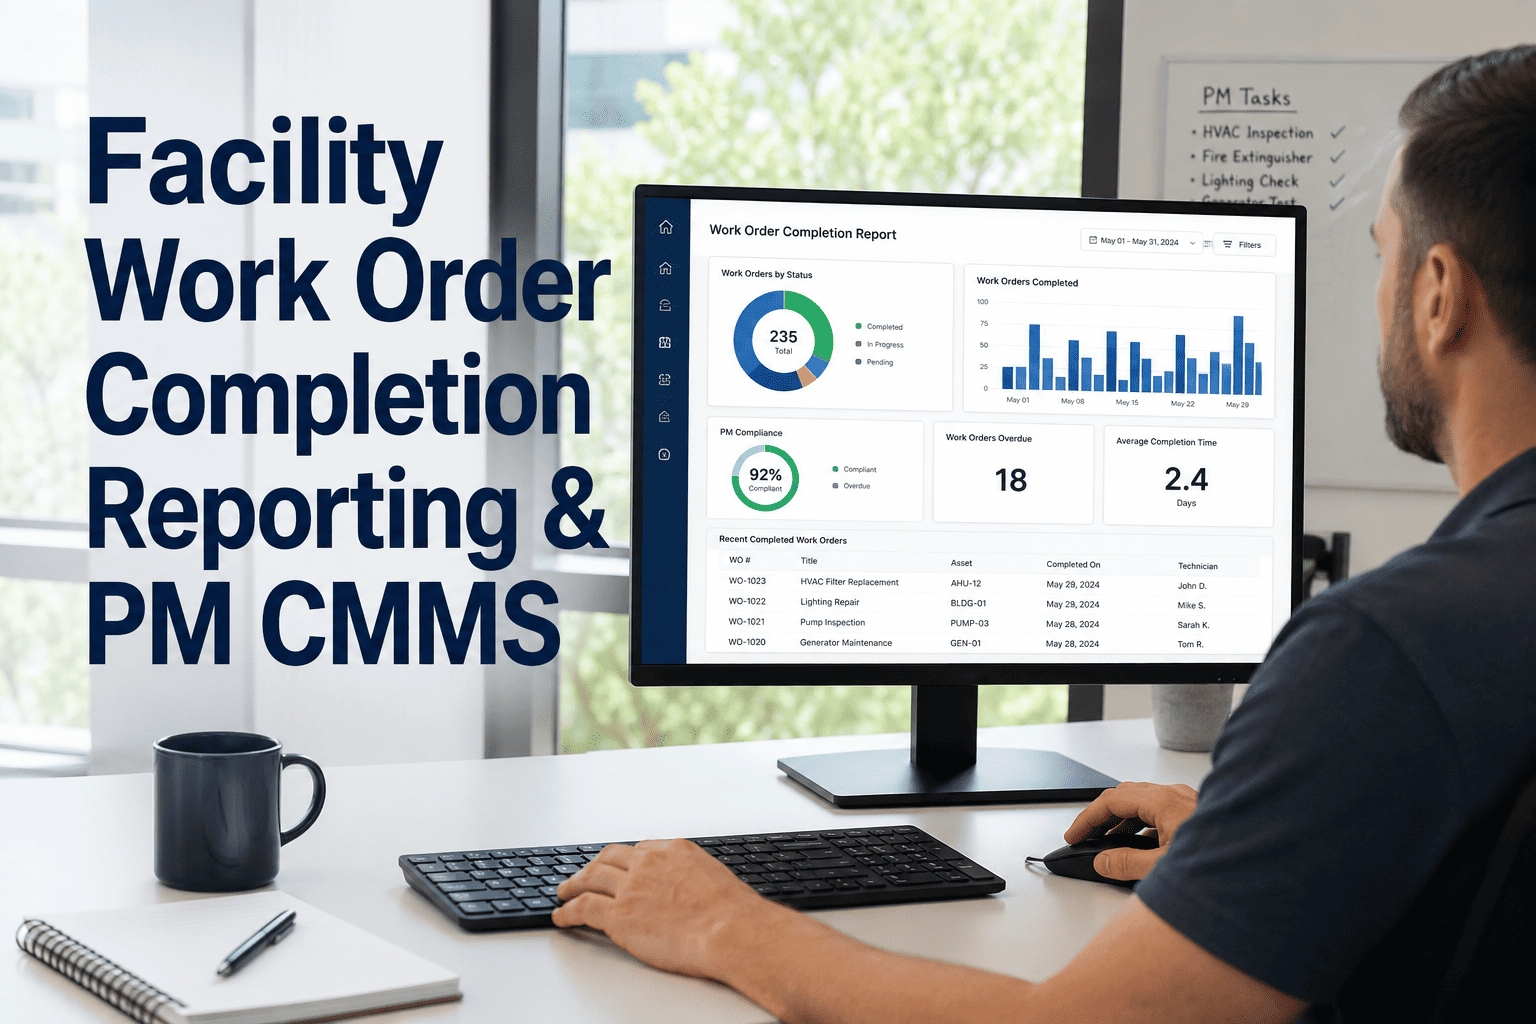
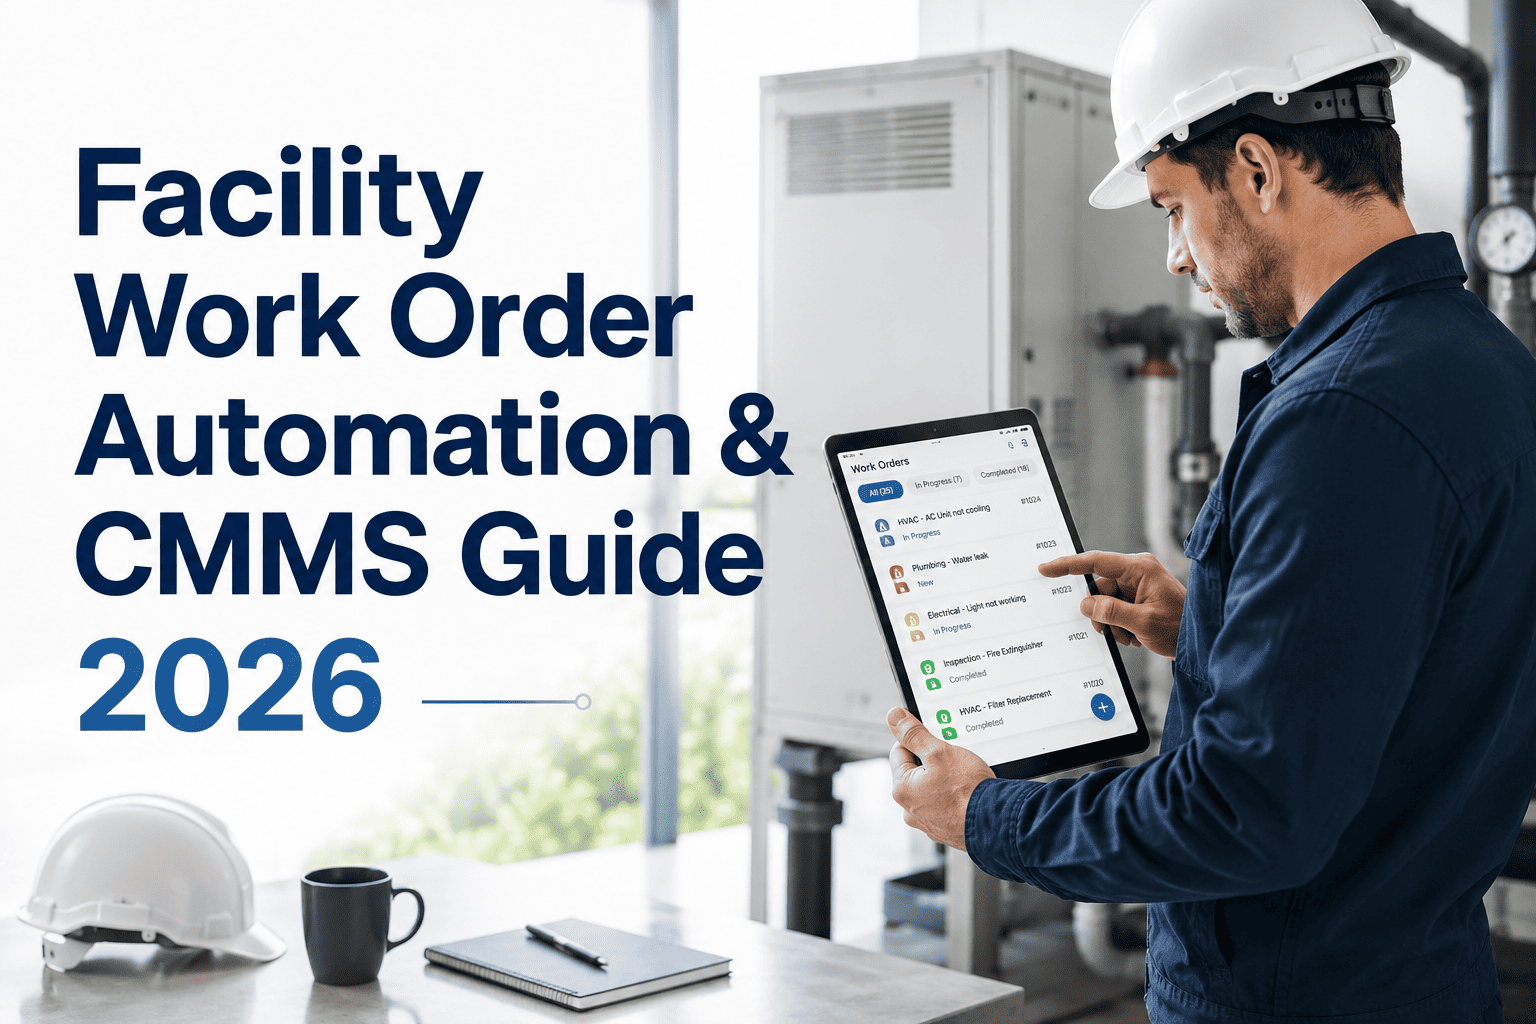
Work order completion rate is the one number that tells you whether your maintenance program is actually working or just generating paperwork. Facilities still running on spreadsheets and paper logs routinely close out fewer than half of their assigned work orders on time, while backlog quietly stretches into weeks of unresolved repairs. Every missed work order is a piece of equipment running past its safe service window, a warranty clause at risk, and a compliance gap waiting to surface during an audit. Facility and maintenance teams are replacing manual tracking with software built specifically to assign, track, and close work orders with a verified digital trail. This guide breaks down what a healthy completion rate looks like, the metrics that actually move it, and how the right platform turns a guess into a live number your whole team can act on. Start a free trial and see your real completion rate this week.
Work Order Management
Facility CMMS
2026 Benchmark Guide
Where Does Your Work Order Completion Rate Stand?
Completion Rate = Work Orders Closed On Time ÷ Work Orders Assigned — tracked live inside your CMMS
The Real Gap
Spreadsheet Tracking vs. CMMS Tracking
Manual Tracking
Work requests get lost in email or paper logs
No timestamp trail from assignment to closure
Backlog only discovered during monthly review
Completion rate is a guess, not a number
Reactive baseline sits near 31 to 45 percent
CMMS Tracking
Every request logged, assigned, and time-stamped
Mobile sign-off closes the loop in real time
Backlog visible on a live dashboard, not a spreadsheet
Completion rate calculated automatically, by asset
Facilities routinely reach 90 percent or higher
The Metrics That Matter
6 Metrics That Reveal Your True Completion Rate
01
PM Compliance Rate
The share of scheduled preventive tasks finished on time. It is the single strongest predictor of rising emergency repairs weeks later.
World-class benchmark: 90%+
02
First-Time Fix Rate
How often a technician resolves the issue on the first visit, without a callback, missing part, or repeat work order.
Target benchmark: 80%+
03
Backlog Aging
Open work orders sorted by how long they have sat unresolved. A shrinking 30, 60, 90-day backlog is a sign the program is healthy.
Goal: trending down every month
04
Planned vs Reactive Ratio
The split between scheduled work and emergency firefighting. Reactive-heavy teams spend far more on every repair.
Target: 70% planned or higher
05
SLA Compliance Rate
The percentage of work orders closed within the response and resolution windows your facility has committed to.
Target benchmark: 90%+
06
Technician Response Time
Time between a work order being created and a technician acknowledging or starting it. Slow response is the first sign of a scheduling gap.
Tracked from timestamp to timestamp
Stop Guessing. Start Tracking Every Work Order.
Oxmaint gives your team automated work order assignment, mobile closeout, and a live completion rate dashboard by asset, technician, and site. See exactly where work is slipping before it turns into downtime.
Benchmarks By Facility Type
What a Healthy Completion Rate Looks Like, By Facility
Implementation Path
4 Steps to Raise Your Completion Rate
Step 1
Baseline and Categorize
Weeks 1 to 2
Pull every open and closed work order into one system. Tag each as planned, preventive, or reactive to see your true starting number.
Step 2
Automate Assignment and Alerts
Weeks 3 to 6
Route new requests to the right technician automatically and trigger alerts the moment a work order approaches its due date.
Step 3
Mobile Closeout and Digital Sign-Off
Weeks 6 to 10
Move technicians off paper. Every completed job is time-stamped, photographed, and signed off from the floor in seconds.
Step 4
Dashboard Reporting and Review
Month 3 onward
Review completion rate, backlog age, and SLA compliance weekly with your team, and adjust staffing or scheduling where the data points.
From The Field
What Facility Teams Say After Switching
Before our CMMS, work orders lived in three different inboxes and a whiteboard. We had no real completion number, just a feeling that things were behind. Once every request was logged and timestamped in one system, our completion rate went from an estimated 40 percent to a verified 91 percent in under six months, and our backlog stopped growing.
Facilities Operations Manager
Multi-Building Commercial Portfolio
The biggest change was not the software, it was the visibility. Once technicians closed work orders from their phones, management could see backlog by building in real time instead of waiting for a monthly report. That single shift pushed our on-time completion rate above 90 percent and cut emergency callouts nearly in half.
Director of Maintenance
Regional Healthcare Facility Group
Your Backlog Has a Number. Go Find It.
Most facilities are running well below their real capacity to close work orders on time. Oxmaint shows you exactly where every request stands, who owns it, and how close you are to a world-class completion rate.
Common Questions
Work Order Completion Rate — Frequently Asked Questions
What is a good work order completion rate for a facility?
Most industry benchmarks place world-class performance at 90 percent or higher, closed on time and to standard. Facilities still on paper or spreadsheets typically sit closer to 40 to 55 percent.
Start a free trial to establish your own baseline this week.
How is work order completion rate actually calculated?
Divide the number of work orders closed on time by the total number assigned in the same period, then multiply by 100. A CMMS calculates this automatically by asset, site, and technician rather than by manual count.
Why do work orders get missed even with a CMMS in place?
Usually it comes down to unclear ownership, parts unavailability, or no automated escalation when a due date is approaching.
Book a demo to see how automated routing and alerts close that gap.
What is the difference between completion rate and PM compliance?
Completion rate covers every work order, planned and reactive. PM compliance measures only scheduled preventive tasks completed on time. A strong facility tracks both, since a drop in PM compliance predicts a rise in reactive work weeks later.
How fast can a facility improve its completion rate after switching to CMMS software?
Many teams move from a 30 to 45 percent reactive baseline to 90 percent or higher within the first 60 to 90 days of consistent use.
Start a free trial to begin tracking your own progress immediately.
Turn Every Work Order Into a Closed Work Order
Oxmaint gives your facility team automated assignment, mobile closeout, and a live completion rate dashboard built for accountability. See the gap between where you are and world-class performance, then close it.