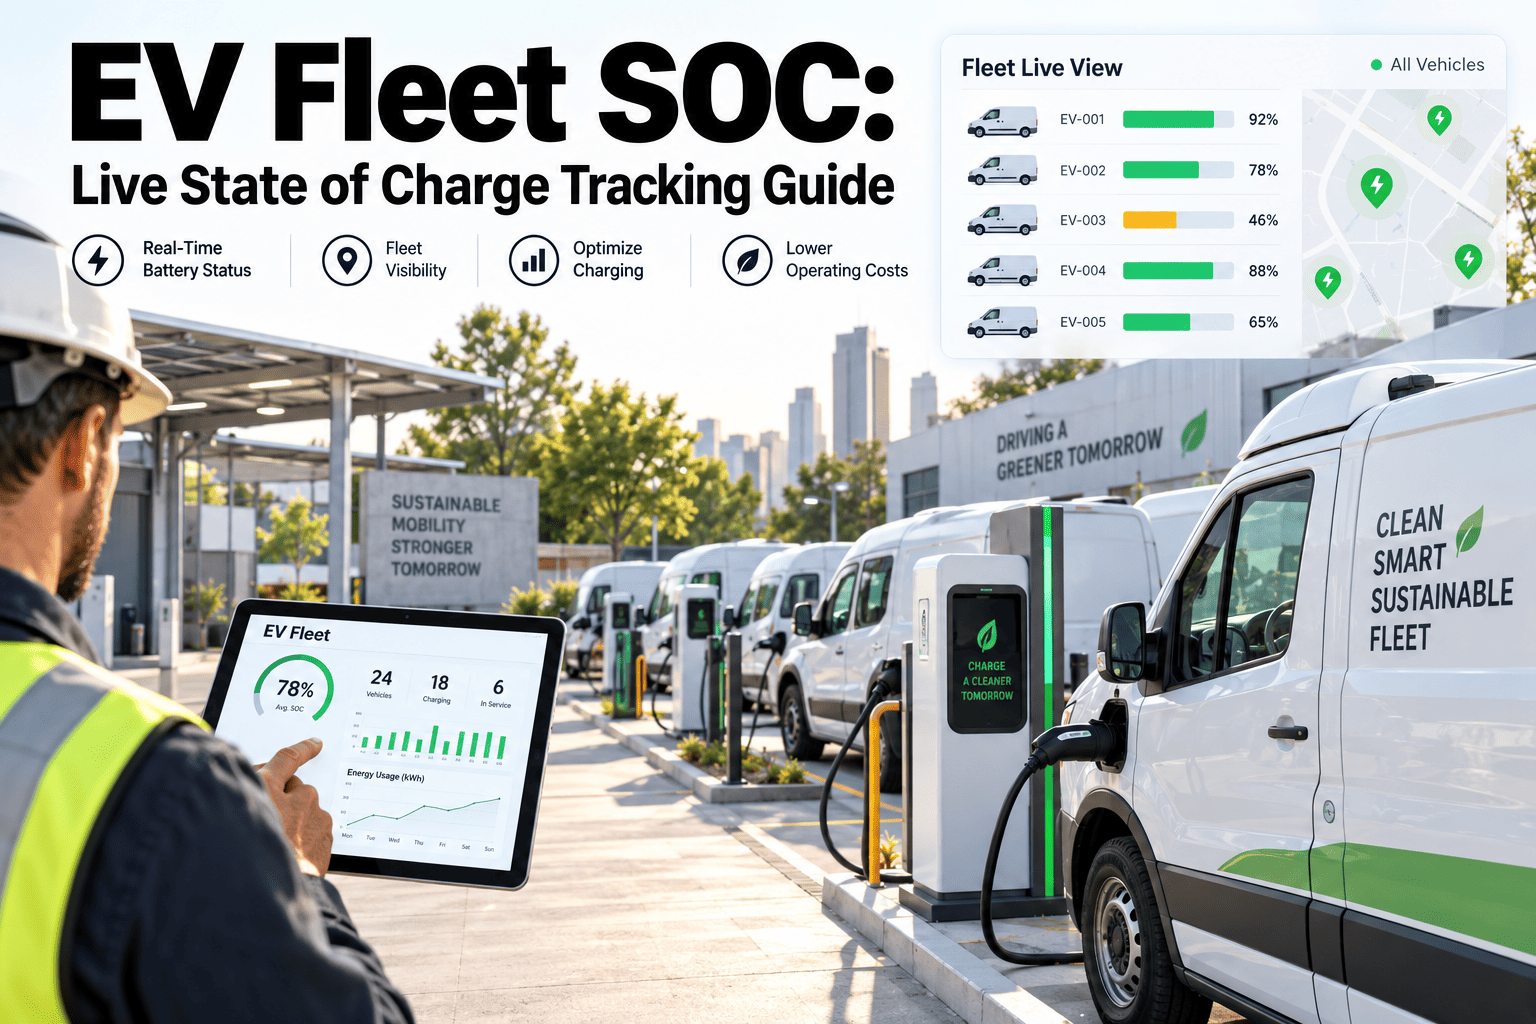
An EV fleet does not run out of fuel the way a diesel truck does — it runs out of state of charge, and the warning signs look completely different. A driver watching a fuel gauge drop through a quarter tank has minutes to plan. A driver watching state of charge drop through 20% in cold weather, on a loaded route, with the next fast charger occupied, is looking at a very different clock. This guide covers how top EV fleets track SOC live, set alert thresholds, and build the 20-80% charging discipline into daily dispatch, and where a connected maintenance platform like Oxmaint fits into that workflow.
ELECTRIC FLEET OPERATIONS · STATE OF CHARGE · DISPATCH RELIABILITY
EV Fleet SOC: Live State of Charge Tracking Guide
State of charge drives every dispatch decision an EV fleet makes. See the live tracking approach, the alert thresholds, and the 20-80% policy the best-run electric fleets follow every day.
The SOC Band Every Dispatcher Should Be Watching
A battery's usable range is not 0% to 100% in practice — treating it that way is how batteries degrade early and how vehicles get stranded. Fleets that manage SOC well operate inside a defined band and only step outside it deliberately.
0–20%
20–80%
80–100%
Reserve buffer — avoid routine use | Daily operating band | Reserved for long trips only
Why The 20-80% Rule Exists — And Why It Is A Fleet Policy, Not A Suggestion
Charging past 80% and discharging below 20% both accelerate lithium-ion battery degradation over the vehicle's life. For a single consumer EV that is an inconvenience. For a fifty-vehicle fleet where battery replacement runs into five figures per unit, it is a capital expense schedule.
Dispatchers who ignore the band because a route "just barely" fits outside it are quietly shortening battery life across the fleet, one exception at a time. The fix is not driver judgment — it is a dispatch rule enforced by live SOC visibility, so exceptions require a documented reason rather than a guess.
Building A Live SOC Monitoring Workflow
Live tracking only works if it changes a decision before the vehicle leaves the yard, not after it is already stranded on route. The workflow below is what separates fleets that manage SOC proactively from fleets that find out about a problem from a stranded driver's phone call.
1
Pre-Trip SOC Check
Every shift starts with a confirmed SOC reading against the day's planned route distance, plus a buffer for payload, terrain, and weather.
2
Route-To-Range Match
Dispatch assigns vehicles so the route fits inside the 20-80% band with margin, rather than assuming best-case range figures.
3
Live Threshold Alerts
Low-charge and high-charge alerts fire automatically as the vehicle crosses defined thresholds, not after a driver notices the dashboard.
4
Charging Zone Confirmation
Charge session start and stop are logged against the asset, confirming the vehicle actually left the charger within the target band.
5
End-Of-Shift Reconciliation
SOC delta versus miles driven feeds back into range planning, catching degradation trends before they become breakdowns.
Alert Thresholds Top EV Fleets Actually Use
Alert thresholds should not be a single number. Different SOC levels call for different responses, from a quiet dashboard note to an active dispatch intervention.
| SOC Level | Signal | Required Action |
|---|---|---|
| Below 15% | Critical low-charge alert | Immediate reroute to nearest charger; treat as a road-call risk |
| 15–20% | Low-charge warning | Flag to dispatch; no new route assignment until charged |
| 20–80% | Normal operating band | No action required — this is the target daily range |
| 80–90% | Charge-complete notice | Move vehicle off charger promptly to avoid idle fees and free the bay |
| Above 90% | Exception flag | Reserve for confirmed long-distance trips only; log the reason |
Get SOC Alerts Tied To Your Maintenance Record, Not A Separate App
Oxmaint connects charge status, battery health checks, and vehicle inspections to the same asset record dispatch already uses — so a low-SOC event and an overdue inspection show up in one place, not three.
Reactive SOC Management vs Proactive Live Tracking
Reactive
Driver reports low charge after the fact, often mid-route
Dispatch learns of a stranded vehicle from a phone call
Charging left unattended past 80% out of habit
Battery health tracked informally, if at all
Range planning based on manufacturer best-case figures
Proactive Live Tracking
SOC checked and matched to route before the vehicle leaves the yard
Low-charge alerts trigger dispatch action automatically
Charging zone alerts flag when a vehicle should leave the charger
Battery State of Health logged against the asset record over time
Range planning adjusted for payload, terrain, and weather in real time
Battery State Of Health Versus State Of Charge: Two Numbers, One Decision
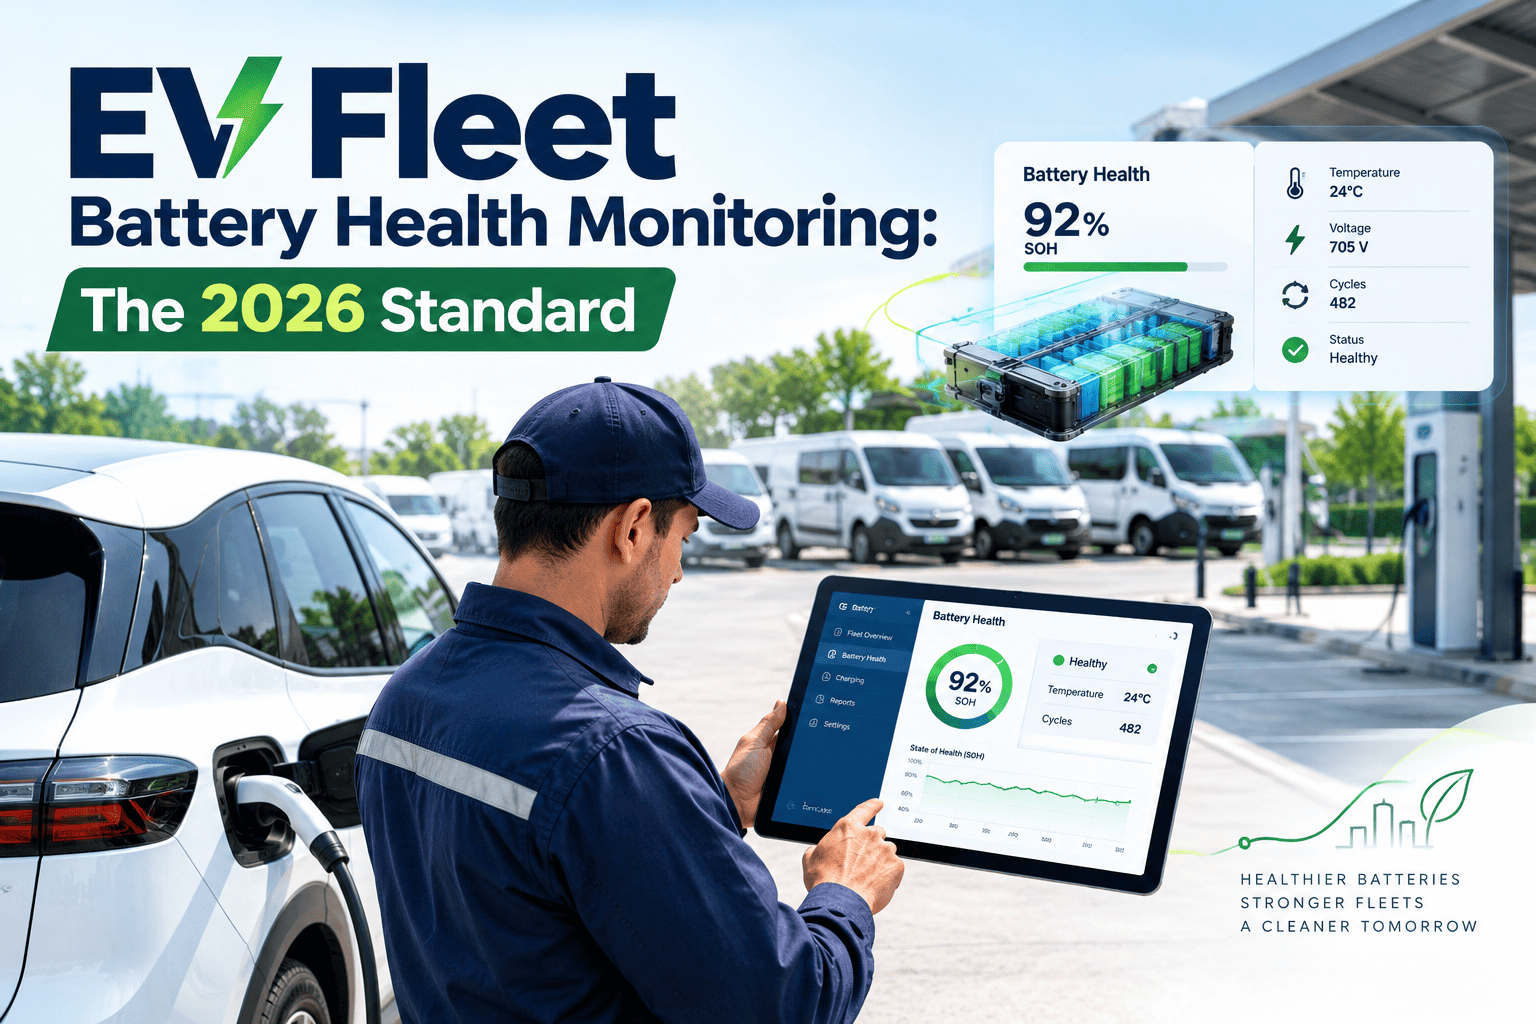
SOC and State of Health answer different questions, and fleets that conflate them make worse decisions than fleets that track both separately. State of charge answers "how much usable energy is in the pack right now." State of Health answers "how much total capacity does this pack still have compared to when it was new."
A vehicle can show a perfectly normal 80% SOC reading while its underlying State of Health has quietly dropped to 85% of original capacity — meaning that 80% reading now represents meaningfully less real range than it did a year earlier. Route planning built only on SOC percentage without accounting for the declining State of Health baseline is how a fleet ends up with a vehicle that "should" make a route on paper but does not in practice. Reviewing both numbers together, and flagging any asset whose State of Health has dropped past a defined threshold for closer route restriction, catches this before it becomes a stranded driver.
Pain Points Multi-Vehicle EV Fleets Run Into Without Live SOC Data
Mid-Route Stranding
A vehicle dispatched on optimistic range assumptions runs out of usable charge before reaching a charger, triggering a costly road call and a missed delivery window.
Charger Contention
Multiple vehicles converge on the same charging bay at shift change because nobody staggered charge sessions against live SOC data.
Silent Battery Degradation
Repeated full charges and deep discharges quietly shorten battery life, and the fleet only notices when range drops noticeably years later.
Idle Fee Creep
Vehicles left on public chargers past completion rack up idle fees that nobody is tracking against a specific asset or driver.
The Metrics A Fleet Director Should Review Weekly
SOC tracking is only valuable if it feeds decisions above the individual driver level. A weekly portfolio view should answer four questions without requiring a manual pull from telematics exports.
AHow many low-SOC alerts fired this week, and were they resolved before becoming a road call?
BWhat percentage of charge sessions stayed inside the 20-80% target band?
CWhich vehicles show a widening gap between rated range and actual delivered range?
DAre any yards or shifts consistently generating charger contention that route planning could avoid?
Why Deep Discharge And Full Charges Degrade Batteries Faster
Lithium-ion cells age through two mechanisms that fleet managers should understand even without an engineering background: calendar aging, which happens simply from time and heat regardless of use, and cycle aging, which happens from the stress of charging and discharging. Both accelerate at the extremes of the charge range.
Holding a battery near 100% for extended periods keeps cell voltage high, which stresses the electrode chemistry and speeds capacity loss. Discharging below roughly 20% pulls cells toward a voltage range where the same chemistry degrades from the opposite direction. The 20-80% band exists because it keeps every cell in the pack away from both stress zones during the vast majority of the vehicle's operating life, reserving the extremes for the occasional trip that genuinely needs them.
Heat compounds both effects. A battery charged to 100% and left in a hot yard overnight degrades faster than the same battery charged to 80% under the same conditions, which is one more reason SOC policy and charging schedule need to be managed together rather than treated as separate systems.
Seasonal Range Planning: Why A Fixed Buffer Fails In Winter
Cold weather reduces usable range within the same nominal battery capacity, both from increased internal resistance and from cabin heating drawing directly off the pack rather than waste engine heat. A route that comfortably fits the 20-80% band in July can run the battery uncomfortably close to the 20% floor in January on the identical mileage.
Fleets that apply a single fixed range buffer year-round are the ones most likely to see winter road calls climb. A live SOC system that adjusts the planning buffer seasonally, or better, dynamically based on ambient temperature and recent consumption data, keeps the daily operating band honest instead of aspirational.
Planning Charging Infrastructure Around Live SOC Data, Not Vehicle Count
A common early-stage EV fleet mistake is sizing charging infrastructure off the number of vehicles rather than the actual SOC patterns those vehicles generate across a shift. Two fleets with the same vehicle count can need very different charger counts depending on route length, shift overlap, and how tightly dispatch holds the 20-80% band.
Live SOC history, tracked over weeks rather than assumed from spec sheets, shows exactly when charge demand peaks, how long vehicles actually sit plugged in past completion, and which yards are approaching contention before it becomes a daily bottleneck. That data turns a charging infrastructure investment into a sized decision instead of a guess padded for safety margin that may never get used.
How Oxmaint Fits Into An EV Fleet's Maintenance Workflow
SOC tracking usually lives in a telematics or charging platform, but the decisions it drives — reroute this vehicle, schedule a battery health inspection, flag this asset for review — belong in the maintenance system alongside every other work order.
Oxmaint logs charge-cycle events, battery health checks, and SOC-related exceptions against the same asset record used for inspections, preventive maintenance, and corrective work orders. A driver flagging inconsistent range on a specific vehicle creates a work order automatically, routed to the technician who handles that yard, with full charge history attached. Dashboards roll SOC compliance, battery health trends, and charging exceptions up to a fleet-wide view so a director can see which vehicles or yards need attention without chasing three separate systems for the answer.
Training Drivers To Work With SOC Data Instead Of Around It
Live SOC tracking only changes outcomes if drivers trust it enough to act on it rather than falling back on habits carried over from diesel routes. A driver who tops off to 100% every night out of old habit, or who ignores a low-charge alert because "it always makes it," quietly defeats the entire monitoring system.
Short, specific training beats a long policy document here. Drivers need to know what the 20-80% band means in practical terms for their specific route, what a low-charge alert requires them to do immediately, and why leaving a vehicle on a charger past completion matters to the fleet's charging capacity, not just their own vehicle. Fleets that pair the alert system with this kind of grounded explanation see far higher compliance than fleets that simply install the technology and assume behavior follows.
What Changes As An EV Fleet Scales Past A Handful Of Vehicles
SOC management for three or four EVs can be handled informally — a dispatcher checking a dashboard, a driver texting when charge runs low. That approach breaks down quickly as a fleet scales past a dozen vehicles across multiple yards, because the coordination problem grows faster than the vehicle count.
At scale, the questions multiply: which yard has spare charging capacity right now, which vehicles are approaching the low-charge threshold simultaneously, which driver needs a route reassignment before their shift starts. Manual coordination that worked for a pilot fleet becomes a full-time job for someone, and errors start costing real money in missed deliveries and road calls. This is the point where live, automated SOC tracking stops being a nice-to-have and becomes the only way the electrification program stays operationally reliable as it grows.
EV Fleet SOC Tracking Questions
Why not just charge every EV to 100% overnight to be safe?+
Routine full charges accelerate long-term battery degradation. Reserve 100% charges for confirmed long-distance trips and keep daily charging inside the 20-80% band.
How often should battery State of Health be checked against SOC data?
Most fleets review State of Health monthly, or immediately when a vehicle's delivered range starts drifting from its rated range in the SOC logs.
Can SOC alerts integrate with our existing telematics provider?
Oxmaint can log SOC-driven events and route them into standard work orders regardless of telematics source. Start a free trial to see the integration on your fleet.
What causes charger contention and how is it fixed?
Contention happens when multiple vehicles hit the same charge threshold at the same time, usually from identical shift patterns. Staggering charge windows based on live SOC data resolves most of it.
Is the 20-80% rule different for cold climates?
The band itself does not change, but fleets in cold climates should widen their route-planning buffer, since cold weather reduces usable range within that same band.
Stop Managing SOC From A Driver's Phone Call
Live state of charge visibility, tied to your maintenance and dispatch record, is what separates EV fleets that scale smoothly from ones that discover problems only after a vehicle is already stranded.