Every EV in your fleet is quietly writing its own resale value into its battery pack, one charge cycle at a time. State of health is the single number that determines how many miles a vehicle can actually run on a full charge, how many more years it has before a pack replacement, and what a buyer will pay for it on the used market. Most fleets only see that number once a year, buried in an OEM portal nobody checks between service visits — by the time a driver reports reduced range, the degradation that caused it has usually been building for months. Sign in to OxMaint to pull battery health data out of the telematics portal and into a system that actually watches it every day.
EV Fleet Battery Health · SOH, SOC & Cycle Monitoring · OxMaint AI
The 2026 Monitoring Stack Top EV Fleets Use to Protect Range, Resale Value & Route Reliability
OxMaint pulls state of health, state of charge, charging cycle counts, and thermal event data straight from EV telematics APIs and turns raw battery telemetry into a preventive work order — before a degrading pack turns into a missed route or a discounted trade-in.
2.3%
Average annual capacity loss across well-managed EV fleets, per recent large-scale telematics analysis
4 yrs
Typical gap in service life between a monitored fleet EV and one running with no charging discipline at all
1.5%
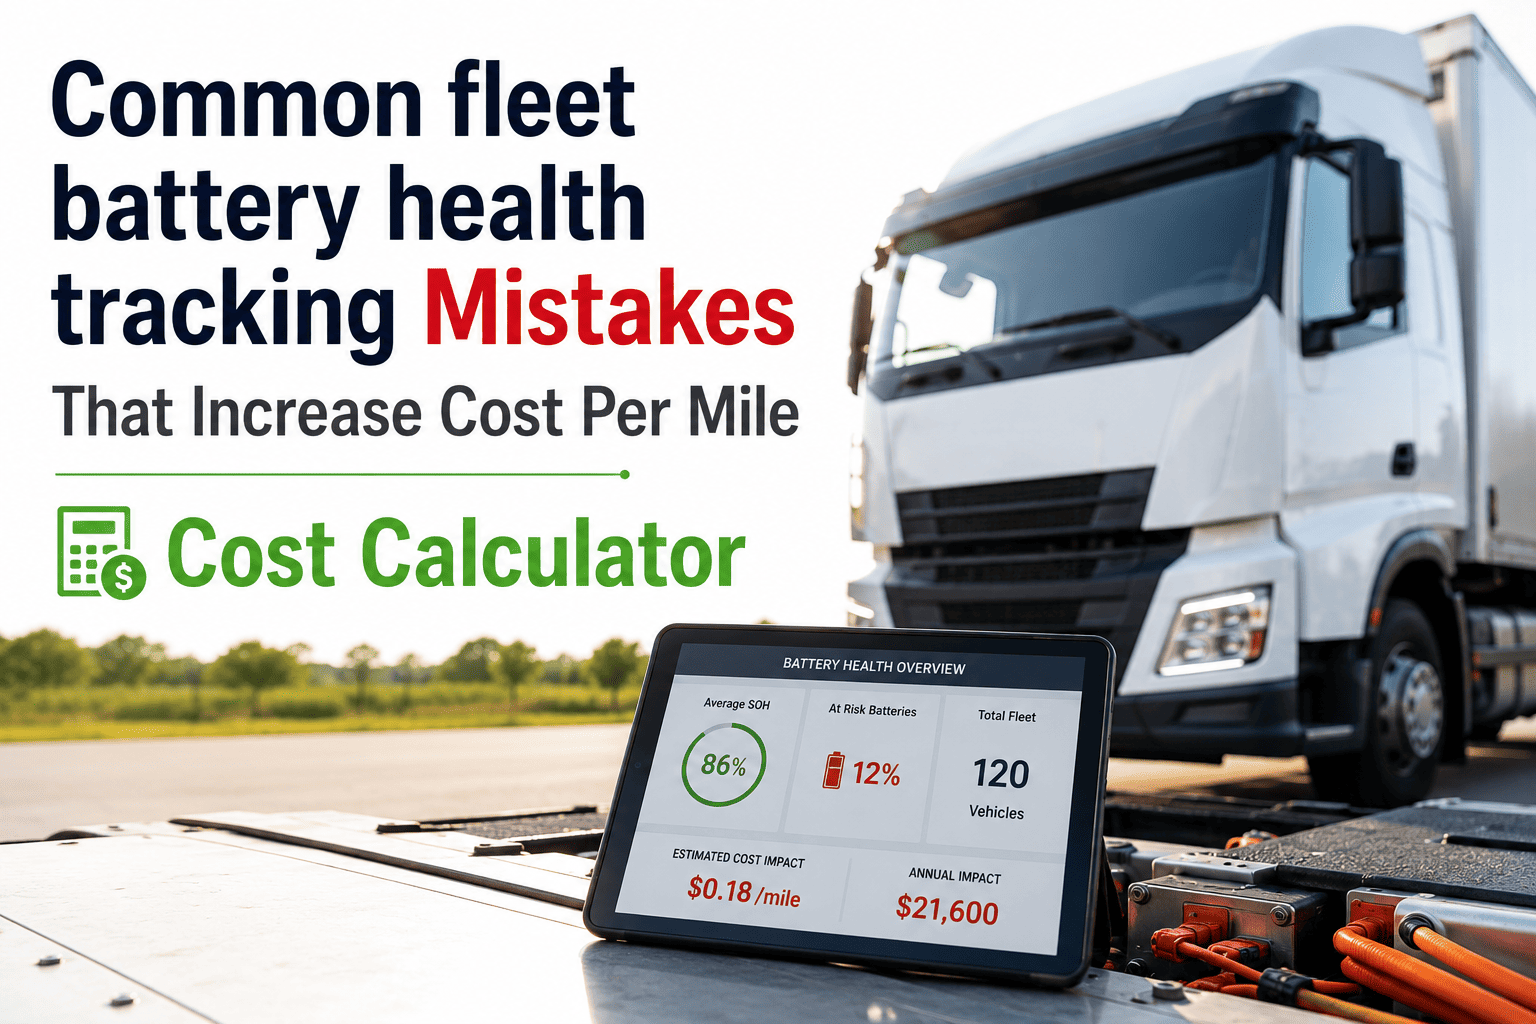
Approximate resale value lost for every 1% drop in battery state of health on the used EV market
$6,000
Value swing between a pack at 92% state of health and one at 75% on an otherwise identical vehicle
80%
The state of health most fleets treat as end of practical service life. Below that line, real-world range drops enough that routes need re-planning and resale buyers start applying steep discounts. Where a pack sits relative to that line — and how fast it's heading there — is the number a monitoring stack is built to watch.
Sign in to OxMaint to see where every vehicle in your fleet sits against that threshold today.
The Four Layers of a Real Battery Health Monitoring Stack
01
SOH — State of Health
Remaining Capacity as a Percentage of Original
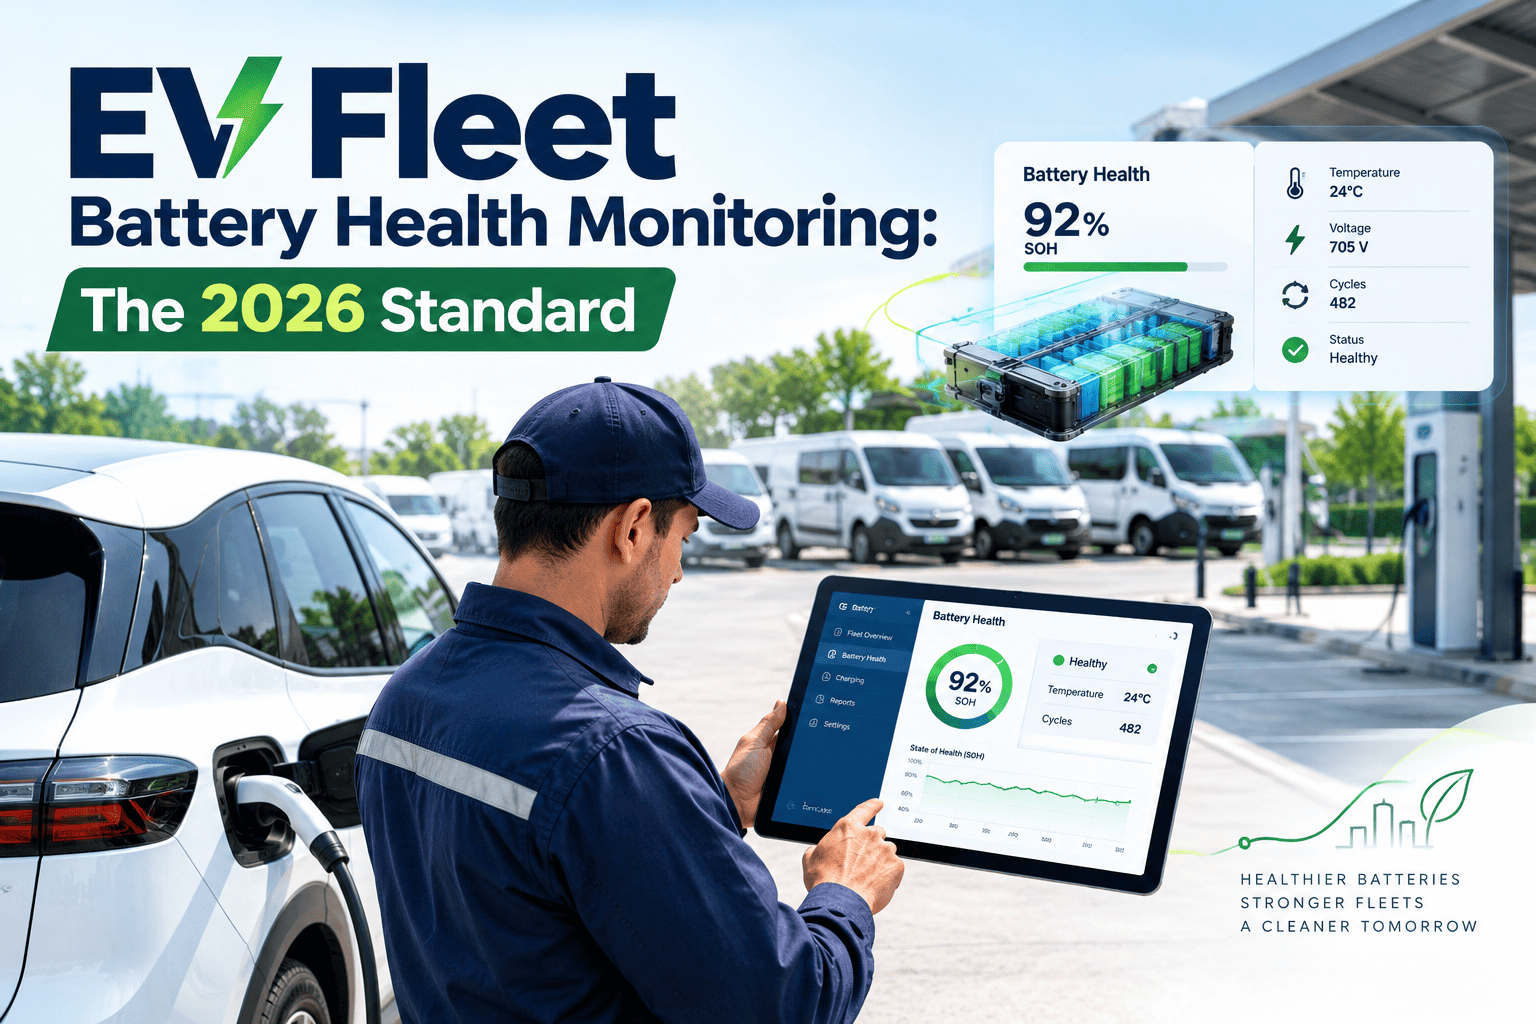
SOH is the headline number — the ratio between what the pack can hold today and what it held new. A 75 kWh pack reading 88% SOH is effectively a 66 kWh pack, and that number drives both route range planning and resale pricing. OxMaint tracks SOH per vehicle over time so a slow, steady decline is visible months before it becomes a range complaint from a driver.
02
SOC — State of Charge
Daily Charging Habits That Decide How Fast SOH Falls
SOC is where degradation actually gets earned or avoided. Fleets that keep daily charging inside a 20–80% band and rely on standard AC charging for routine top-ups see meaningfully slower degradation than fleets that charge to 100% every night and lean on high-power DC fast charging by default. OxMaint flags vehicles running outside the recommended SOC band so a charging habit gets corrected before it shows up as SOH loss.
03
CYC — Charge Cycle Count
The Odometer Reading a Battery Actually Cares About
Mileage tells you how far a vehicle has driven. Cycle count tells you how hard the battery has actually worked, and two vehicles with identical mileage can carry very different cycle loads depending on route length and charging frequency. OxMaint logs cycle counts alongside SOH so a pack's real workload — not just its odometer — feeds into replacement planning.
04
THM — Thermal Events
The Hidden Accelerant Behind Most Premature Degradation
Heat is the multiplier on every other factor on this list — a vehicle charged and parked in hot conditions degrades faster than an identical vehicle kept cool, even with the same SOC discipline. OxMaint logs thermal events reported by the battery management system and correlates them against SOH trend lines, so a pattern of heat exposure gets flagged as a root cause instead of getting written off as normal wear.
OxMaint EV Battery Health Monitoring
Four Signals, One Dashboard, Zero Manual Portal Checks
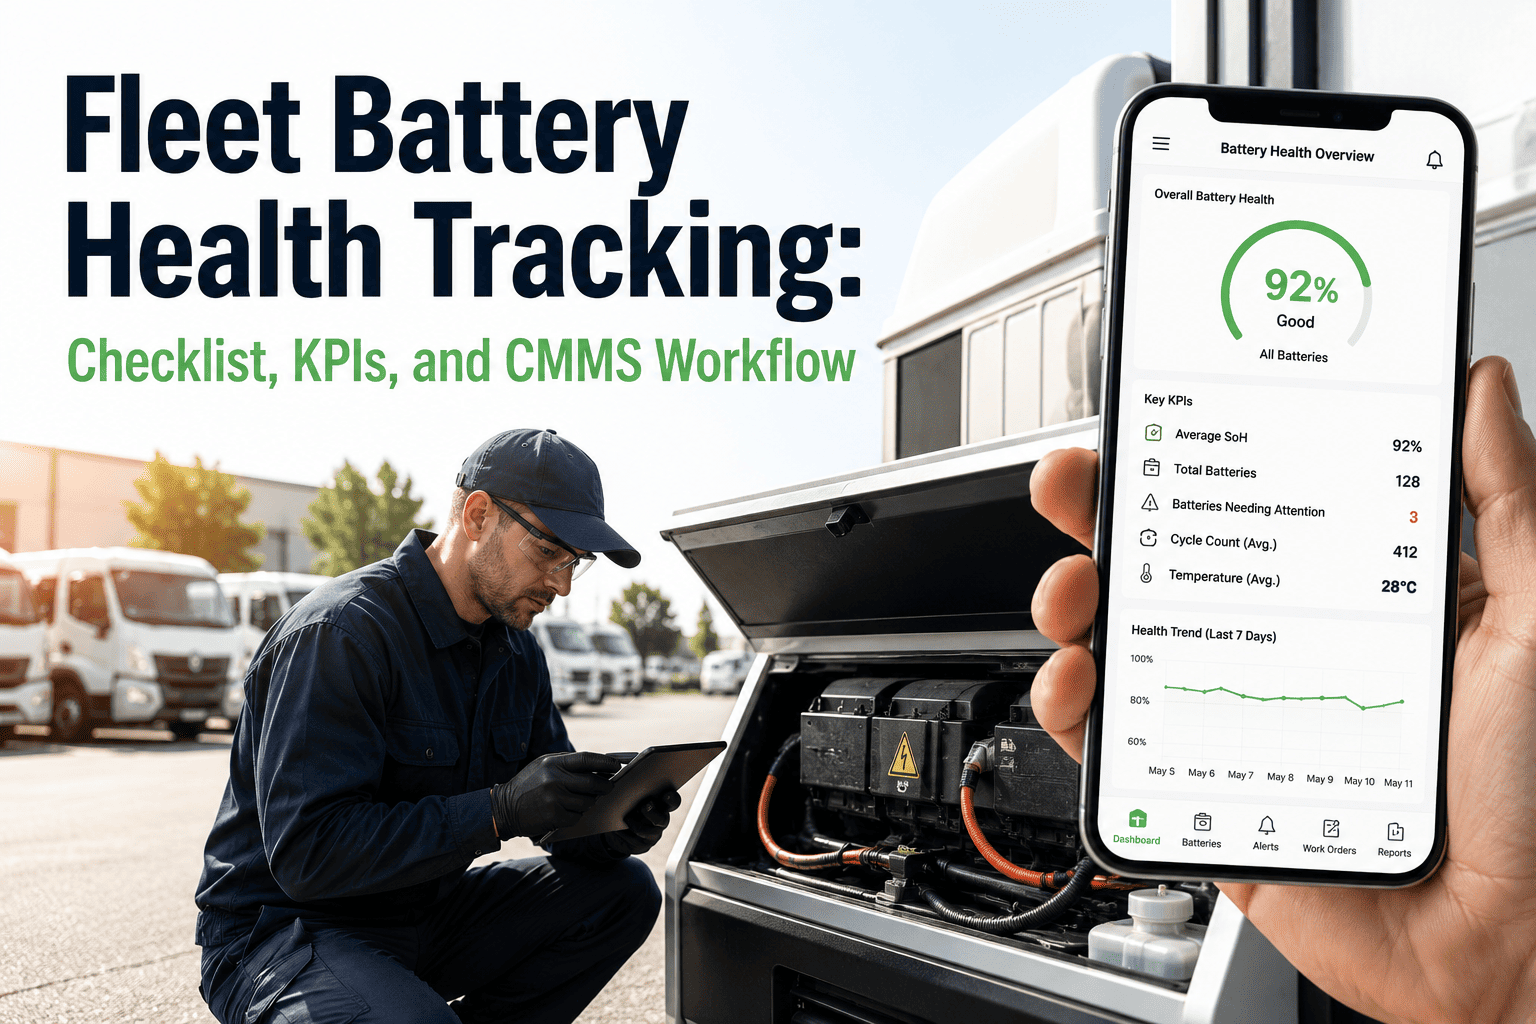
SOH, SOC, cycle count, and thermal events pulled automatically from your EV telematics — no more logging into a separate OEM app to find out a pack is degrading.
The Same Vehicle, Two Very Different Timelines
Monitored Fleet
Yr 0100%
Yr 5~90%
Yr 10~80%
SOC discipline, AC-first charging, and early alerts keep degradation on the well-managed curve
Unmonitored Fleet
Yr 0100%
Yr 3~90%
Yr 6~80%
Unchecked fast charging and heat exposure pull the same vehicle to the replacement threshold years earlier
Degradation Benchmarks by Fleet Vehicle Type
Degradation Rate Risk Tiers — What Each Range Means for Your Fleet
0–2% Annual
Healthy — On Track
This is the industry benchmark for a well-managed fleet EV. No action needed beyond continued SOC monitoring and the standard annual health check.
2–4% Annual
Investigate — Charging Pattern Review
Degradation is running ahead of benchmark. Charging history, thermal events, and SOC patterns for that vehicle get pulled for review before the trend accelerates further.
4%+ Annual
Immediate — Protocol Change Required
A pack losing capacity at this rate is heading toward premature replacement. Charging protocol needs an immediate change, and the vehicle's route assignment may need revisiting.
How OxMaint Turns Battery Telemetry Into Preventive Work
API Pull
SOH, SOC, cycle count, and thermal event data pulled automatically from EV telematics platforms — no manual export from the OEM portal
Trend Engine
Each vehicle's degradation curve tracked against its own history and against fleet-wide benchmarks by segment, so an outlier is caught early
Work Order
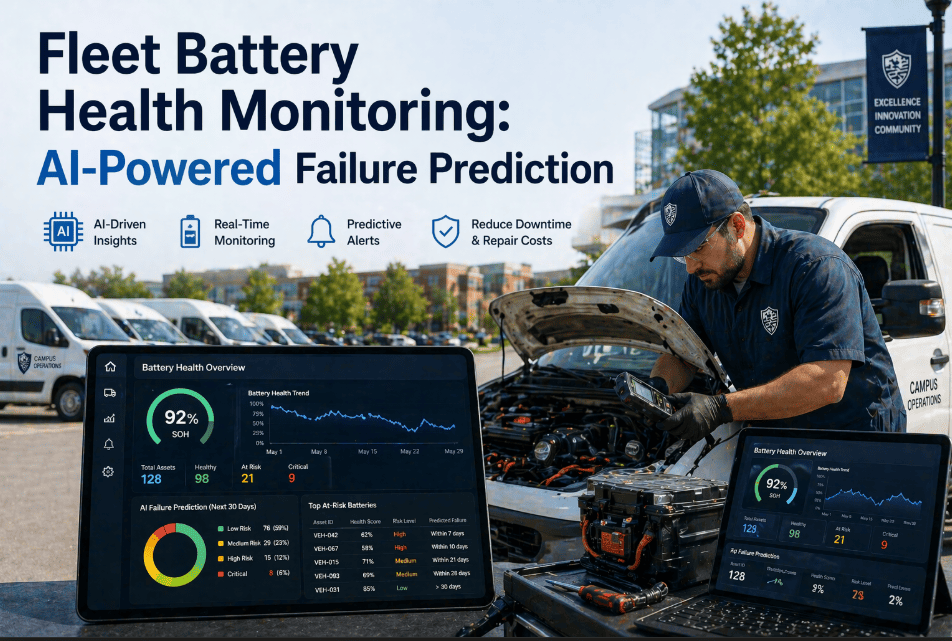
A degradation rate crossing into the investigate or immediate tier opens a work order automatically inside OxMaint, tagged with the underlying cause
4
signals tracked per vehicle — SOH, SOC, cycle count, and thermal events
80%
SOH threshold most fleets treat as effective end of service life
1.5%
resale value lost per 1% drop in state of health, on average
4 yrs
of service life gained by fleets that manage charging discipline proactively
Your OEM telematics portal already has this data. It just isn't in front of anyone until a driver reports lost range or a trade-in offer comes back lower than expected.
OxMaint turns that same data into an alert and a work order, automatically.
Frequently Asked Questions — EV Fleet Battery Health Monitoring
What counts as a healthy annual degradation rate for a fleet EV?
Roughly 0–2% capacity loss per year is the benchmark for a well-managed vehicle. Rates above 4% annually point to a charging or thermal issue that needs attention right away.
Sign in to OxMaint to see where each vehicle in your fleet currently sits.
Does OxMaint need special hardware installed on each EV?
No — SOH, SOC, cycle count, and thermal data are pulled directly from the EV telematics API that most fleet EVs already report to, so there is nothing new to install on the vehicle itself.
Why does state of charge matter as much as state of health?
SOC is the daily habit that drives how fast SOH falls. Keeping charge in a moderate daily range and limiting high-power fast charging measurably slows long-term degradation compared with charging to full every night.
How does battery health actually affect resale value?
Buyers and appraisers price used EVs against state of health almost as closely as odometer reading, since a lower SOH means less real-world range. A documented health history protects that value at trade-in or resale.
Can degradation trends be tracked across an entire mixed fleet?
Yes — every EV on the telematics platform is tracked against its own trend line and against benchmark ranges for its vehicle segment, so outliers stand out fleet-wide.
Book a demo to see it against your own fleet data.
The Battery Data Already Exists. It Just Isn't Working for You Yet.
OxMaint pulls SOH, SOC, cycle counts, and thermal events out of the OEM telematics portal and into a system that watches every vehicle every day — flagging degradation before it costs you a route or a resale dollar.