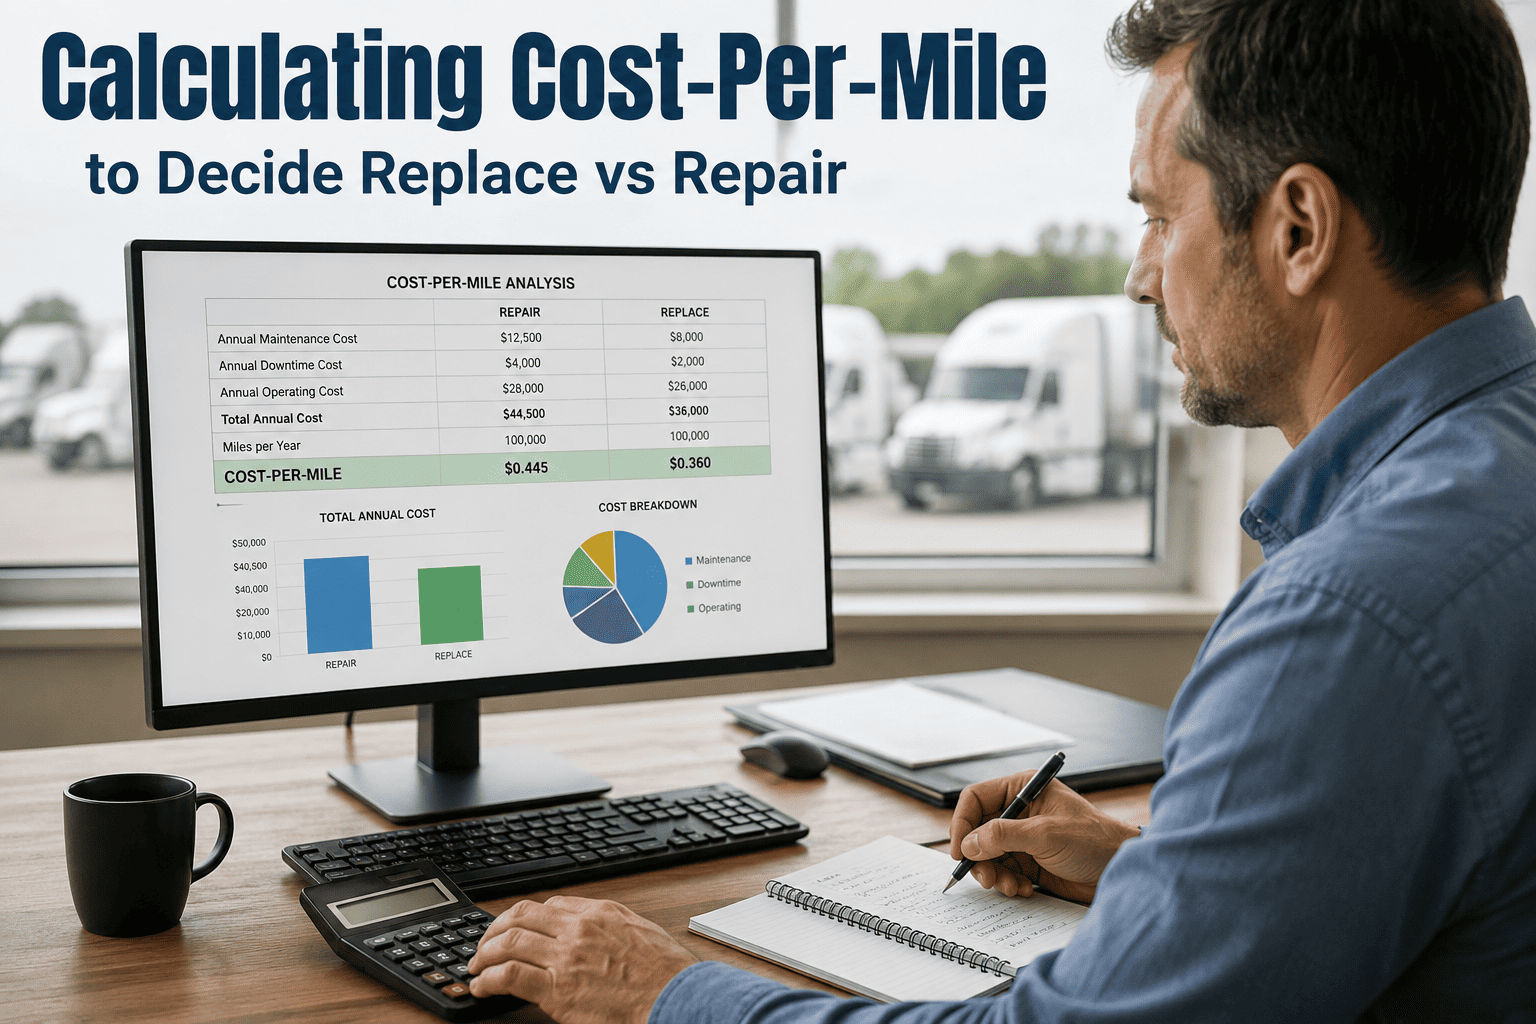
CapEx planning for fleet replacement is a rolling 24–36 month forecast, not an annual budget exercise — and the fleets that treat it that way are the ones caught short when OEM lead times stretch to 14 months. The math behind replacement timing is deceptively simple: a vehicle earns replacement when its trailing 12-month TCO per mile exceeds the projected TCO per mile of a new vehicle amortized over expected life. What makes it hard is the data collection — most fleets operate on fleet-wide averages that hide the specific vehicles already at replacement threshold. This guide walks through the two data streams, the threshold formula, the scheduling model that prevents CapEx concentration, and how Oxmaint rolls per-vehicle TCO into a 24-month forecast refreshed monthly. Start Free Trial to see your replacement candidates today.
When does a truck actually earn its replacement — and how far in advance must you order it?
Replacement timing is a per-vehicle math problem, not a fleet-average guess. Build a defensible 24-month CapEx forecast from TCO trends, threshold formulas, and OEM lead-time buffers — refreshed every month, not every fiscal year.
Every defensible replacement decision requires two parallel data streams
A rolling 24–36 month CapEx forecast is only as good as the data feeding it. Most fleets have fleet-wide averages; the fleets that get replacement right have per-vehicle confidence intervals on both sides of the equation.
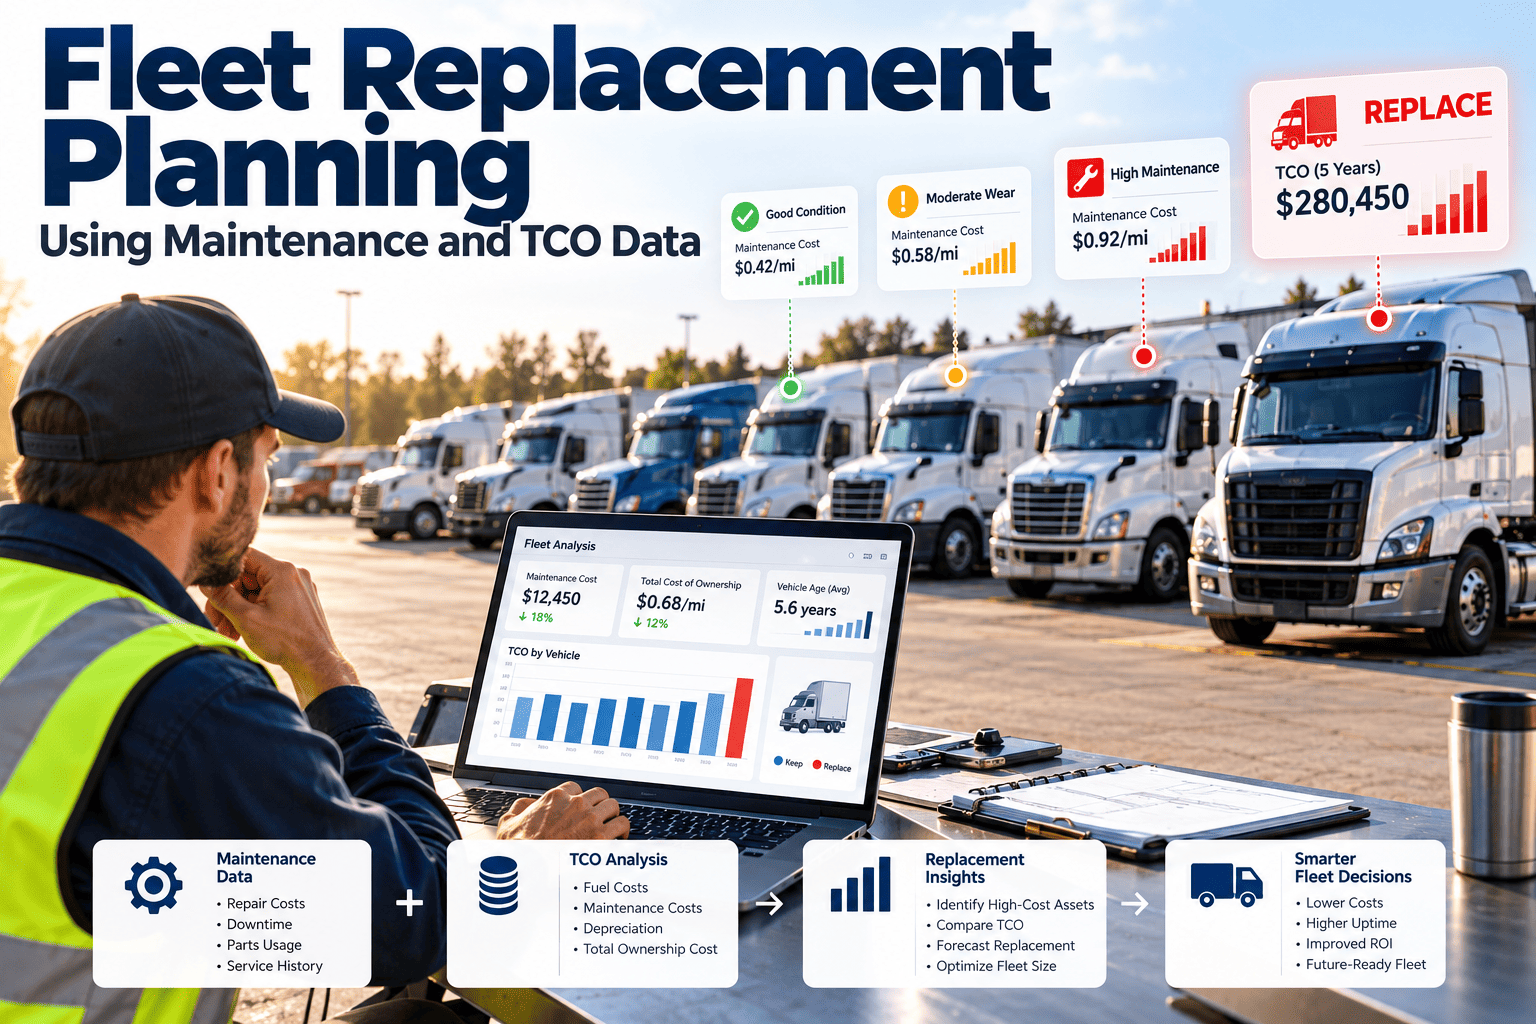
Pulled from a CMMS with lifecycle accounting — fuel, maintenance, downtime, insurance, depreciation — tracked at the VIN level, not the fleet level. The trend line matters as much as the absolute number: a truck at $0.38/mile trending up 8% quarterly is a stronger replacement candidate than one at $0.42/mile that has been flat for two years.
OEM spec sheet, configured price quote, expected resale value at the next replacement cycle, and a projected maintenance/fuel curve for the new asset. This is the denominator in the replacement equation — and it shifts every time OEM pricing, fuel economy standards, or resale markets move.
The formula that decides when a vehicle earns replacement
The math looks simple. The data collection is what makes it hard. Here is the threshold equation, broken into its four input variables.
Most fleets cannot run this formula with confidence because they have fleet-wide averages, not per-vehicle TCO with a defensible confidence interval. The vehicles actually at threshold are hidden inside the average — and they are the ones bleeding cash every extra month they stay in service.
A 200-truck fleet replacing 25 units per year — what the 36-month window looks like
Real numbers from a regional freight operator. Their TCO data, pulled from Oxmaint's CMMS, surfaced replacement candidates the fleet-wide average had masked for 18 months.
Fleet-wide average TCO of $0.46/mile looked healthy. Per-vehicle analysis revealed 31 tractors above $0.61/mile — 8 already past threshold, 23 within one trending quarter.
Order timing: why a truck hitting threshold in Q2 2026 must be ordered in Q3 2025
Replacement threshold tells you when a truck should leave the fleet. OEM lead times tell you when you must place the order. The gap between those two dates is where most CapEx plans fail.
Common sleeper tractors with standard axle and transmission specs. Order Q4 2025 for Q2–Q3 2026 delivery.
Specialized configurations — multi-axle, vocational, alternative fuel. Order the quarter before threshold is projected to hit.
Spread orders across quarters — never more than 8–10 in a single quarter — to avoid CapEx concentration and P&L shock.
| Financing Method | P&L Presentation | Balance Sheet | Replacement Decision? |
|---|---|---|---|
| Outright Purchase | Depreciation expense over useful life | Asset + liability (if financed) | No change — threshold math governs |
| Capital Lease | Depreciation + interest expense | Capitalized asset | No change — threshold math governs |
| Operating Lease | Monthly lease expense | Off-balance-sheet | No change — threshold math governs |
Financing decisions affect P&L presentation and balance sheet treatment, but they do not change the underlying replacement decision. The threshold formula is financing-agnostic — run it first, choose financing second.
Stop guessing. Start forecasting with per-vehicle TCO.
Oxmaint rolls your CMMS lifecycle data into a 24-month CapEx forecast with per-vehicle replacement recommendations — refreshed monthly, defensible at the board level.
Asset replacement and CapEx timing, answered
Why is fleet-wide average TCO dangerous for replacement decisions?
A fleet-wide average of $0.46/mile can hide 15–20% of vehicles running above $0.60/mile. Those outliers are your replacement candidates, and they are invisible in aggregate data. Per-vehicle TCO with confidence intervals is the only defensible basis for a CapEx forecast — it is also what auditors and CFOs ask for when the replacement budget is challenged.
How far in advance should I order a replacement Class 8 tractor?
For 2026 models, OEM lead times run 6–14 months depending on configuration. A truck projected to hit replacement threshold in Q2 2026 needs an order placed by Q3 2025 at the latest. Fleets that wait until the threshold is crossed are already 6–10 months late — meaning the aging asset continues bleeding maintenance and downtime costs while the replacement is in the build queue.
Does the financing method (purchase, capital lease, operating lease) change the replacement decision?
No. Financing affects P&L presentation and balance sheet treatment, but the replacement threshold formula is financing-agnostic. Run the TCO-per-mile comparison first, decide whether the vehicle earns replacement, then choose the financing structure that best fits your cash flow and tax position. See your candidates by starting a Start Free Trial — the forecast is financing-neutral.
What data do I need from my CMMS to build a defensible forecast?
You need per-vehicle lifecycle accounting: fuel, maintenance labor, parts, downtime cost, insurance, and depreciation — all tagged to the VIN, with a trailing 12-month trend. Without lifecycle accounting enabled in your CMMS, you are working with estimates, not data. Oxmaint's CMMS module includes lifecycle accounting by default and rolls it directly into the replacement forecast.
How often should the CapEx forecast be refreshed?
Monthly. TCO per mile shifts with every maintenance event, fuel price change, and downtime incident. A forecast refreshed annually is stale within 60 days. Oxmaint refreshes per-vehicle replacement recommendations every 30 days, so the 24-month CapEx view always reflects the latest TCO trend — and you can Book a Demo to see the refresh cadence on your own data.
Your 24-month CapEx forecast is already in your data.
Upload your CMMS lifecycle data and Oxmaint surfaces your replacement candidates, threshold crossings, and order deadlines — per vehicle, per quarter, defensible at the board level.
Free 14-day trial · No credit card