Fleet Vehicle Replacement Strategy: When to Repair vs Replace
By Alex Jordan on March 23, 2026
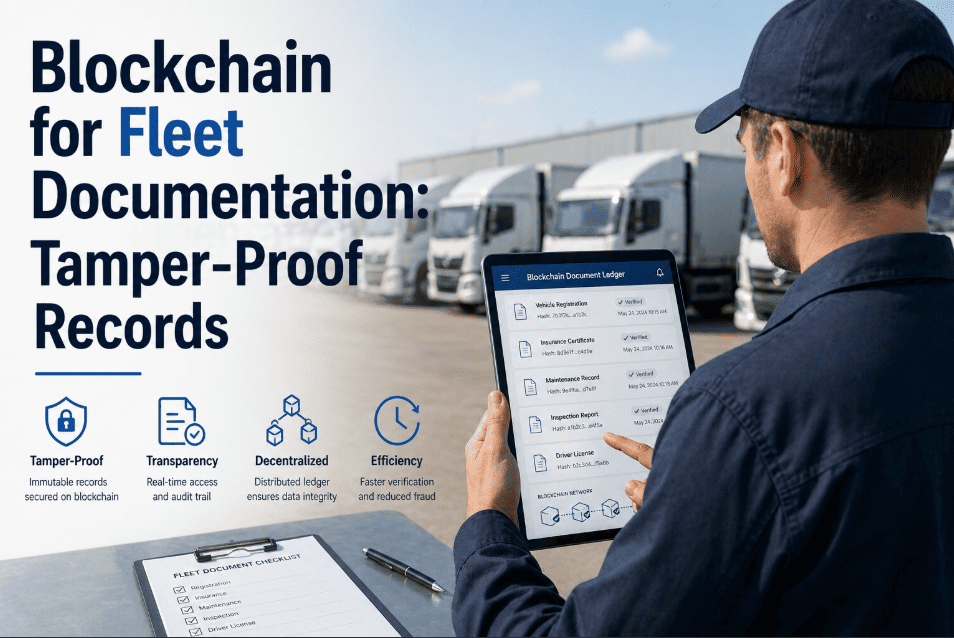
Fleet replacement decisions are among the most capital-intensive choices a fleet director makes — and most organizations make them on gut feel, age alone, or accumulated frustration with a specific vehicle. When TCO crossover analysis, CMMS maintenance cost trends, OBD condition data, and depreciation curves are combined into a single decision model, repair-vs-replace becomes a financial calculation with a defensible answer. OxMaint's CMMS builds the cost-per-vehicle record that feeds every replacement decision — tracking maintenance spend, downtime hours, and component condition per unit from day one.
Fleet Capital Strategy
Fleet Vehicle Replacement: When to Repair vs Replace
A data-driven framework for fleet replacement decisions — TCO crossover analysis, mileage and age benchmarks, AI digital twin lifecycle modelling, OBD condition triggers, SAP/PLC integration, and CMMS data that supports CapEx planning.
68%Of fleets replace on age alone — missing TCO signals
The TCO Crossover: The Critical Replacement Signal
TCO crossover analysis identifies the exact point when keeping a vehicle costs more annually than replacing it. Maintenance costs rise while depreciation falls — they cross at year 7–9 for most light commercial vehicles. CMMS maintenance data per vehicle is the only source of the actual numbers needed for this analysis — without it, fleet directors are estimating a financial decision that directly affects capital budgets of $200K–$2M annually.
Annual Ownership Cost by Vehicle Age — Light Commercial (Sample)
Vehicle Age
Maintenance / yr
Depreciation / yr
Total Annual Cost
Status
Year 1
$1,200
$12,800
$14,000
New asset
Year 3
$3,100
$8,200
$11,300
Declining fast
Year 5–7 ⭐
$5,800
$4,200
$10,000
Lowest TCO
Year 9
$9,400
$1,800
$11,200
Review now
Year 12+
$15,200
$600
$15,800
Replace
Crossover point: maintenance cost equals depreciation at year 7–9. After this, total annual cost rises faster than buying new.
Replacement Benchmarks by Vehicle Class
Replacement benchmarks vary significantly by vehicle class and operating duty. A fleet-wide age rule over-retires some assets and under-retires others. Class-specific thresholds — refined with the fleet's own CMMS cost-per-vehicle data — deliver the precision a blanket rule cannot.
Optimal Replacement Benchmarks by Vehicle Class
Vehicle Class
Optimal Age
Optimal Miles
Cost Trigger
Key Signal
Class 8 Tractor
5–7 years
500–700K mi
$0.22/mi
Engine overhaul economics
Class 6–7 Medium Duty
8–10 years
200–300K mi
$0.18/mi
Frame / body condition
Class 3–5 Light Comm.
6–8 years
150–200K mi
$0.15/mi
Drivetrain repair cost
Service / Pickup
7–9 years
120–160K mi
$0.12/mi
Safety system condition
Electric Vehicle
10–15 years
200–300K mi
SoH <75%
Battery degradation rate
AI Digital Twin: Predictive Lifecycle Modelling
AI digital twin technology creates a continuously updated virtual model of each vehicle — incorporating OBD sensor data, maintenance history, route profiles, and environmental factors to project future costs and residual value with far higher accuracy than static benchmarks. The digital twin answers the question a benchmark cannot: not "is this vehicle the right age to replace?" but "what will this specific vehicle cost to operate over the next 24 months?" Fleets report 18–25% improvement in replacement timing accuracy and $1,200–$3,400 per vehicle per year in avoided costs.
AI Digital Twin — What It Delivers for Replacement Planning
24-Month Cost Forecast
Projects maintenance spend per vehicle based on OBD wear trajectory and component age. Updated weekly. ±12% accuracy vs. actual cost.
±12% accuracy
Failure Probability Scoring
Scores each vehicle's 90-day breakdown probability. High-probability assets flagged for replacement before they generate emergency downtime.
Prevents $18K avg breakdown
Residual Value Tracking
Combines market depreciation curves with condition data to project resale value at 6, 12, and 24-month horizons — maximising disposal timing.
Avg 11% better disposal value
SAP CapEx Integration
3-year replacement schedule auto-populates SAP CapEx module with acquisition costs and disposal credits. Board-ready output, zero manual work.
$340K avg year-1 saving
OBD and AI Vision: Condition-Based Replacement Triggers
Age and mileage benchmarks are a starting point — condition data closes the gap. OBD-II and J1939 CAN bus data provides real-time engine health: fuel consumption deviation, transmission anomalies, and coolant patterns that correlate with impending overhaul costs. AI camera vision adds the structural layer: depot walk-around inspections detect frame stress fractures, corrosion, and body deformation invisible to a cursory visual check. When OBD signals and AI vision data converge on the same vehicle, the replacement case is made before the CMMS cost data is even consulted.
We were replacing trucks at 7 years flat because that's what we'd always done. OxMaint's cost-per-mile data showed three trucks that needed replacing at year 5 and four that were perfectly viable at year 10. We saved $340K in the first CapEx cycle just by looking at actual numbers instead of the calendar.
Fleet Director — National field services company, 86 vehicles, USA
Build Your Cost-Per-Vehicle Record Today
Every replacement decision is only as good as the data behind it. OxMaint builds the cost-per-vehicle trail automatically — free to start.
The Repair vs. Replace Decision: Three-Option Framework
Not every vehicle that hits a cost threshold should be replaced immediately. The three-option framework scores each vehicle on maintenance cost trajectory, downtime frequency, and structural condition simultaneously — producing a clear recommendation visible to finance, operations, and fleet management.
Repair / Monitor / Replace — Decision Criteria
✓ REPAIR
Repair cost <60% of annual maintenance
Below class mileage and age threshold
Fewer than 3 unplanned downtime events/yr
No structural or safety flags
⚠ MONITOR
Maintenance cost at 60–85% of threshold
Approaching mileage or age benchmark
3–6 downtime events per year
OBD signals trending upward
✕ REPLACE
Repair cost >85% of annual maintenance
Exceeds all class benchmarks
6+ unplanned downtime events per year
Structural / safety flags raised
SAP and PLC Integration: Connecting Decisions to Finance
Fleet replacement decisions that stay inside the fleet management system never get acted on. SAP S/4HANA integration enables the CMMS replacement flag to flow automatically into SAP's CapEx planning module — generating a capital appropriation request with cost data, disposal credit, and acquisition estimate pre-populated. PLC integration adds utilisation and load cycle data from fixed plant equipment to the digital twin lifecycle model, improving forecast accuracy for variable duty-cycle assets.
Integration Flow — From Vehicle Signal to Capital Approval
1
OBD + PLC Data
Real-time vehicle health and utilisation signals feed into CMMS condition record continuously
→
2
OxMaint CMMS
TCO analysis and digital twin forecast flags replacement candidates with full cost evidence
→
3
SAP S/4HANA
CapEx request auto-populated with maintenance data, disposal credit, and acquisition estimate
→
4
Approved & Actioned
Finance approves, procurement triggered, disposal listed — full cycle documented
$340K
Avg CapEx saving per 50-vehicle fleet in year-1 replacement optimisation
From retiring early-threshold vehicles and retaining late-threshold ones instead of a uniform age rule.
18–25%
Improvement in timing accuracy with AI digital twin vs. benchmarks alone
Per-vehicle cost projections based on actual wear trajectory, not class-average assumptions.
34%
Cost rise when vehicles are kept 2+ years past TCO crossover
Maintenance cost rises faster than depreciation falls — compounding annually after crossover.
11%
Better disposal value when residual value forecasting drives timing
Selling at 72 months vs. 84 months recovers $2,400–$5,800 more per light commercial vehicle.
Frequently Asked Questions
What is the most reliable single trigger for a replacement decision?
Maintenance cost-per-mile exceeding the class threshold is the most reliable single trigger — it reflects actual performance, not age assumptions. Cross-reference with downtime frequency and OBD fuel consumption deviation for a complete picture. OxMaint calculates cost-per-mile automatically from your work order data.
How does OxMaint support CapEx planning for vehicle replacement?
OxMaint tracks maintenance cost, downtime, and component condition per vehicle — producing the cost-per-mile and total ownership cost data for replacement justification. The replacement candidate report exports directly to SAP or Excel. Book a demo to see the CapEx report format.
Is mileage or age the better replacement benchmark?
Neither alone. Use both as secondary triggers and maintenance cost-per-mile as primary. A low-mileage vehicle with high repair frequency may need replacing before a high-mileage well-maintained unit. Age matters for safety systems; mileage for drivetrain wear; cost for financial decisions.
How does AI digital twin improve on standard TCO analysis?
Standard TCO uses class averages. A digital twin uses this vehicle's actual OBD wear trajectory, maintenance history, and route profile — per vehicle, not per class. Two identical vehicles on different duties age at completely different rates; the twin captures this precision. Start building your vehicle cost records free today.
Stop Replacing on Gut Feel. Start Replacing on Data.
OxMaint builds the cost-per-vehicle record that makes every repair-vs-replace decision defensible — to operations, to finance, and to the board.