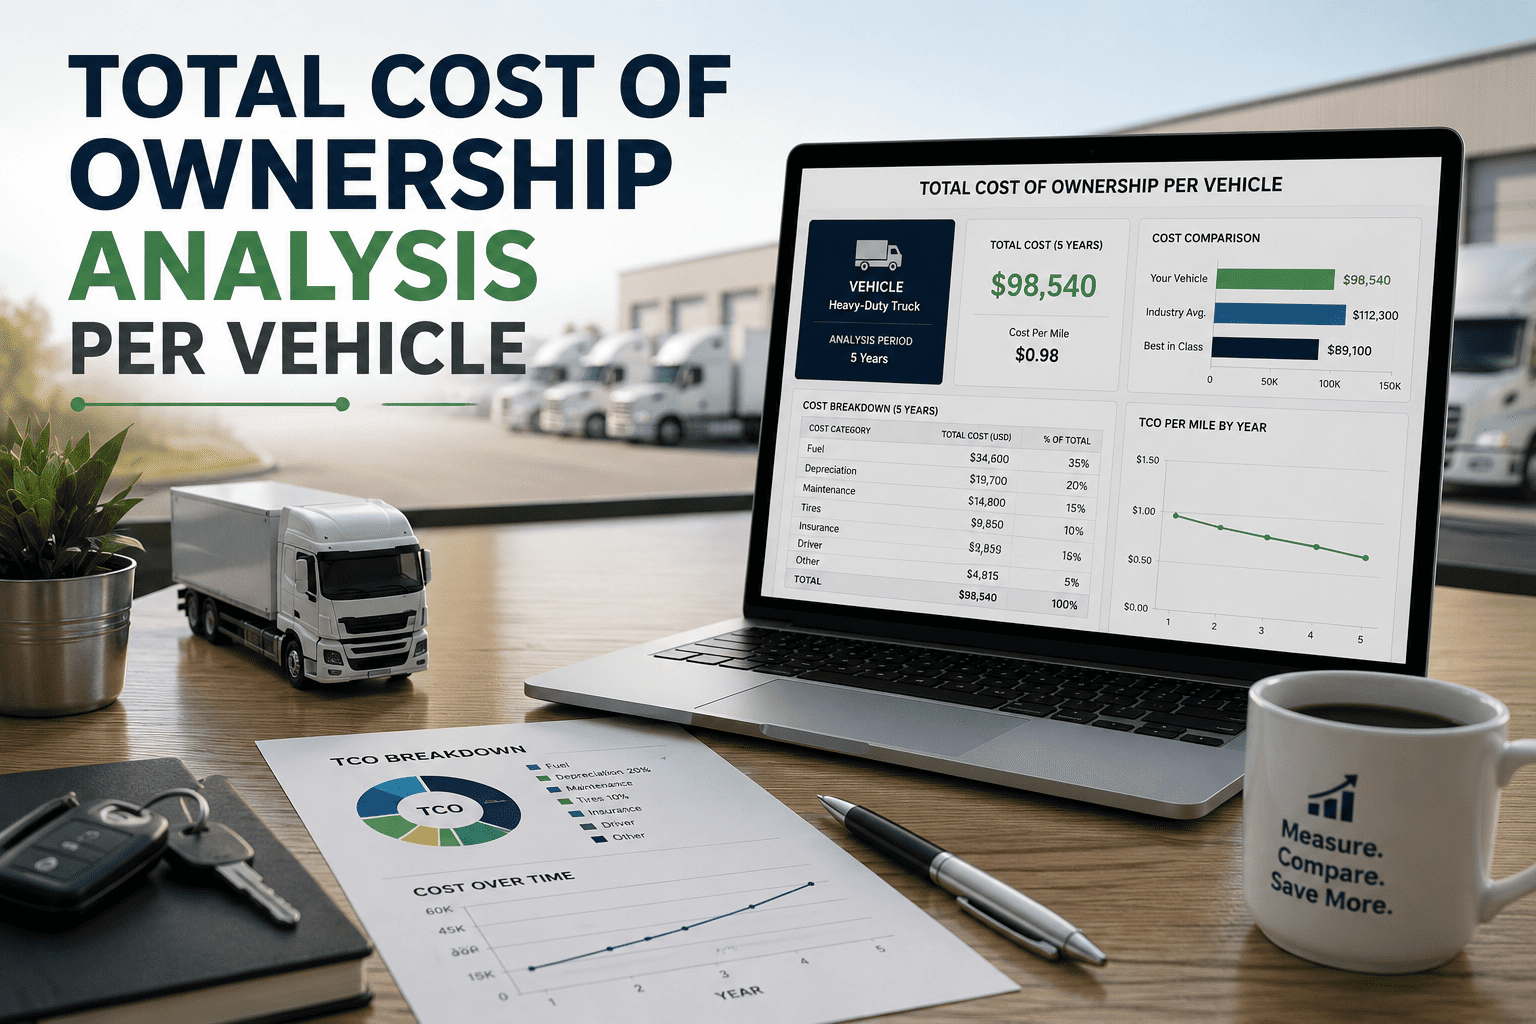
The EV vs diesel fleet debate in 2026 is no longer theoretical — it is a spreadsheet exercise with real numbers that fleet CFOs can validate against their own operating data. The purchase price gap between electric and diesel commercial vehicles has narrowed to 15-25% for most light and medium-duty classes, while the operating cost advantage of electric drivetrains has widened as diesel prices stabilize above $3.70 per gallon and EV maintenance costs prove out at 40-60% below their combustion equivalents over the first 150,000 miles. The total cost of ownership crossover — the point where cumulative EV savings exceed the purchase price premium — now occurs between month 28 and month 42 for most commercial fleet applications, down from 60+ months just three years ago. But the TCO calculation is only useful when it captures all variables: federal incentives that reduce net purchase price by $7,500-$40,000 per vehicle, charging infrastructure costs that diesel fleets do not face, residual value trajectories that are diverging rapidly between powertrains, and the maintenance cost differential that compounds with every mile driven. Fleet operators using asset management platforms like OxMaint to track actual maintenance costs by powertrain type are producing the real-world TCO data that turns the EV business case from a projection into documented evidence. Want to model your fleet's specific TCO comparison with real maintenance data, start a free trial or book a demo to see OxMaint's fleet cost attribution engine.
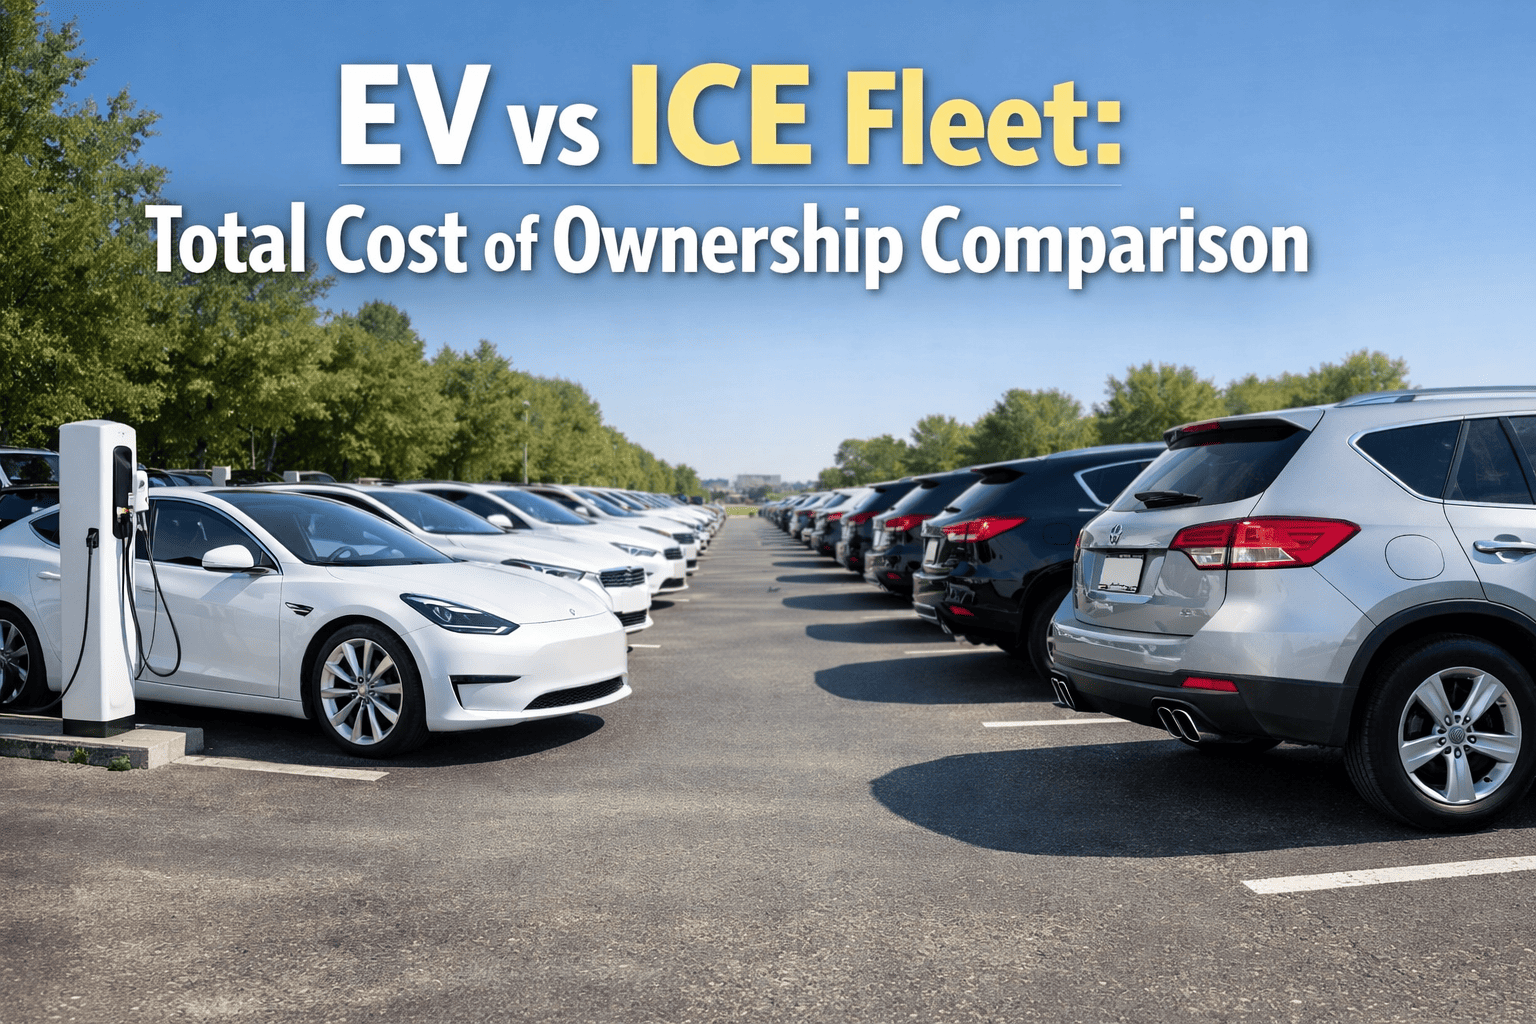
EV vs Diesel Fleet: Total Cost of Ownership 2026
A side-by-side TCO analysis comparing electric and diesel commercial fleets across purchase price, fuel and energy costs, maintenance expenses, federal incentives, depreciation, and the financial crossover point where EV cumulative savings exceed the purchase premium.
The 7 Cost Categories That Define Fleet TCO
Total cost of ownership is not a single number — it is the sum of seven distinct cost categories that behave differently for EV and diesel powertrains. Missing any one category produces a TCO comparison that looks convincing but leads to wrong decisions. The comparison that follows models each category independently so fleet managers can adjust inputs for their specific operating context and produce a TCO that reflects their actual fleet, not industry averages.
Side-by-Side TCO Comparison: 10-Vehicle Fleet Over 7 Years
This model compares a 10-vehicle Class 3-5 commercial fleet operating 25,000 miles per year per vehicle over a 7-year ownership cycle — the standard fleet replacement cadence for medium-duty commercial vehicles. All figures are per-vehicle averages at 2026 US market pricing.
| Cost Category | Diesel Fleet (Per Vehicle) | EV Fleet (Per Vehicle) | EV Advantage |
|---|---|---|---|
| Vehicle Purchase Price | $52,000 | $68,000 | Diesel: -$16,000 lower upfront |
| Federal Incentives Applied | $0 | -$7,500 to -$40,000 | EV: up to $40,000 reduction |
| Net Acquisition Cost | $52,000 | $28,000-$60,500 | EV: up to $24,000 lower net cost |
| Fuel / Energy Cost (7-Year Total) | $38,500 ($0.22/mi) | $7,000 ($0.04/mi) | EV: $31,500 savings |
| Maintenance Cost (7-Year Total) | $24,500 ($0.14/mi) | $11,200 ($0.064/mi) | EV: $13,300 savings |
| Charging Infrastructure (Amortized Per Vehicle) | $0 | $4,200 | Diesel: no infra cost |
| Insurance (7-Year Total) | $14,700 | $16,800 | Diesel: $2,100 lower |
| Residual Value at Year 7 | $8,300 (16% of purchase) | $15,600 (23% of purchase) | EV: $7,300 higher residual |
| 7-Year Total Cost of Ownership | $121,400 | $51,600-$83,100 | EV: $38,300-$69,800 savings |
Note: EV acquisition cost range reflects the variation in available federal and state incentives by vehicle class and jurisdiction. The lower end ($28,000 net) applies to heavy-duty vehicles in states with stacking incentive programs (California HVIP + federal). The higher end ($60,500 net) applies to light-duty vehicles in states with no state-level EV incentive. All maintenance figures assume structured preventive maintenance programs — reactive maintenance ratios above 30% increase diesel maintenance costs by an additional 25-40%.
Category Deep Dive: Where the TCO Advantage Comes From
Understanding which cost categories drive the EV advantage — and which still favor diesel — is essential for building a fleet electrification business case that survives CFO scrutiny. Each category below includes the 2026 pricing inputs, the cost per mile calculation, and the sensitivity factors that can shift the comparison in either direction.
At $3.85/gallon diesel and 17.5 MPG (Class 3-5 average), diesel costs $0.22 per mile. At $0.12/kWh managed off-peak electricity and 0.35 kWh/mile, EV costs $0.04 per mile. The 82% energy cost reduction is the single largest contributor to EV TCO advantage and the least sensitive to assumption changes — even at $0.18/kWh peak electricity, EV energy cost is $0.063/mile, still 71% below diesel.
Diesel drivetrains require oil changes every 7,500 miles, fuel filter replacement, DEF system maintenance, turbo service, exhaust aftertreatment, and transmission fluid changes — none of which apply to EVs. EV maintenance is dominated by tire rotation, brake service (reduced by regenerative braking), cabin air filter, and coolant service. OxMaint fleet operators tracking both powertrain types document 40-60% lower maintenance cost per mile for EVs consistently across the first 150,000 miles.
The EV purchase premium for Class 3-5 commercial vehicles ranges from 15-35% above diesel equivalents in 2026. Federal incentives — $7,500 for qualifying light-duty vehicles under IRA Section 30D, up to $40,000 for qualifying heavy-duty vehicles under IRA Section 45W — can reduce or eliminate the purchase premium entirely. State incentives in California, Colorado, New York, and 18 other states stack on top of federal, with California HVIP providing $95,000-$150,000 per qualifying heavy-duty EV.
Commercial EV residual values in 2026 are stabilizing above diesel equivalents for the first time — driven by regulatory tailwinds that increase future demand for used EVs, battery warranty transferability, and lower mechanical wear that preserves vehicle condition. Diesel residual values are declining as fleet electrification mandates in California, New York, and the EU reduce secondary market demand for combustion commercial vehicles beyond 2030.
Maintenance Cost Deep Dive: Why EVs Cost 40-60% Less to Maintain
The maintenance cost advantage is the most underestimated factor in fleet TCO comparisons — and it compounds with every mile driven. The structural reason is simple: electric drivetrains have 80-90% fewer moving parts than diesel drivetrains. No engine oil, no oil filter, no fuel filter, no timing belt, no spark plugs, no transmission fluid, no exhaust aftertreatment system, no turbocharger, and no DEF system. What remains is tire service, brake inspection (greatly reduced by regenerative braking), cabin filtration, coolant service, and battery thermal system maintenance. OxMaint fleet operators who track maintenance cost by powertrain type produce the documented evidence that validates — or adjusts — these industry-average figures for their specific fleet composition and operating conditions. Explore how OxMaint tracks maintenance cost per mile by vehicle and powertrain type — start a free trial or book a demo.
The TCO Crossover Timeline: When EV Savings Exceed the Purchase Premium
The crossover point — where cumulative EV operating savings equal or exceed the net purchase price premium — depends on daily mileage, incentive capture, and local energy and fuel prices. This breakdown shows crossover timelines for different fleet operation profiles.
Urban delivery, courier, and logistics fleets running high daily mileage accumulate fuel and maintenance savings fastest. These fleets reach TCO crossover before the end of Year 3 even without state-level incentives — and within 18-22 months when full incentive stacks are captured.
The most common fleet operating profile for Class 3-5 commercial vehicles. Crossover occurs in the Year 3-4 window for most fleets. Incentive capture is the primary variable — a $7,500 federal credit produces a 42-month crossover while a $40,000 heavy-duty credit produces a 28-month crossover on the same fleet.
Facility maintenance vehicles, campus shuttles, and low-utilization support fleets. Lower annual mileage delays the fuel savings accumulation that drives crossover. These fleets benefit most from aggressive incentive capture and should prioritize state and utility programs that reduce the purchase premium rather than relying solely on operating savings.
In several states — California, Colorado, New York — the combined incentive stack eliminates the purchase premium entirely and produces a net acquisition cost below the diesel equivalent. In these cases, every operating dollar saved from day one of deployment is pure TCO advantage. A California fleet purchasing a qualifying Class 7 EV can receive $190,000+ in combined incentives.
How OxMaint Documents Real-World Fleet TCO Data
Industry averages tell you what fleets in general experience. OxMaint tells you what your fleet specifically is spending — by vehicle, by powertrain type, by maintenance category, and by time period. This is the data that turns a TCO projection into a documented business case for fleet electrification decisions. Book a demo or start a free trial to begin capturing your fleet maintenance cost data by powertrain type.
Every work order cost — labor, parts, contractor — is attributed to the specific vehicle. OxMaint calculates maintenance cost per mile for each vehicle and aggregates by powertrain type, providing the side-by-side EV vs diesel maintenance cost comparison using your actual fleet data rather than industry assumptions.
Separate PM templates for EV and diesel vehicles ensure that each powertrain receives the maintenance it actually requires — eliminating both over-maintenance of EVs (applying diesel PM tasks to electric drivetrains) and under-maintenance of EV-specific systems like battery coolant and thermal management that diesel PM schedules do not cover.
OxMaint tracks total cost of ownership per vehicle from acquisition through disposal — capturing every maintenance dollar, every downtime event, and every repair decision. When the fleet replacement cycle arrives, the TCO comparison between your EV and diesel vehicles is documented evidence, not a projection — enabling data-driven procurement decisions for the next fleet generation.
Charging infrastructure maintenance costs are tracked alongside vehicle maintenance in OxMaint — providing the complete fleet electrification TCO picture that includes infrastructure operating costs, charger PM compliance, and the amortized infrastructure investment per vehicle. This captures the full cost that diesel-only fleet comparisons ignore.
Frequently Asked Questions
How reliable are these TCO projections given that EV technology is still evolving?
What about EV battery replacement cost — does the TCO include that risk?
Does this comparison account for the time value of money on the higher EV upfront cost?
Our fleet operates in a cold climate — does that change the TCO calculation?
Stop Projecting Your Fleet TCO — Start Documenting It
Every TCO comparison is only as credible as the data behind it. OxMaint gives fleet operators the maintenance cost tracking, powertrain-specific PM scheduling, and asset lifecycle documentation to produce real-world TCO data from their own fleet operations — not industry averages from someone else's vehicles. Whether you are building the business case for your first EV purchase or documenting the savings from an existing mixed fleet, the TCO evidence starts with accurate, vehicle-level cost attribution. Start capturing it today.