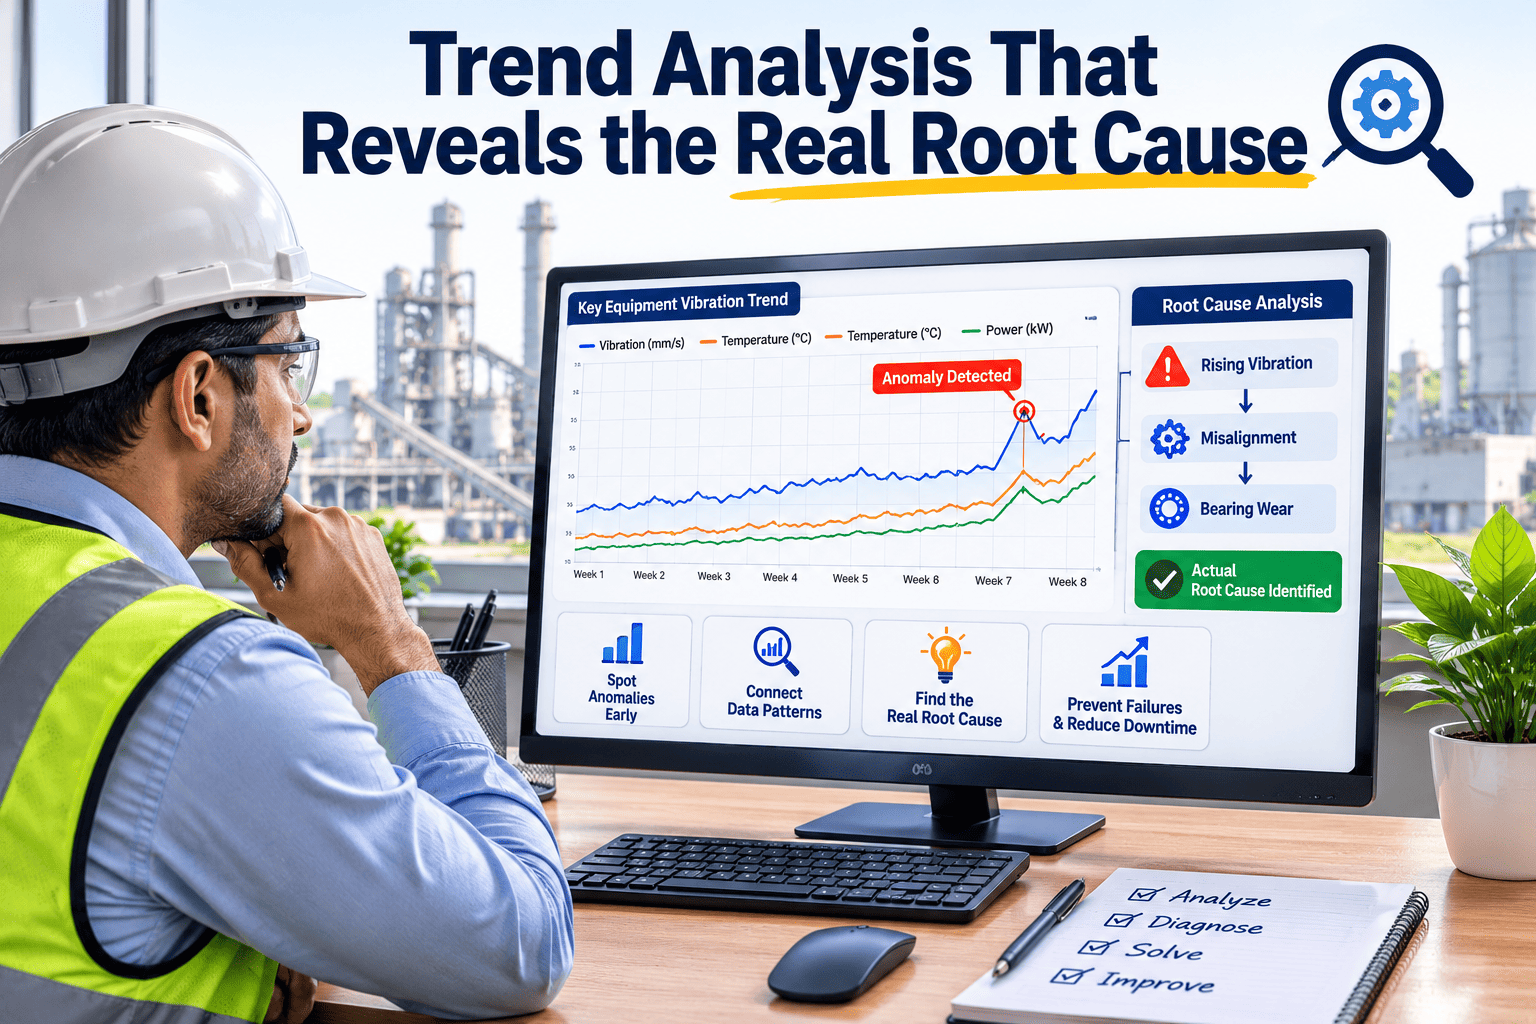
Most fleets log 10–15 crashes a year and investigate each one in isolation, which is exactly why the same accidents keep happening quarter after quarter. Incident trend analysis flips that approach by aggregating breakdown, accident, and violation data across 12–24 months so the systemic patterns — a handful of drivers, one or two problem corridors, the 9th hour of a shift — finally become visible. This guide walks through the five cluster types that surface in nearly every dataset, the 5-why root cause tagging method that categorizes them, and the dashboards that turn raw incident logs into a defensible safety program. Ready to stop reacting and start pattern-matching? Start Free Trial and your first trend dashboard builds itself from the incidents you already record.
12 crashes a year. Zero pattern detected.
Treat every incident as independent and you will keep having the same one. Aggregate 12–24 months of breakdown, accident, and violation data and the real root cause stops hiding — usually concentrated in three or four predictable clusters.
Single-incident review is reactive by design
A 220-truck regional fleet recorded 12 reportable crashes in 12 months. Each was investigated, file closed, driver coached or cleared. The next year produced 13 crashes. Same corridors, same shift window, same three drivers — invisible, because no one ever aggregated the files.
The cost of that blindness compounds. At an average preventable crash cost of $74,000 — covering vehicle damage, cargo, downtime, claims handling, and potential litigation reserve — 12 incidents represent roughly $888K in annual exposure. When 60–80% of that traces to three or four addressable root causes, the gap between reacting and pattern-matching is the gap between a flat safety record and a 30–50% reduction in incident frequency inside 12 months.
Where fleet incidents actually hide
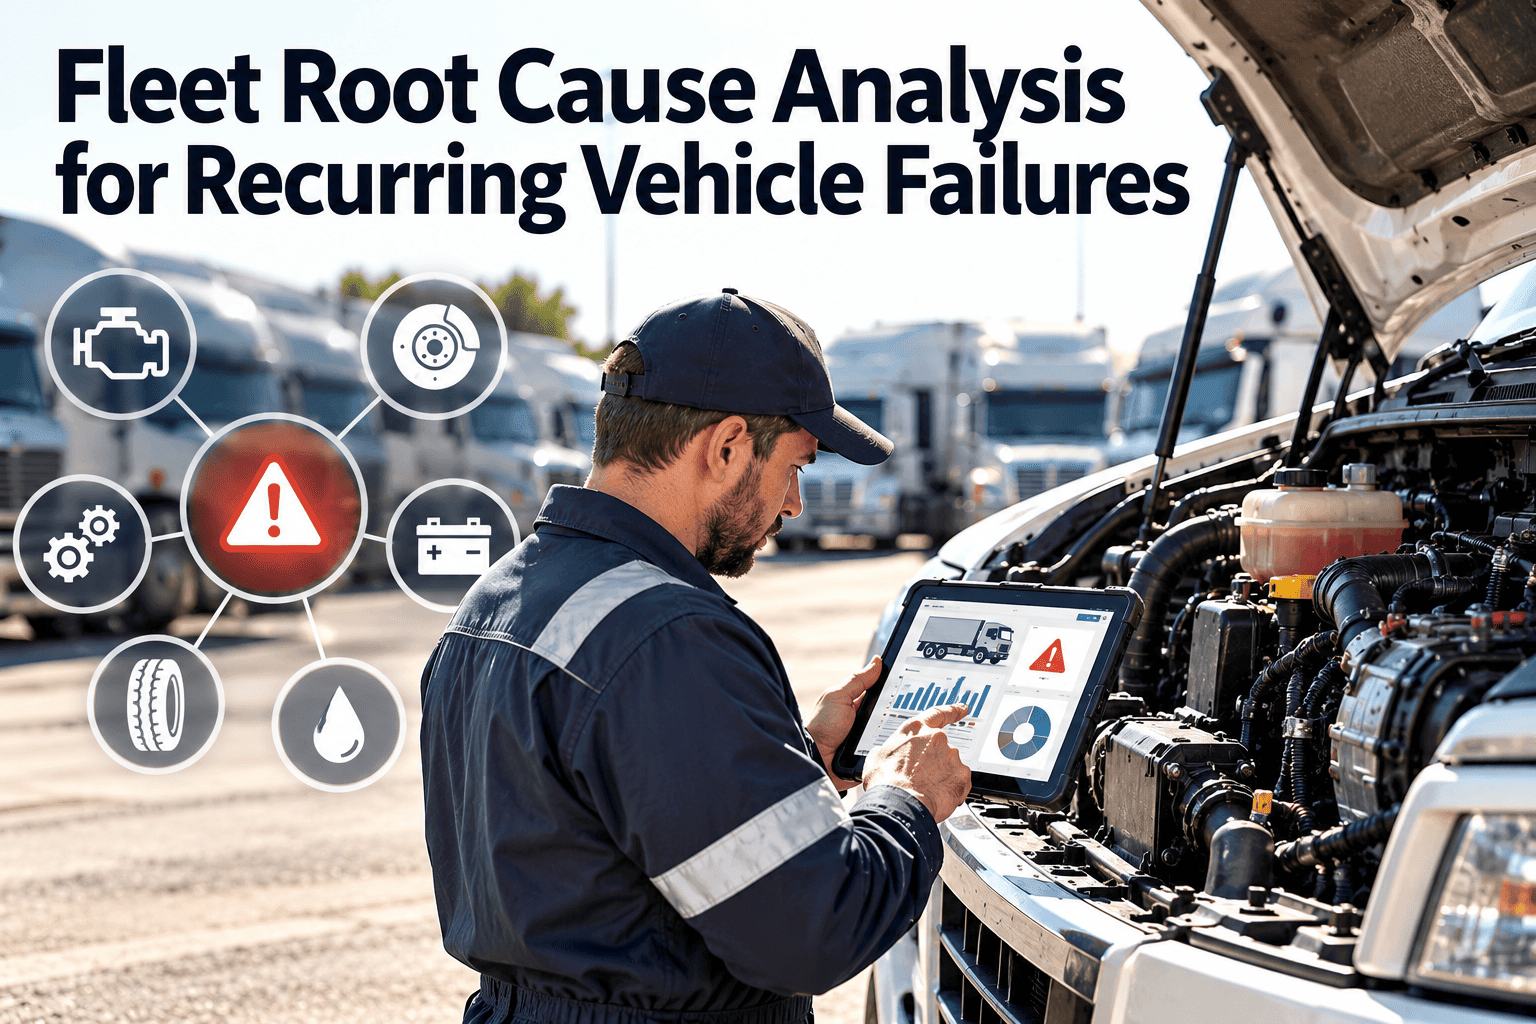
Proper trend analysis groups incidents across five dimensions. Run your last 12 months through each one and at least two clusters will light up immediately.
Driver Cluster
A small subset of drivers — typically 10–15% of the roster — generates 60–70% of preventable incidents. Targeted coaching, ride-alongs, or performance management beats fleet-wide training, which dilutes attention and budget across drivers who do not need it.
Route Cluster
Specific corridors, intersections, or delivery zones produce repeat incidents — often a blind merge, a poorly signed yard entrance, or a customer dock with insufficient turning radius. Fix it with route change, dispatcher briefing, or infrastructure escalation to the property owner.
Time-of-Day Cluster
Incidents concentrate in hours 8–10 of a shift when fatigue peaks, and again between 2:00–5:00 AM during the circadian low. A 24-month trend will show the spike clearly and point to HOS scheduling review, split-shift redesign, or mandatory 30-minute breaks before the danger window.
Vehicle Cluster
A specific tractor, trailer, or vehicle class appears disproportionately — often a blind-spot geometry issue, a cab comfort problem (seat, mirrors, climate) eroding driver focus, or a recurring mechanical fault. A vehicle-cluster flag should trigger a mechanical review and a driver-comfort survey within the week.
Weather Cluster
Incidents cluster on the first frost, the first heavy rain after a dry spell, and the first snow of the season — not the worst weather day. Drivers recalibrate over 2–3 events; the first one is where the risk lives. Seasonal micro-training deployed 48 hours before forecast onset cuts these incidents sharply.
5-Why tagging turns incidents into categories
Every incident gets a 5-why drill-down that terminates in a categorized root cause tag. Those tags are what make aggregation possible — without them you have 200 narratives and zero comparable fields.
Record the event with 25+ categorization dimensions — driver, vehicle, route, hour, weather, load, road type, lighting, fatigue index, and more. Oxmaint captures these fields at intake so nothing is reconstructed from memory weeks later.
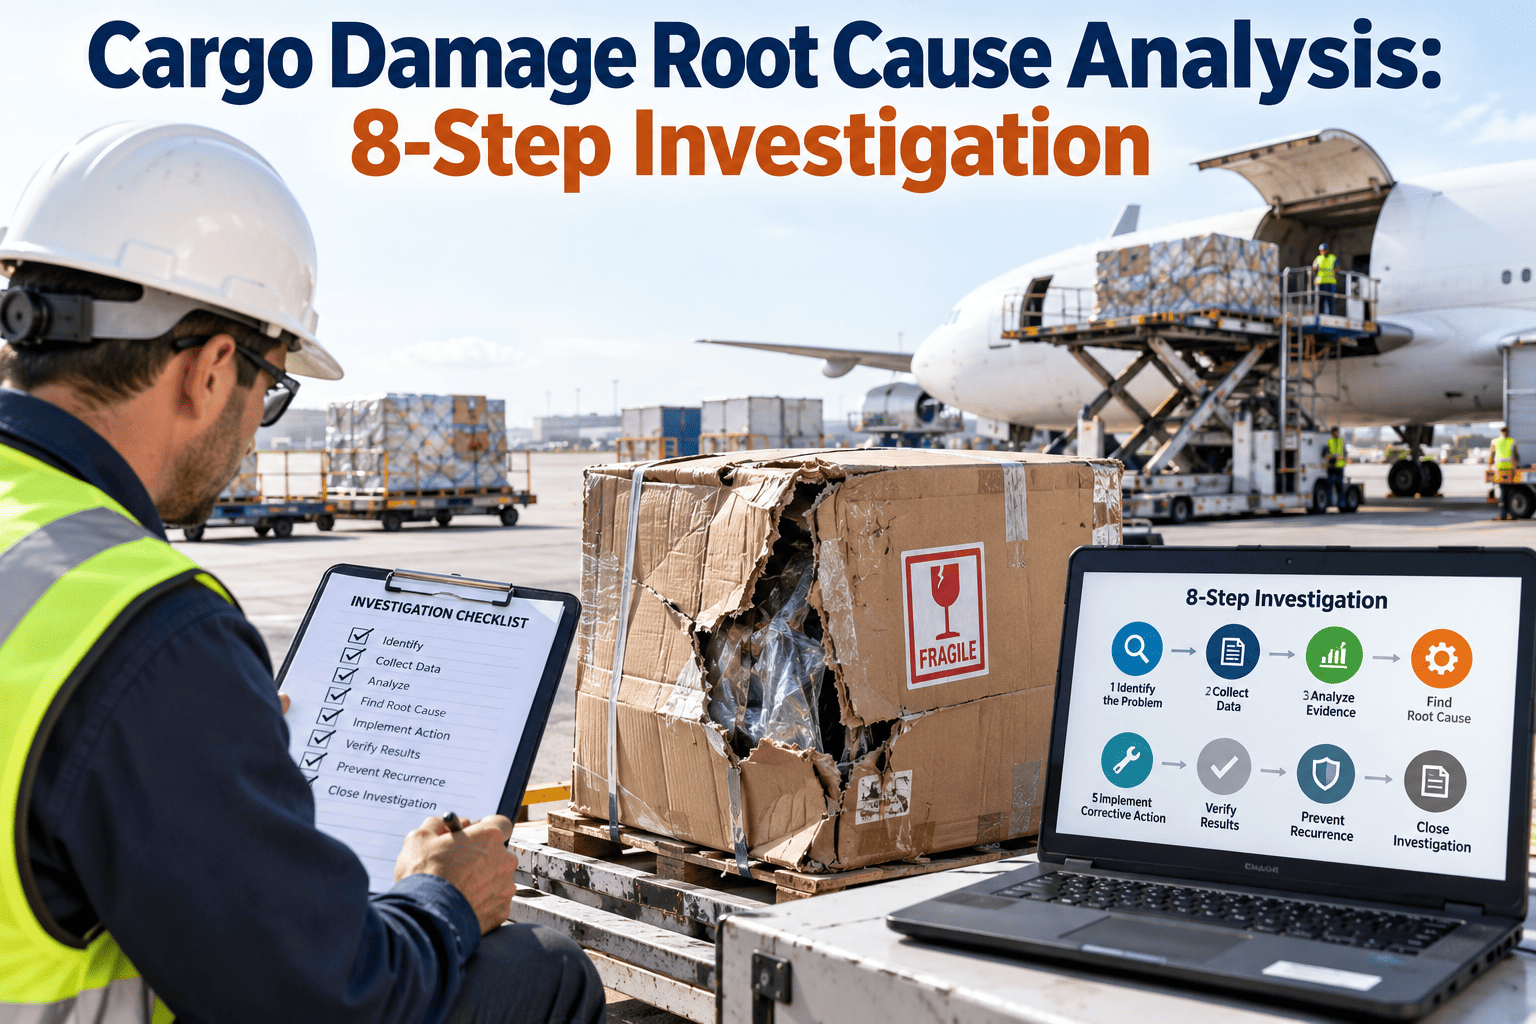
Ask "why" five times. Why did the truck strike the dock post? Because the driver misjudged the turn. Why? Because the mirror did not show the post. Why? Because the mirror was angled for a different driver. Why? Because no pre-trip mirror check. Why? Because the checklist skips mirror verification. Root cause: checklist gap.
Map the terminal why to a standardized category — Procedure Gap, Driver Skill, Fatigue, Mechanical, Infrastructure, Weather, Scheduling. Consistent tags are what let you aggregate across hundreds of incidents without re-reading each narrative.
Over 12–24 months the top 3 root cause categories consistently account for 60–80% of total incidents. Rank the list, estimate cost per category, and prioritize the safety program around the top three — not the loudest single event.
A 180-truck fleet, 18 months, one pattern
A regional dry-van fleet ran 5-why tagging on 41 incidents over 18 months. Three root cause categories accounted for 72% of all events — and 78% of total incident cost.
| Root Cause Category | Incidents | Share of Total | Avg Cost / Incident | Annualized Cost |
|---|---|---|---|---|
| Fatigue (hours 8–10 of shift) | 13 | 32% | $82,000 | $710K |
| Route — two problem intersections | 9 | 22% | $68,000 | $408K |
| Driver Skill — 4 drivers | 7 | 18% | $54,000 | $252K |
| Mechanical — brake adjustment | 5 | 12% | $61,000 | $203K |
| Weather — first-frost events | 4 | 10% | $47,000 | $125K |
| Other / uncategorized | 3 | 6% | $52,000 | $87K |
The fleet addressed the top three — mandatory 30-minute break before hour 8, rerouted both intersections with dispatcher briefing, and enrolled the four flagged drivers in a targeted coaching cycle. Incident frequency dropped 38% in the following 12 months, cutting annualized crash cost from $1.79M to roughly $1.11M. The intervention cost — coaching hours, route redesign, break scheduling software — was under $95K, a payback period of approximately seven weeks.
From data to targeted intervention
The point of trend analysis is not the dashboard — it is the safety program you build from it. Each top-three category maps to a specific, measurable intervention.
Redesign the break schedule
Insert a mandatory 30-minute break before hour 8 of every shift. Pair with HOS scheduling review so no driver starts a 11-hour run at 4:00 PM — the window that puts hours 8–10 in the 12:00–2:00 AM circadian low. Expect a 20–30% drop in fatigue-tagged incidents within two quarters.
Reroute and escalate
Reassign the problem corridor to a different gate or time slot, brief dispatch on the specific hazard, and escalate infrastructure issues (signage, sightlines, dock geometry) to the property owner in writing. Track the rerouted corridor for 90 days to confirm the cluster dissolves.
Coach the flagged few
Pull the 10–15% of drivers generating the cluster into a targeted coaching cycle — ride-along, simulator session, or remedial training on the specific skill gap (backing, mirror use, following distance). Skip fleet-wide training; it wastes the budget on drivers who are already performing.
Deploy seasonal micro-training
Push a 5-minute micro-module on wet-road or cold-weather technique 48 hours before the first forecast frost or heavy rain. Drivers recalibrate after 2–3 events; the first one is where you intervene. Cost per module is trivial; the prevented first-frost incidents are not.
Stop investigating incidents one at a time
Oxmaint captures 25+ categorization dimensions on every incident and surfaces clusters automatically — driver, route, time, vehicle, weather — so your top three root causes are visible the moment you have enough data to trust them.
Trend analysis, root cause tagging, and the data behind it
How many months of incident data do I need before trend analysis is reliable?
A minimum of 12 months gives you one full seasonal cycle and enough volume for patterns to surface statistically. 18–24 months is ideal — it smooths out one-off anomalies (a freak storm, a single bad hire) and lets the top-three root cause categories stabilize at the 60–80% concentration level. Below 6 months the clusters are noisy and you risk building a safety program around a fluke.
What is the 5-why method and why does it matter for aggregation?
5-why is a sequential root cause drill: ask "why did this happen?" five times, each answer becoming the next question. The terminal answer — not the surface cause — gets mapped to a standardized category tag like Fatigue, Procedure Gap, or Mechanical. Without consistent tags you cannot aggregate 200 incident narratives into a ranked root cause list, which is the whole point of the exercise. You can Start Free Trial and Oxmaint will walk each incident through the 5-why flow automatically.
Which incident dimensions should we capture for trend analysis to work?
At minimum: driver ID, vehicle ID, route or corridor, time of day and shift hour, weather and road conditions, light level, load type, and road type. Oxmaint captures 25+ dimensions at intake so the dashboard can slice by any of them without manual re-entry. The more dimensions you capture, the faster clusters surface — a route cluster might be invisible until you also tag the specific intersection, not just the city.
How quickly can we expect incident frequency to drop after acting on the top three root causes?
Fleets that identify and address their top three root cause categories typically see a 30–50% reduction in incident frequency within 12 months. Fatigue and driver-skill clusters respond fastest — often within two quarters — because the intervention (break redesign, targeted coaching) takes effect immediately. Route and weather clusters may take a full seasonal cycle to validate. Book a Book a Demo session to see the dashboard build your baseline from existing data.
What does it cost to run trend analysis in Oxmaint?
Trend analysis and the 25+ dimension incident capture are included in every Oxmaint fleet plan — there is no separate analytics tier. The dashboard builds itself from the incidents you log, so the only input cost is the 3–5 minutes per incident your drivers or supervisors already spend on the report. Against a single prevented preventable crash at $74,000, the platform pays for itself many times over in the first quarter of use.
Your top three root causes are already in your data
Upload 12 months of incident records and Oxmaint surfaces the driver, route, time, vehicle, and weather clusters automatically — then tags each root cause so your safety program targets the 60–80% that actually matters.
Free 14-day trial · No credit card