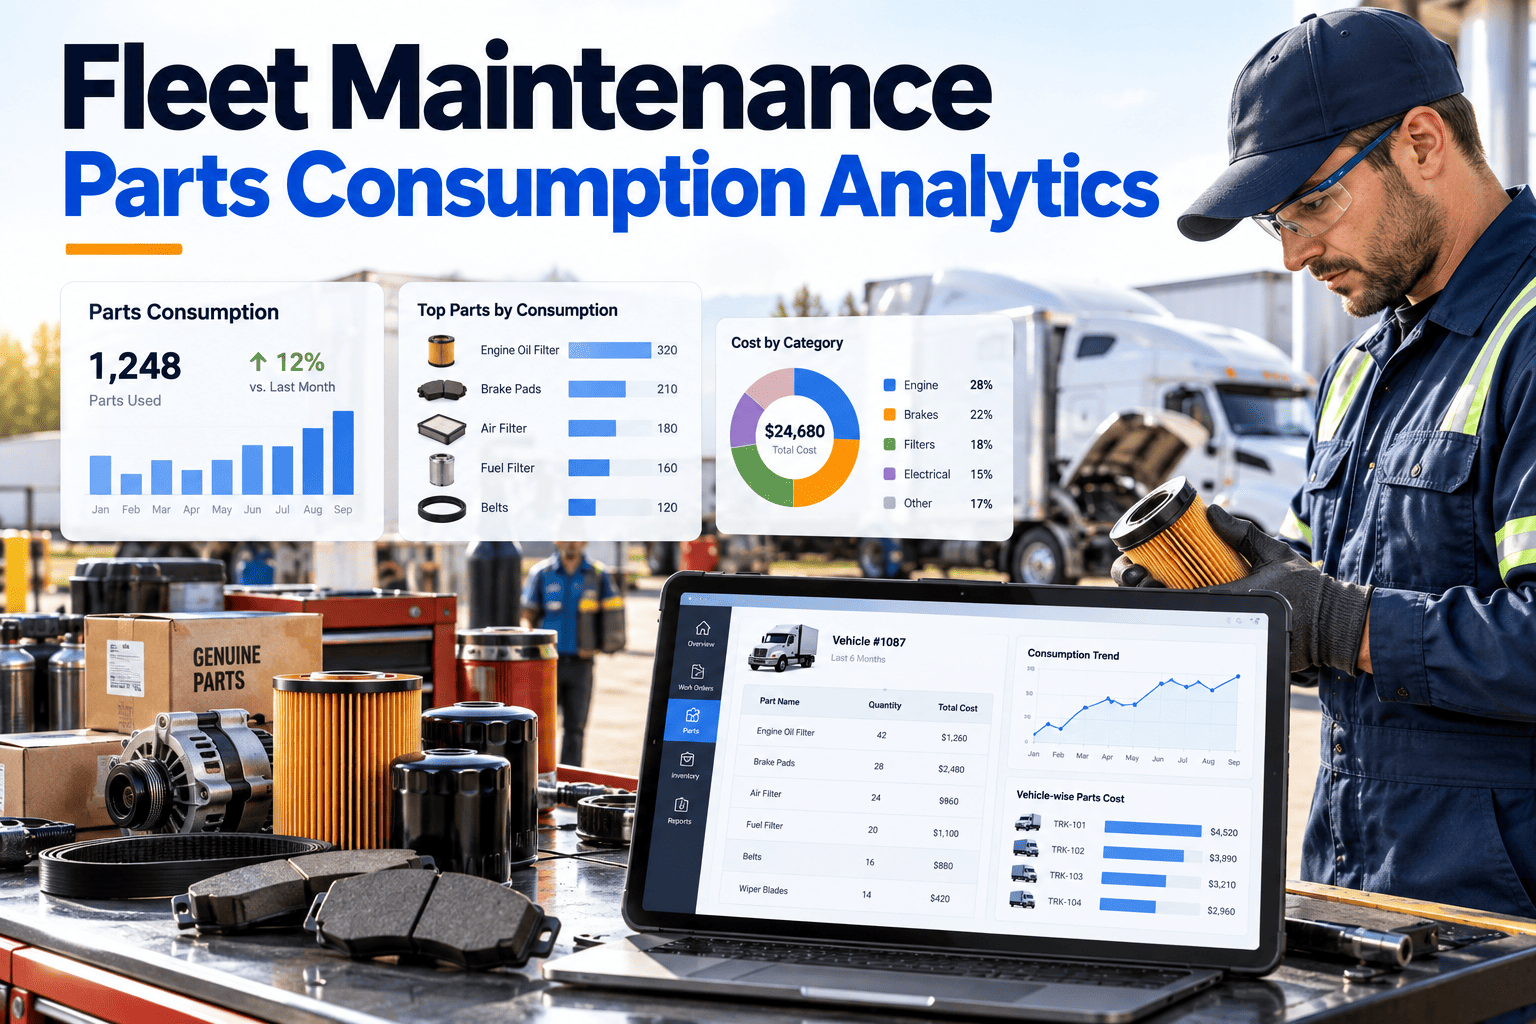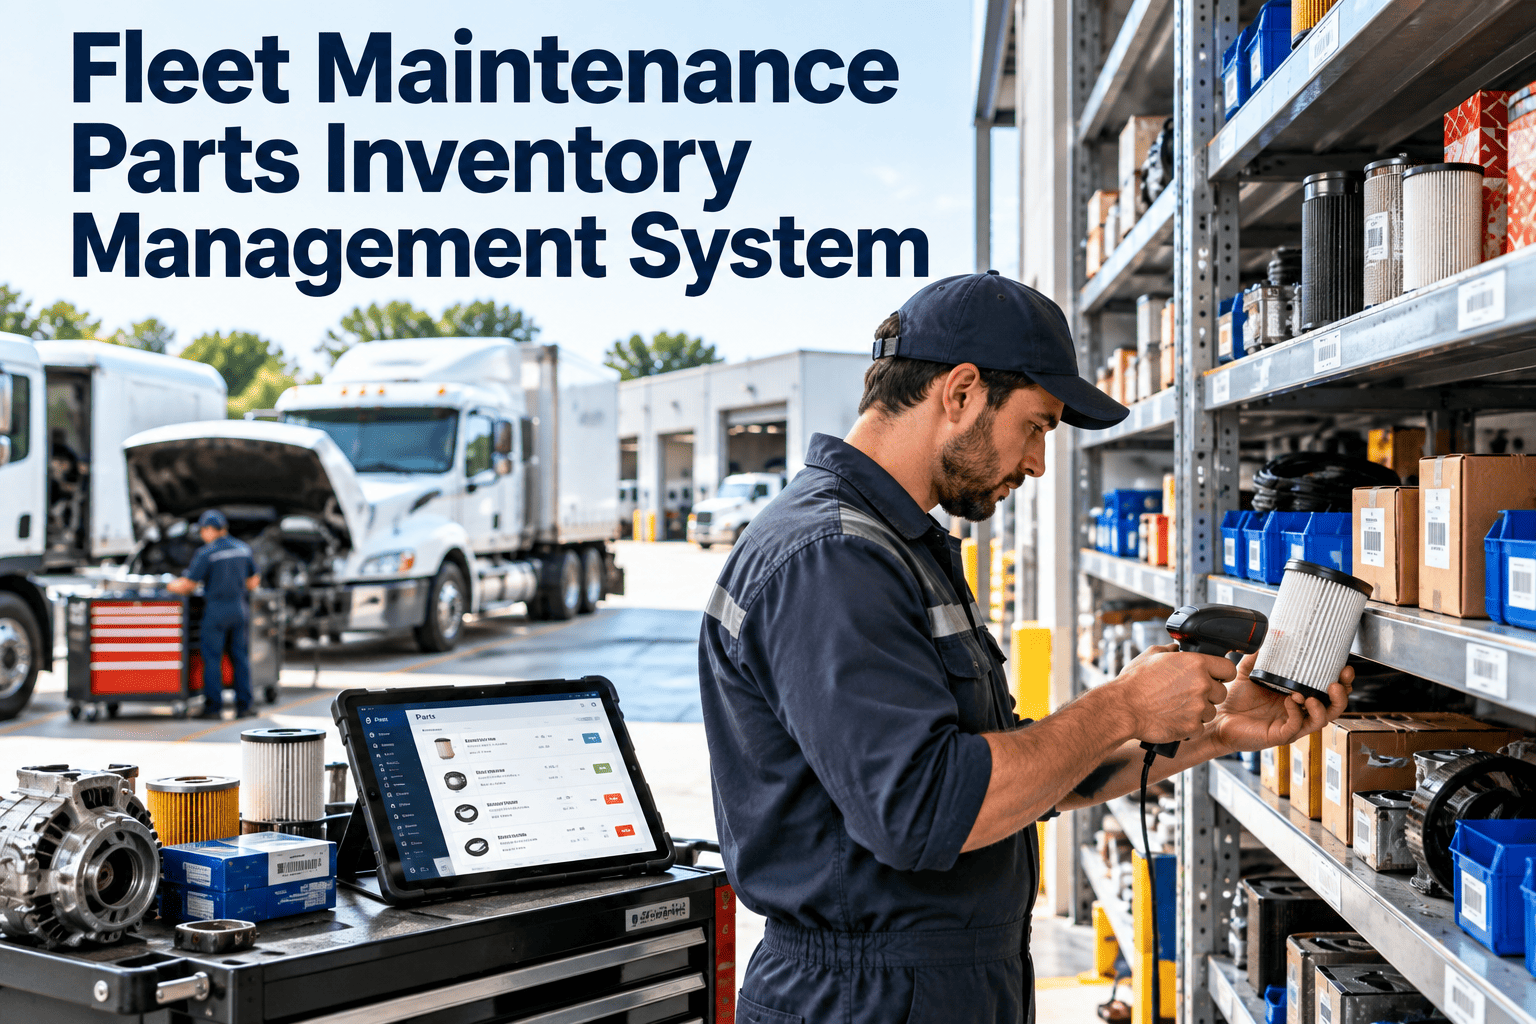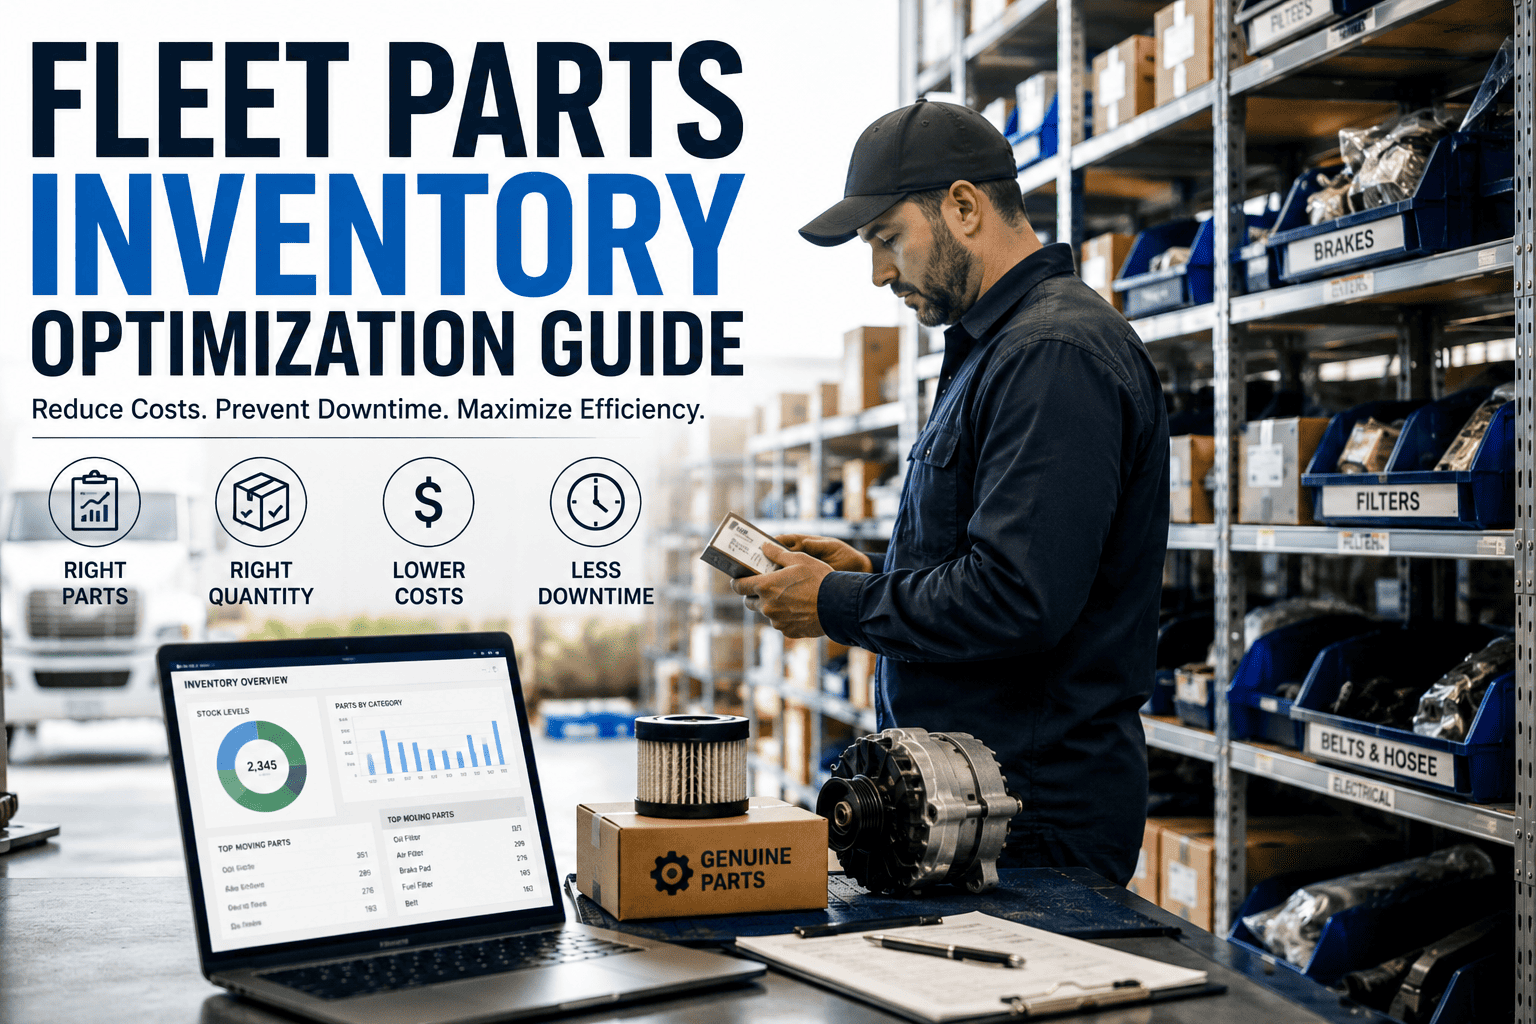
Fleet parts demand forecasting transforms spare-parts inventory from reactive safety-stock guesswork into data-driven stocking, so the right component is on the shelf the moment a work order opens. For maintenance and reliability teams managing hundreds of assets, fleet predictive analytics for parts demand cuts carrying costs by 20–30% while reducing stockout-driven downtime by up to 45%. By linking PM schedules, failure history and real-time telematics to a CMMS like OxMaint, inventory managers shift from scrambling for parts to predicting exactly what each vehicle will need—and when. Stop betting on min-max spreadsheets and Start Free Trial to see AI-driven parts demand prediction for your fleet.
Stop guessing. Start forecasting fleet parts demand with AI.
Most fleets carry 25–40% more inventory than they need—yet still run out of critical parts mid-repair. Predictive parts demand modeling flips the script: the right part, in the right quantity, on the right shelf, before the work order is even opened.
Why traditional fleet parts stocking is broken
A 300-vehicle fleet typically ties up $180K–$420K in spare-parts inventory. Yet 60% of maintenance managers report weekly stockouts that idle technicians and extend vehicle downtime by 1–3 days per event. The problem isn't effort—it's method. Min-max thresholds and last-month consumption reports are backward-looking by definition. They tell you what broke, not what's about to break.
Fleet parts predictive analytics solves this by consuming PM schedules, historical failure data, mileage/engine-hour trends and seasonal usage patterns to project demand at the SKU level—days or weeks ahead. The result: fewer emergency purchases, less idle tech time, and vehicles back on the road faster.
How fleet parts demand forecasting actually works
Predictive parts demand for fleets isn't a black box. It's a structured pipeline that turns maintenance data into procurement signals. Here's the four-stage model OxMaint uses to forecast parts demand with 85–92% accuracy for mature fleets.
Data aggregation
OxMaint pulls together work-order history, PM checklists, asset meter readings, failure codes and parts-consumption logs into a single normalized dataset. Fleets with 12+ months of clean CMMS data see the strongest forecast accuracy.
PM-linked consumption modeling
Each PM template is mapped to its bill of materials. When the scheduler forecasts 45 oil changes and 12 brake inspections next month, OxMaint calculates exact parts demand—filters, pads, rotors, fluids—per asset class and usage rate.
Failure pattern prediction
Machine-learning models analyze failure intervals by asset type, operating environment and age. A delivery van running urban routes in 90°F heat gets a different failure profile—and parts demand curve—than the same van on highway duty.
Demand signal output
The model outputs a ranked, time-phased procurement list: what to order, how many, and the latest order date to avoid a stockout. Purchasing gets a plan; inventory gets a target; maintenance gets confidence the part will be there.
The fleet parts demand forecast formula
At its core, predictive parts demand for fleet maintenance combines planned consumption (from PM schedules) with probability-weighted unplanned consumption (from failure models). Here's the simplified calculation OxMaint runs for every critical SKU.
In practice, a 220-truck regional haul fleet used this model in OxMaint to drop brake-pad stockouts from 11 per quarter to zero—while reducing brake-parts inventory value by $14,200. The parts manager stopped ordering "just in case" and started ordering "just in time, backed by data."
Reactive stocking vs predictive fleet parts demand analytics
The gap between spreadsheet-driven parts management and AI-powered demand forecasting isn't marginal. It's the difference between a maintenance operation that bleeds cash on expedited freight and one that runs lean, compliant and ready.
| Dimension | Reactive / Min-Max | Predictive Analytics (OxMaint) |
|---|---|---|
| Forecast basis | Last 90 days consumption | PM schedule + failure probability + usage trends |
| Stockout frequency | 4–8 critical SKUs per month | 0–1 per quarter |
| Inventory turnover | 2.1x annually | 4.5–6x annually |
| Obsolescence rate | 18–25% of catalog value | 4–7% of catalog value |
| Emergency purchase spend | $3,200–$7,500 per month | $400–$1,100 per month |
| Technician wait time | 4+ hrs per week | Under 30 min per week |
| Audit readiness | Manual spreadsheet reconciliation | Full digital trail, FMCSA / ISO 55000 aligned |
How OxMaint powers fleet parts predictive analytics
OxMaint brings the CMMS structure, predictive engine and inventory control into one platform—so parts demand forecasting isn't a separate spreadsheet you maintain by hand, but a live output of your maintenance workflow.
PM-linked demand modeling
OxMaint maps every PM template to its parts bill of materials and auto-calculates upcoming consumption based on the live PM schedule. Fleets report 30–50% fewer PM delays caused by missing parts.
Predictive failure signals
AI models analyze work-order history, meter readings and asset age to predict which units are approaching failure—then pre-stage the parts most likely to be needed. Cut unplanned downtime by 30–50%.
Dynamic safety stock optimization
Instead of fixed reorder points, OxMaint adjusts safety stock per SKU based on lead time variability, service-level targets and forecast confidence—freeing 20–30% of locked inventory capital.
Live inventory + procurement sync
When the forecast flags a shortfall, OxMaint generates a purchase request pre-filled with quantity, vendor and delivery deadline. No manual data entry, no missed reorder windows, full spend visibility.
A 180-vehicle fleet, 90 days, real numbers
Consider a regional delivery fleet of 180 medium-duty trucks. Before predictive analytics, the parts manager ordered based on a quarterly consumption report and gut feel. Stockouts hit 6–9 times per month. Expedited freight alone cost $4,300/month. Obsolete brake and filter inventory sat at $38,000.
After deploying OxMaint's fleet parts demand prediction over a 90-day baseline:
The fleet's maintenance director summed it up: "We stopped buying parts we didn't need and started having the parts we actually needed. That's the whole game."
See OxMaint forecast your fleet's parts demand—live on your data
Book a 30-minute demo and we'll walk you through a predictive demand model built around your assets, your PM schedule and your parts catalog.
Fleet parts demand forecasting: your questions answered
What is fleet parts demand forecasting?
Fleet parts demand forecasting uses historical work-order data, PM schedules, failure patterns and usage trends to predict which spare parts your fleet will need—and in what quantity—over a defined future period. Unlike reactive min-max stocking, it's forward-looking and continuously updated as new maintenance data flows in.
How accurate is predictive fleet parts demand?
For fleets with at least 12 months of clean CMMS data, demand forecast accuracy typically reaches 85–92% for high-volume SKUs. Accuracy improves as the system learns from each completed work order and parts receipt. Newer fleets see lower initial accuracy but rapid improvement within 60–90 days of consistent data entry. Start Free Trial to baseline your fleet.
How much inventory cost can predictive analytics save a fleet?
Most fleets see a 20–30% reduction in carrying costs within the first year, driven by lower overstock, reduced obsolescence and fewer emergency purchases. A 180-vehicle fleet can recover $40K–$60K in working capital while simultaneously cutting stockout-related downtime by 35–50%.
Does OxMaint integrate with existing fleet telematics and ERP systems?
Yes. OxMaint connects to major telematics providers, ERP systems and parts supplier catalogs via API. Meter readings, engine hours and fault codes flow into the predictive model automatically, so demand forecasts reflect real-time asset condition—not just calendar-based PM intervals. Book a Demo to review your integration stack.
How long does it take to implement fleet parts predictive analytics?
A typical fleet of 150–300 assets goes live in 2–4 weeks. OxMaint imports your existing work-order history, asset registry and parts catalog, configures PM-to-BOM mappings, and runs an initial forecast baseline. Most teams see actionable demand signals within the first 30 days of full deployment.
Predict every part. Eliminate every stockout.
Join the fleets using OxMaint to forecast parts demand, cut inventory waste and keep vehicles on the road. Start free or book a personalized demo today.
Free 14-day trial · No credit card