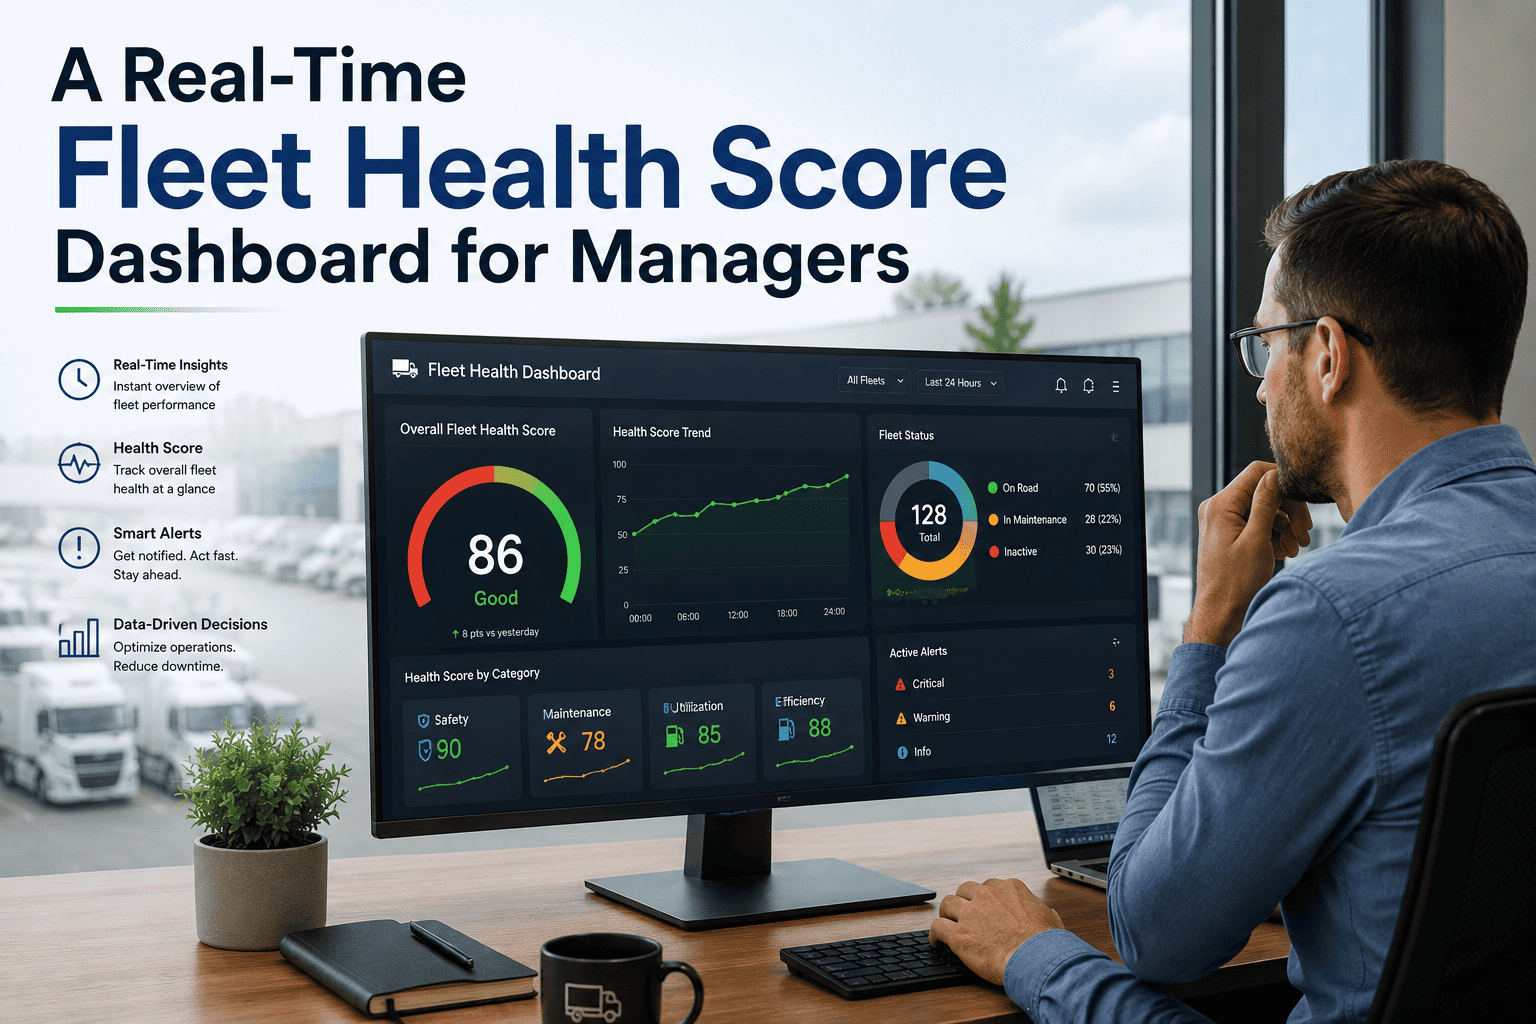
Predictive maintenance stops being a buzzword the moment a maintenance director opens a dashboard on Monday morning and sees, ranked from worst to least-bad, exactly which trucks are trending toward failure this week — not after the tow bill arrives. This page breaks down the six leading signals a whole-fleet health dashboard synthesizes into a daily risk score, the uptime math that turns an 87% fleet into a 96% fleet, and the moderate infrastructure stack required to feed it. You can read the entire guide, then Start Free Trial or book a walkthrough to see the live model on your own assets.
Which truck fails next — and can you see it 8 weeks early?
A predictive analytics dashboard turns six quiet leading indicators into one ranked risk list, refreshed daily, so your team services the top-risk vehicles before the failure ever happens — not after the roadside call.
From 65% preventive to 80% predictive — in one maintenance mix
Reactive work costs 3–5× more per event than scheduled work and steals revenue-generating seat time. Six independent leading indicators, viewed together, let a fleet re-balance its maintenance mix inside one quarter.
Uptime stuck at 87–90%. Roadside events, tows, and unplanned parts air-freight eat the margin.
Uptime lifts to 94–96%. Failures become scheduled events inside the PM bay, not roadside surprises.
Six signals that see failure before the driver feels it
Each signal alone catches a specific failure mode weeks earlier than fixed PM intervals. Layered into one risk model, they cover roughly 85% of the unplanned-downtime causes most fleets see in a year.
A specific SPN/FMI code recurring more frequently over a rolling 30–60 day window is one of the strongest predictors of an upcoming component failure. The dashboard counts recurrence, not just presence — the third occurrence of SPN 1569 in five weeks is not the same as the first.
Rising iron, copper, or aluminum in ppm — trended across consecutive samples — maps to specific component wear. Iron climbing 40% sample-over-sample points at cylinder liner or gear wear; copper spikes flag bearing wear long before oil pressure drops.
Tread depth divided by miles driven since last reading gives a wear-per-mile figure. Project forward and you get a calendar replacement date per axle position — so tires are cycled in during a planned PM, not after a highway blowout.
A rising baseline differential pressure across regen cycles predicts a DPF cleaning or replacement need weeks before the truck derates. Track the post-regen floor, not the peak — that floor creeping up 2–3 kPa per week is the tell.
A sustained MPG drop below the peer-vehicle benchmark — same route, same load profile — predicts mechanical decline: dragging brakes, fuel system drift, or aftertreatment restriction. A 0.4 MPG unexplained slip on one truck in a 12-truck pod is a flag, not noise.
The same defect noted on the same component across multiple DVIRs from different drivers is the earliest human-sensed signal of a systemic issue. Three separate drivers logging "steering pulls left" inside 30 days is a predictive flag the moment the third report lands.
7 points of uptime = 7 points of revenue-generating time
Uptime is not a vanity metric — it is revenue per available truck per day, multiplied across the fleet. Here is the worked example for a mid-size fleet.
Monday standup: working the top-risk list first
A 180-truck regional fleet uses a daily-refreshed risk ranking to set bay priority. Here is how one week's top three vehicles got handled before failure — not after.
| Unit | Risk Score | Active Signals | Action Window | Outcome |
|---|---|---|---|---|
| Truck 047 | 92 | SPN 1569 ×4 in 5 wks · Iron +38% · MPG −0.5 | Schedule within 4 days | Turbo actuator replaced in PM bay — no roadside |
| Truck 112 | 87 | DPF baseline +2.4 kPa/wk · DVIR "regen frequent" ×3 | Schedule within 9 days | DPF cleaned proactively — derate avoided |
| Truck 068 | 74 | Copper +27% · Tire RF wear rate up 31% | Schedule within 14 days | Bearing + steer tires cycled at next PM |
| Truck 155 | 41 | MPG −0.2 vs peer (monitoring only) | Re-check in 30 days | No action — stays on watch list |
Risk scores are refreshed nightly in Oxmaint; the maintenance lead works the list top-down at the Monday standup and books each unit into the next open bay slot before it fails.
Four data sources, one unified risk model
The infrastructure requirement is moderate — most fleets already own 2 of the 4 feeds. The job is plumbing them into a single CMMS-side risk model, not buying new hardware.
Live fault codes, vehicle speed, RPM, MPG, and aftertreatment pressure streamed from the J1939 bus via your existing telematics provider. This is the highest-frequency feed — typically 1 Hz or finer.
Per-vehicle sample results returned electronically — iron, copper, aluminum, lead, silicon, viscosity, fuel dilution — trended across the sample history for every unit in the fleet.
Tire pressure and temperature events from the TPMS feed, paired with manual tread-depth readings captured at each PM, give a per-axle wear-per-mile figure and projected replacement date.
The CMMS — in Oxmaint this is built in — consumes all four feeds into a per-vehicle risk score refreshed daily. DVIR data adds the human-sensed layer; the model weights and ranks every asset.
Which signal catches which failure — and how early
No single signal covers every failure mode. The matrix below maps each indicator to the components it protects and the typical warning lead time before functional failure.
| Signal | Primary Components Protected | Failure Mode Caught | Lead Time |
|---|---|---|---|
| Fault-Code Trending | Aftertreatment, EGR, turbo, transmission | Derate or Limp Mode | 2–8 wks |
| Wear-Metal Trending | Engine bearings, cylinders, gears | Catastrophic mechanical failure | 3–10 wks |
| Tread Wear Rate | Steer, drive, trailer tires | Blowout / out-of-service CVSA | 4–12 wks |
| DPF Pressure Trend | DPF, DOC, sensors | Forced parked regen / replacement | 3–6 wks |
| Fuel Efficiency Decline | Brakes, fuel system, aftertreatment | Progressive mechanical decline | 4–8 wks |
| DVIR Defect Pattern | Steering, brakes, lights, suspension | Systemic component failure | 1–4 wks |
See your fleet's risk ranking before next Monday's standup
Connect your telematics, oil analysis, TPMS, and DVIR feeds and watch 180 trucks get ranked by failure risk — refreshed every 24 hours.
Predictive fleet dashboard — five questions answered
How is a predictive risk score different from a fault-code alert?
A fault-code alert fires the moment a code sets — useful, but reactive to the symptom. A predictive risk score weighs the recurrence rate of that code over 30–60 days alongside oil analysis, DPF pressure trend, MPG drift, and DVIR patterns, then ranks the vehicle against every other unit. You act on the trend, not the single event.
What infrastructure do we need before going live?
Four feeds: telematics streaming J1939 data, an oil-analysis subscription returning results electronically, TPMS integration, and a CMMS that consumes all of them into one model. Most fleets already run the first two. You can Start Free Trial and connect feeds incrementally — the risk model improves as each source comes online.
How quickly can we expect uptime to move from 87% to 94%?
Fleets that connect all four feeds and adopt the weekly top-risk standup typically see measurable uptime lift inside the first quarter and reach the 94–96% band within two quarters. The fastest gains come from the fault-code and DPF signals, which catch the highest-cost roadside events earliest.
Does predictive replace our PM schedule?
No — it resequences and prioritizes around it. Fixed PM intervals stay as the backbone; predictive tells you which trucks to pull in early, which can safely run longer, and which bay slot to assign this week. The mix shifts from 65/35 preventive-reactive toward 80/20 preventive-predictive/reactive.
What does the recommended action window on each vehicle mean?
It is the calendar window — typically 4 to 14 days — during which the vehicle should be scheduled into the bay to intervene before functional failure. Book a Book a Demo session and we will walk through how the window is calculated from the lead time of each active signal.
Stop reacting to failures. Start ranking them.
Deploy the Oxmaint predictive analytics dashboard and turn six leading indicators into one daily risk-ranked list across your whole fleet.
Free 14-day trial · No credit card