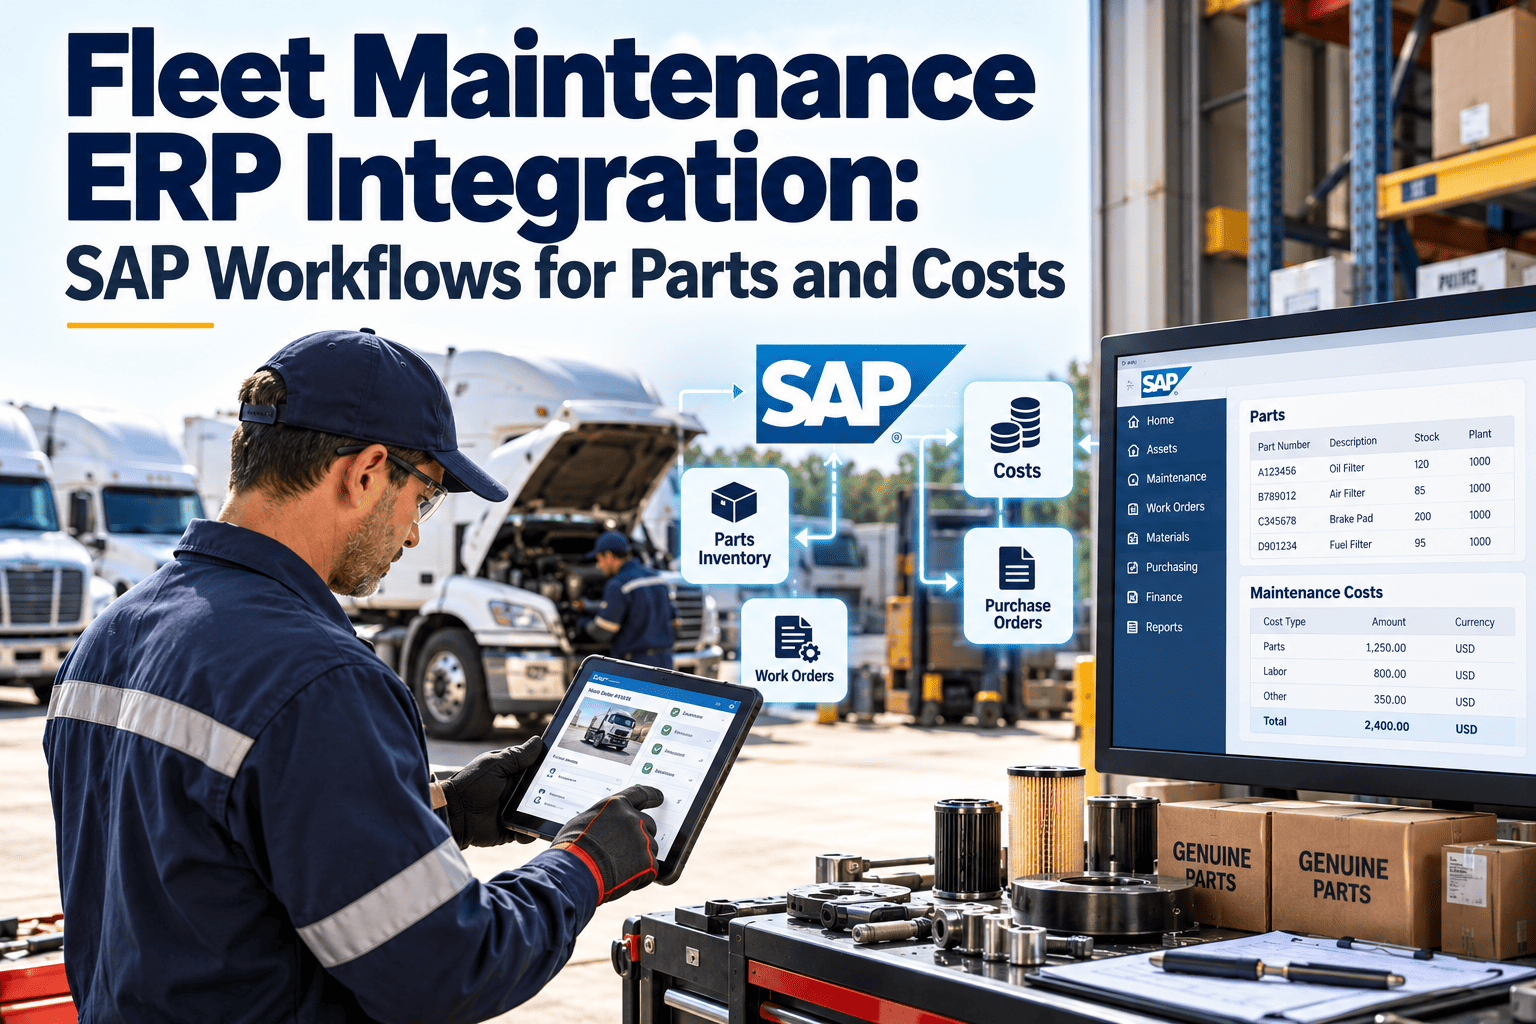
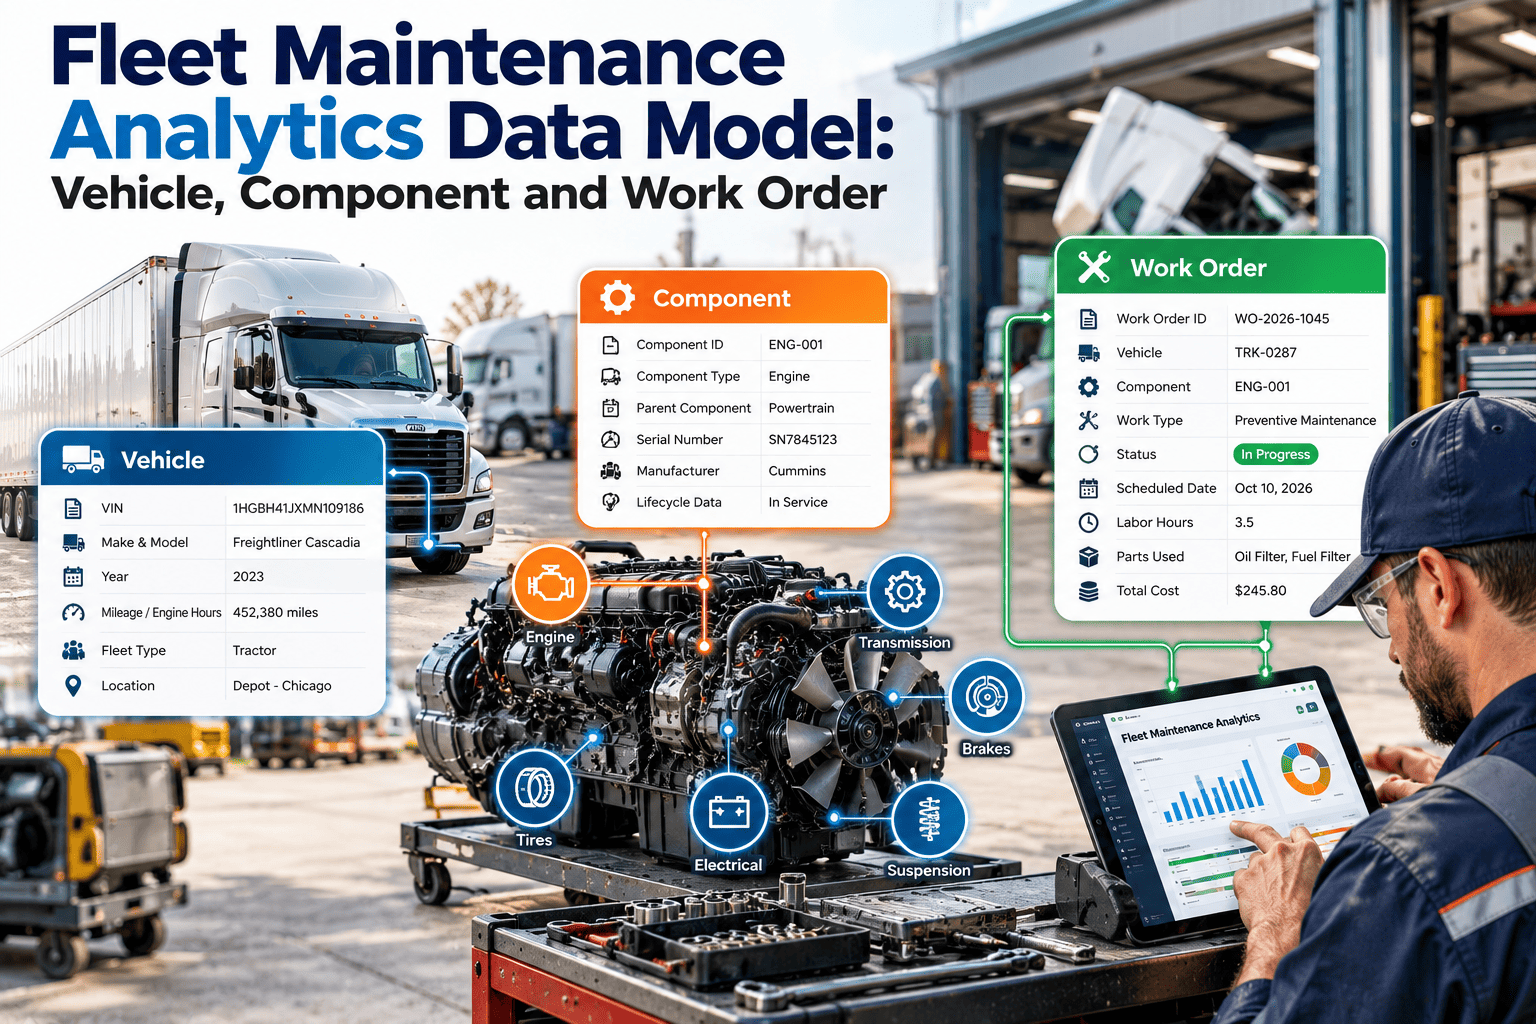
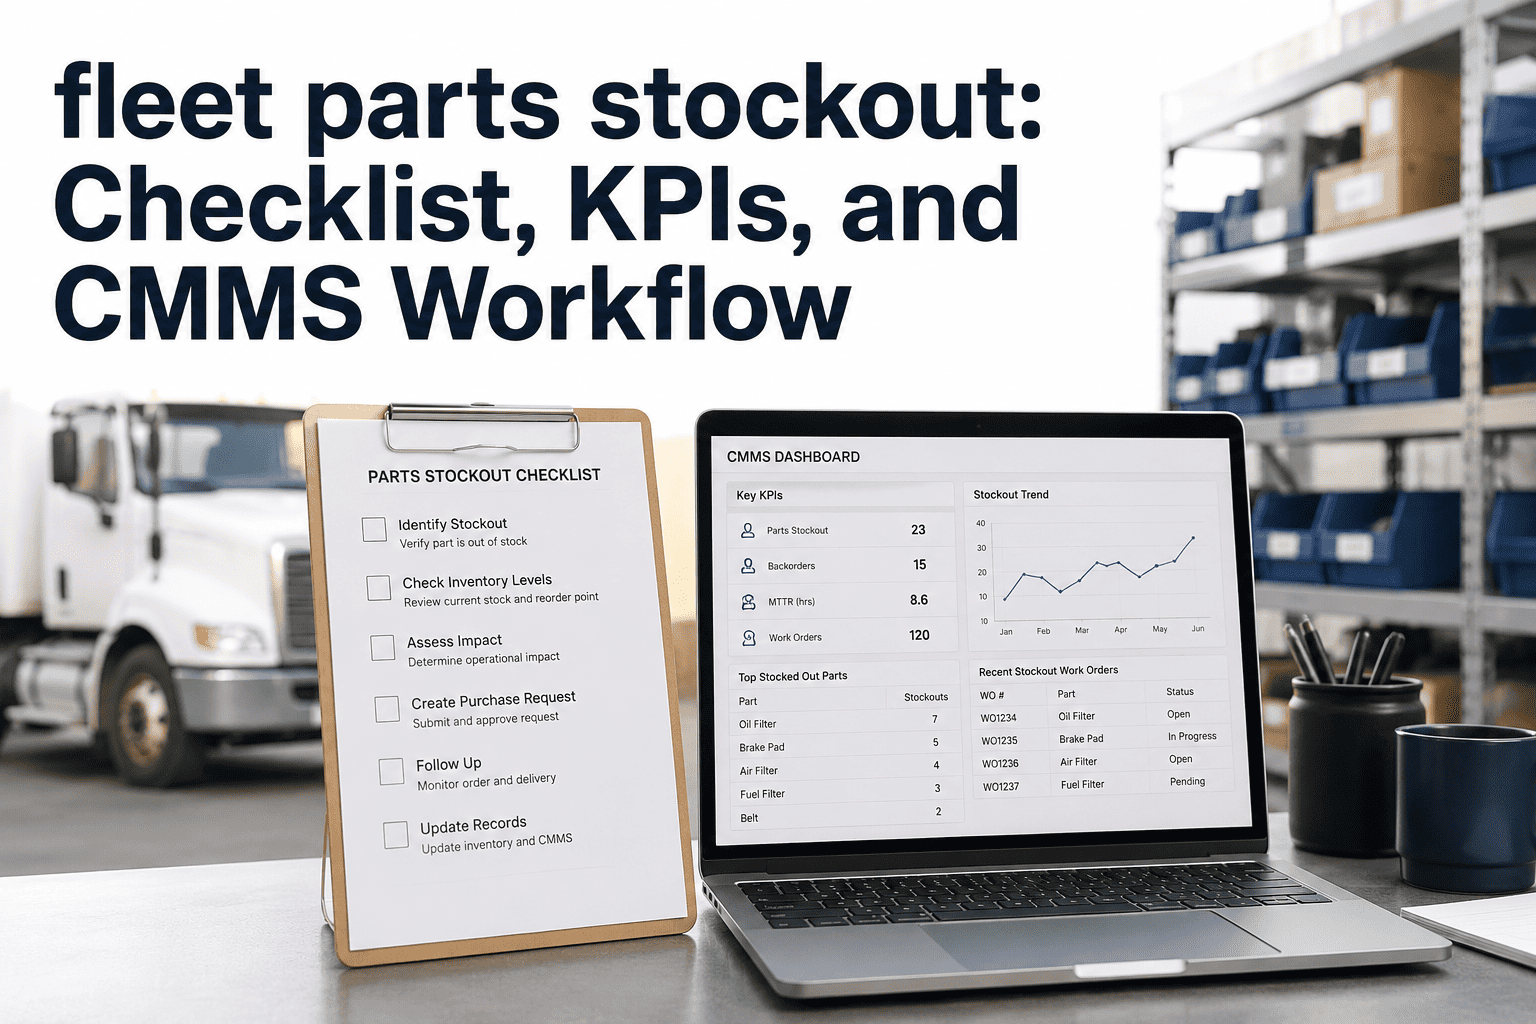
Parts are one of the largest controllable costs in fleet maintenance, yet many shops still reorder from habit. Stockouts keep vehicles waiting in the bay, while overstock ties up cash in parts that never move. Parts consumption analytics connects what was used, on which vehicle, for which repair, so purchasing follows evidence. Below is a practical approach to the metrics and routines that matter, along with how a fleet maintenance CMMS captures the data at the source.
Fleet Maintenance Parts Consumption Analytics
See what your fleet really consumes, where it goes, and what to stock, so parts support uptime instead of blocking it.
Filters
Brakes
Tires
Lighting
Other
Questions consumption data should answer
Q1Which parts do we use most, by quantity and by spend?
Q2Which vehicles or classes consume more than their peers?
Q3Which parts fail early, and is it one supplier or one duty cycle?
Q4Which stock has not moved in a year?
Q5How often do repairs wait on a missing part?
Core metrics to track
| Metric | What it shows | Action it supports |
|---|
| Consumption per vehicle | Parts used per unit, mile, or hour | Spot outliers and abnormal wear |
| Parts cost per mile or hour | Spend normalized for utilization | Compare classes and routes fairly |
| Stockout rate | Requests that could not be filled from stock | Adjust reorder points |
| Inventory turnover | How fast parts move | Cut slow stock |
| Parts-wait time | Days a vehicle waits for a part | Prioritize critical items |
| Repeat part replacement | Same part replaced again soon | Challenge quality or root cause |
| Emergency purchase share | Spend outside normal ordering | Improve forecasting |
Sort stock by value and criticality
Tier A: high value or criticalTight control, frequent review, safety-critical items always stocked.
Tier B: moderate useStandard reorder points reviewed on a regular cycle.
Tier C: low value, high countSimple min-max rules, bulk buying, minimal effort.
Combine value ranking with criticality. A cheap sensor that grounds a vehicle belongs in a higher tier than its price suggests.
From work order to purchase decision
1Issue the part against a work order and asset, never loose.
2Record the cause so wear, damage, and routine change are separable.
3Aggregate usage by part, vehicle class, and period.
4Set reorder points from real demand and supplier lead time.
5Review exceptions such as spikes, stockouts, and repeat failures.
Stock what your fleet actually uses
Tie every part to a work order and a vehicle, and let usage guide purchasing.
Reading the patterns
| Pattern in the data | Possible cause | Next step |
|---|
| One vehicle uses far more brake parts | Route, driving style, or a failing component | Inspect and compare duty cycle |
| Same part fails early across units | Supplier quality or incorrect specification | Review warranty and alternatives |
| Frequent stockouts on one item | Reorder point too low or long lead time | Recalculate from usage |
| Large idle stock | Retired models or over-buying | Stop reordering, review disposal |
| Rising emergency buys | Weak forecasting or late work orders | Plan from preventive schedules |
Data hygiene that makes analytics trustworthy
- One part number per item, with clear naming and units.
- Parts issued only against open work orders.
- Returns and cancellations recorded, not ignored.
- Meter readings captured at each repair.
How Oxmaint supports parts analytics
- Inventory. Track stock levels, locations, and reorder points.
- Work orders. Record parts and labor against each repair.
- Asset history. See consumption by vehicle over time.
- Preventive maintenance. Forecast parts needs from scheduled services.
- Reporting. Dashboards for usage, cost, and repeat replacement.
Normalize consumption so comparisons are fair
Raw part counts mislead. A vehicle that drives twice as far will use more parts without being any worse.
- Per distance or hours. Express usage per 1,000 miles or per engine hour.
- Per vehicle class. Compare trucks with trucks, vans with vans.
- Per duty cycle. Separate urban, regional, and long-haul work.
- Per period. Use rolling 12-month views to smooth seasonal swings.
- Per cause. Split scheduled replacement, wear-out failure, and damage.
Why cause coding matters
- Routine replacement is planned demand and can be forecast.
- Failure-driven demand points to quality or maintenance problems.
- Damage-driven demand may point to driver training or route hazards.
Forecasting demand from preventive schedules
Much of a fleet's parts demand is predictable, because services have intervals and bills of materials.
1List upcoming services for the next 30, 60, and 90 days from the preventive maintenance schedule.
2Attach standard parts such as filters, fluids, and wear items to each service type.
3Add historical failure demand based on past unplanned repairs of the same parts.
4Compare to stock and supplier lead times to find shortfalls early.
5Order in planned batches rather than emergency one-offs.
Setting reorder points and safety stock
| Element | Meaning | Practical note |
|---|
| Average daily or weekly use | Demand taken from issued parts history | Use at least 6 to 12 months where possible |
| Supplier lead time | Days from order to receipt | Use realistic delivery times, not the quoted best case |
| Safety stock | Buffer for demand or delivery variation | Larger for critical parts and unreliable suppliers |
| Reorder point | Stock level that triggers an order | Roughly demand over lead time plus safety stock |
| Order quantity | How much to buy each time | Balance holding cost, price breaks, and storage space |
Revisit reorder points at least twice a year, or when fleet size, routes, or suppliers change.
Judging supplier and brand performance
- Compare average life of the same part from different suppliers on similar vehicles.
- Track early failures and returns per supplier.
- Record delivery reliability: on time, partial, or late.
- Note price against life, since the cheapest part is not always the lowest cost per mile.
- Keep failure evidence, such as photos and removal dates, for warranty conversations.
Warranty recovery
- Record install date, meter reading, and vehicle on every parts issue.
- Flag parts still under warranty when work orders are created.
- Review repeat failures for claim opportunities each month.
Controlling issue discipline and shrinkage
AIssue parts only against an open work order and asset.
BRecord unused parts as returns so counts stay accurate.
CRun regular cycle counts on high-value and fast-moving items.
DInvestigate adjustments instead of accepting them silently.
ERestrict access to high-value or theft-prone items.
Consumables, rotables, and core charges
| Type | Examples | Analytics focus |
|---|
| Consumables | Filters, fluids, bulbs, wiper blades | Usage per service, bulk purchasing, min-max rules |
| Wear items | Brake pads, tires, belts | Life per vehicle class and per supplier |
| Rotables and cores | Alternators, starters, compressors | Core returns, rebuild cycles, repair-versus-replace cost |
| Critical spares | Sensors, modules, safety components | Availability, lead time, and downtime avoided |
Seasonality and fleet changes
- Winter can raise battery, wiper, and tire demand in colder regions.
- Hot seasons may increase cooling system and air conditioning repairs.
- New vehicle types bring new parts, so stock can fall behind quickly.
- Retiring a model should trigger a review of its dedicated parts.
- Route changes can shift brake and suspension demand.
Build seasonal adjustments only after a full year of consistent data, to avoid reacting to noise.
A parts dashboard that people will use
| Panel | Content | Who uses it |
|---|
| Top spend parts | Highest cost items by month and by class | Fleet manager |
| Stockout and parts-wait | Missed requests and vehicles waiting | Shop supervisor |
| Slow-moving stock | Items with no usage in a set period | Parts manager |
| Repeat replacement | Same part failing again by vehicle | Reliability lead |
| Upcoming demand | Parts needed for scheduled services | Purchasing |
Fewer panels used weekly are more valuable than dozens that nobody opens.
Rollout plan
- Weeks 1 to 2. Clean part numbers, units, and locations. Remove duplicates.
- Weeks 3 to 4. Require parts to be issued against work orders and assets.
- Weeks 5 to 8. Tier stock, set reorder points for tier A and B items, and run counts.
- Weeks 9 to 12. Review consumption patterns, supplier life, and stockouts. Adjust.
Tires, a special case worth separate analysis
Tires are often the largest single parts line in a fleet, and their data needs its own treatment.
- Track tires by serial number and position, not just by quantity purchased.
- Record install date, meter reading, tread at install, and removal reason.
- Compare cost per mile by brand, size, and position, such as steer versus drive.
- Separate casings that can be retreaded from those scrapped for damage.
- Link pressure checks and alignment work to early wear, to find the root cause rather than just replacing tires.
What the analysis reveals
- Uneven wear on one axle often points to alignment or suspension faults.
- High damage rates on certain routes may justify route or driver reviews.
- A brand with lower purchase price but shorter life can cost more per mile.
Linking parts data to root causes
| Signal | What to check | Possible fix |
|---|
| Rising brake pad use on a route group | Route grades, loads, driving practices, caliper condition | Adjust inspection interval, review driver coaching |
| Frequent alternator or battery changes | Charging system tests, parasitic loads, installation quality | Add charging system check to preventive maintenance |
| Repeated filter replacements | Operating environment, filter spec, restriction readings | Change spec or interval based on conditions |
| Repeated hose or fitting failures | Routing, clamping, vibration, part quality | Correct installation standard, review supplier |
| Short light or lamp life | Voltage issues, connector corrosion, vibration | Fix wiring, then replace lamps |
Replacing a part again without asking why is one of the most common sources of avoidable parts spend.
Balancing availability and cash tied up in stock
Too little stockVehicles wait, emergency purchases rise, premium freight costs grow.
Balanced stockCritical parts available, slow items limited, planned purchasing dominates.
Too much stockCash tied up, parts age on shelves, obsolete items accumulate.
Ways to find the balance
- Review slow-moving items every quarter and decide to return, sell, or write off.
- Agree supplier delivery arrangements for items too costly to stock.
- Keep full coverage for safety and high-downtime parts.
- Use consignment or vendor-managed options where available and sensible.
Roles and routines
1Technicians record parts used, cause, and removed-part condition on each work order.
2Parts staff keep counts accurate, issue against work orders, and flag stockouts.
3Planners use upcoming services to anticipate demand and request parts early.
4Reliability or fleet leads review repeat replacements and supplier performance.
5Finance and purchasing use the results for budgets, contracts, and supplier talks.
Common mistakes in parts analytics
- Counting purchases instead of usage. Buying data does not show what was actually consumed.
- Ignoring returns. Unreturned unused parts inflate apparent consumption.
- Mixing part numbers. Alternates and supersessions split history across several records.
- Chasing averages. Averages can hide a few vehicles that consume most of a part.
- No cause coding. Without it, planned and failure demand look identical.
- Annual-only reviews. Problems stay hidden for months.
Questions for a monthly parts review
1Which five parts drove the most spend, and why?
2Which vehicles were waiting on parts, and for how long?
3Which parts were replaced more than once within a short window?
4Which stock had no movement this period?
5Which emergency purchases could have been planned?
6Which warranty claims are pending or missed?
Connecting parts analytics to uptime
The real test of parts analytics is whether vehicles spend less time waiting. Three links make that visible.
- Parts-wait days. Record when a work order is paused for a missing part and when it resumes. Summarize by part and supplier.
- Repeat visits. Count vehicles returning because the first repair used a wrong or defective part.
- Planned versus emergency work. A growing share of planned jobs usually means parts are arriving ahead of need.
Practical improvements that follow
- Pre-stage parts for scheduled services so bays are never idle.
- Keep a short list of fast-moving critical parts at each depot.
- Agree same-day delivery terms for items that cannot be stocked.
- Review the top causes of parts-wait each month and assign an owner for each.
Data you can trust
- Standardize part descriptions and units before building any reports.
- Reconcile stock counts against system quantities on a fixed schedule.
- Audit a small sample of work orders each month for correct parts coding.
Reporting parts results to management
- Lead with outcomes. Show parts-wait days, stockout rate, and emergency purchase share before detailed charts.
- Explain exceptions. For each large cost swing, state the cause: seasonal demand, a failing supplier batch, a fleet change, or one problem vehicle.
- Show actions taken. List reorder point changes, supplier reviews, and stock reductions with dates.
- Quantify avoided waste carefully. Use your own recorded figures, such as fewer emergency orders, rather than estimates.
- Set next-quarter targets. Pick two or three measurable goals, such as shorter parts-wait time or fewer stockouts on critical items.
Keep reports credible
- State the period, fleet size, and data sources on every report.
- Flag known data gaps so readers do not over-interpret trends.
Frequently asked questions
What is parts consumption analytics?
Analysis of which parts are used, on which vehicles, and why, to guide stocking and purchasing.
Which metric should we start with?
Stockout rate and parts-wait time, since they link directly to downtime.
How do we set reorder points?
Use average demand and supplier lead time, then add a buffer for critical parts.
Can we track parts by vehicle?
Yes. Start in Oxmaint to issue parts against work orders and assets.Can we see a sample workflow?
Yes. Book a demo for an inventory walkthrough.
Turn parts usage into smarter fleet purchasing
Connect inventory, work orders, and asset history to see where parts money goes.