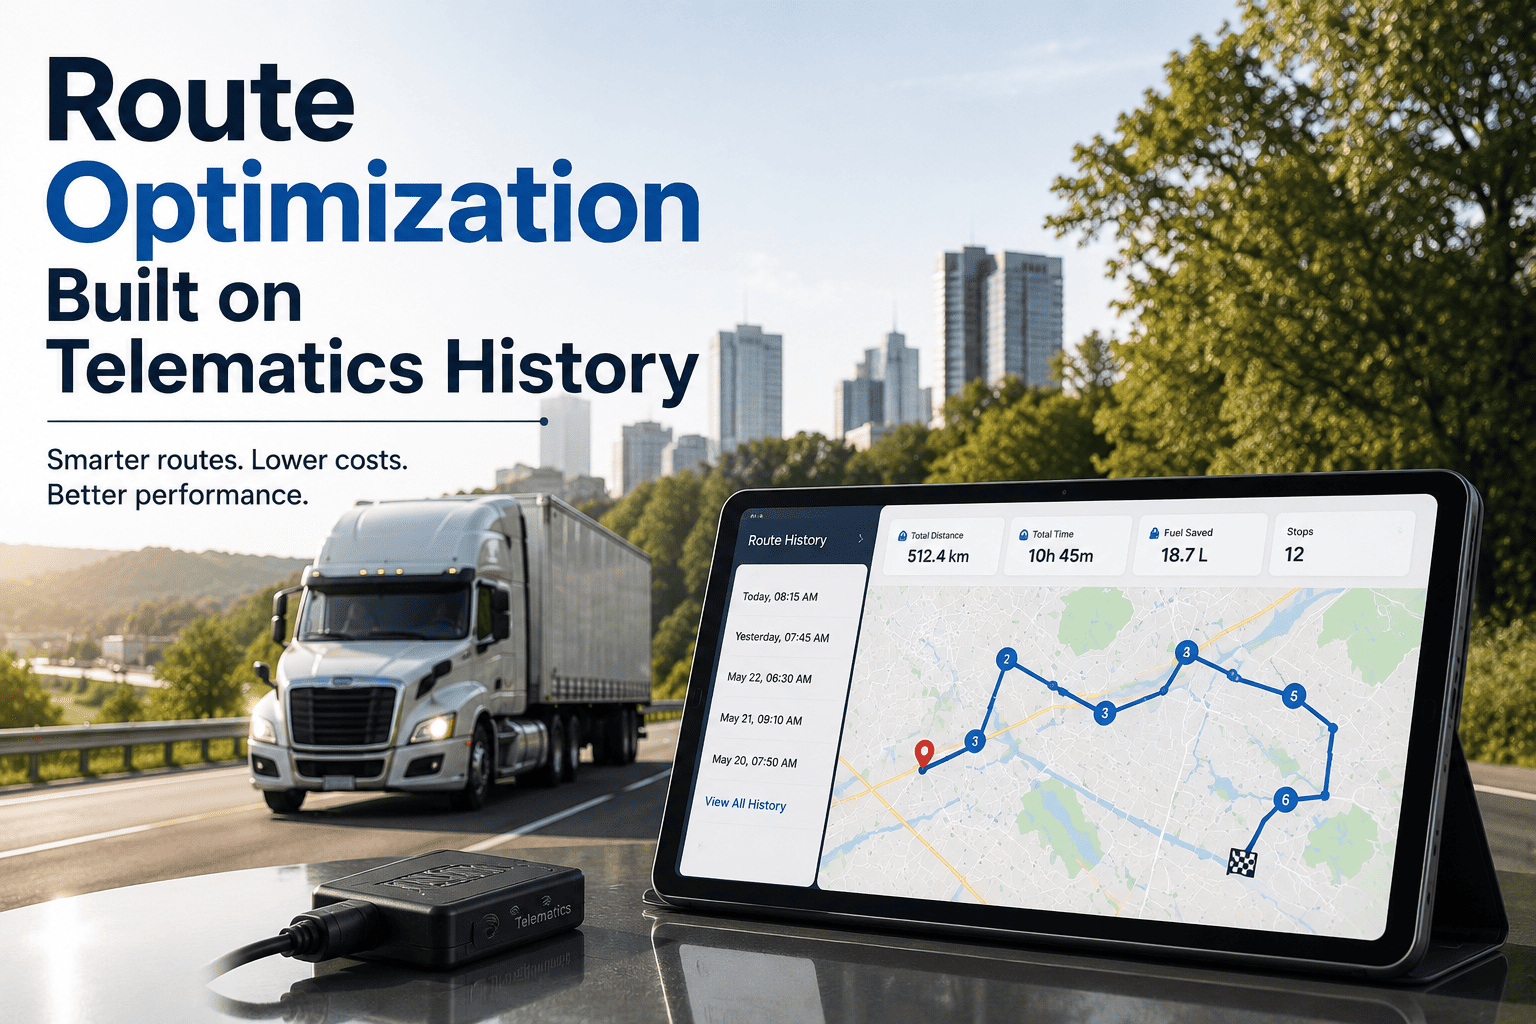
Route optimization built on telematics history does what Google Maps travel-time estimates never could — it plans routes against the actual conditions your fleet has driven through for months, not against an abstract average. Historical GPS traces, geofence dwell times, and per-vehicle fuel consumption feed directly into the planning engine, producing schedules a driver can actually run at the hour dispatch assigned them. The payoff is concrete: 8–12% lower fuel spend, 10–20% more stops per driver, and measurable reductions in brake, tire, and drivetrain wear. For a 50-truck last-mile fleet, route optimization typically pays for itself within 3–6 months on fuel alone — which is why most operators start a Start Free Trial before the next planning cycle begins.
Telematics Route Guide 2026
Can your routes actually run at the hour dispatch scheduled them?
Most routing tools plan against map-book averages. Real telematics history — months of GPS traces, geofence dwell times, and per-segment speed by time of day — lets you build routes that survive contact with Monday-morning traffic, customer time windows, and driver HOS limits.
The Input Stack
Six data signals that separate real routing from map-app routing
A turn-by-turn app tells you the shortest path right now. A telematics-built route plan tells you the path that will actually be fastest next Tuesday at 7:42 AM, given the dwell profile at stop four and the driver's remaining 70-minute HOS window. Here is what feeds that calculation.
Historical speed by segment, by time of day
Months of telematics traces collapse into a speed matrix: road segment × hour × day-type. The optimizer knows that I-95 northbound at 4:50 PM averages 31 mph, not the 55 mph a map API assumes.
Dwell time per customer
Geofence entry-to-exit timestamps produce a real distribution — not a 5-minute assumption. Stop 17 actually takes 14 minutes because the receiving dock checks every pallet.
Delivery time windows
Hard customer windows (9:00–11:00 AM) and soft preferences feed the constraint solver, so the plan respects the SLA before it minimizes miles.
Driver HOS availability
FMCSA hours-of-service limits — 11-hour driving, 14-hour on-duty, 30-minute break — are pulled live from the ELD so no route lands a driver in violation.
Vehicle capacity constraints
Cube, weight, axle limits, and refrigeration capacity cap each truck's load. The optimizer assigns stops to vehicles that can legally and physically carry them.
Driver-specific route preferences
Some drivers know a back-street cut-through the data has not captured yet. Route plans that respect learned driver preferences get adopted, not silently overridden.
The Savings Math
Where the 8–12% fuel cut actually comes from
Route optimization does not save fuel by finding a shorter line on a map. It saves fuel by eliminating the miles, idling, and stop-start cycles that never produced a delivery. The formula below is how most routing engines — Routific, OptimoRoute, Onfleet, or the modules inside Samsara and Motive — weight the objective.
Fewer total miles plus fewer bottleneck idle events. A 50-truck fleet burning 6,000 gal/week at $3.85 saves roughly $1,850–$2,770 weekly — $96K–$144K annualized.
Either more stops in the same shift, or the same stops in a shorter day. At 120 stops/driver/day, a 15% lift equals 18 extra stops — roughly 1.5 added routes worth of capacity per 10 drivers.
Fewer miles and less stop-start cycling reduce brake pad wear, tire scrub, and drivetrain stress. Real impact, but hard to attribute cleanly — it surfaces as a slower PM burn rate over 6–12 months.
Worked Example
A 50-truck last-mile fleet, six months in
The brief's headline number — payback in 3–6 months on fuel alone — deserves a worked example so the math is not abstract. Take a 50-truck last-mile delivery fleet running an average of 120 stops per driver per day across a metro area.
- Trucks50
- Diesel burned6,000 gal/week
- Fuel price$3.85/gal
- Weekly fuel spend$23,100
- Stops per driver/day120
- Fuel cut (10%)$2,310/week saved
- Stop lift (15%)+18 stops/driver/day
- Idle hours removed~38 hrs/week
- Annualized fuel savings$120,120
- Payback window3–6 months
The 10% fuel cut and 15% stop lift are mid-range, not best-case. Aggressive fleets running dense urban multistop routes have reported lifts above 20% — but only when historical telematics data is at least 90 days deep and the geofence library is clean.
The Rollout
From raw telematics to a route plan your drivers will actually run
Route optimization fails when it is treated as a software install. It succeeds when it is sequenced as a four-stage rollout — data first, plan second, driver third, variance fourth. Skipping stage one is the single most common reason fleets see no lift in month one.
Clean the telematics base
Confirm 90+ days of GPS pings per vehicle, audit geofence boundaries for every customer site, and validate dwell-time distributions. Bad geofences produce phantom 47-minute dwell times that wreck the optimizer.
Build the speed matrix
Collapse traces into segment × hour × day-type average speeds. Feed the matrix into the routing engine alongside capacity, HOS, and time-window constraints. Run shadow plans against live operations — do not dispatch yet.
Pilot with 6–8 drivers
Pick drivers who already run tight routes and will give honest feedback. Dispatch their plans from the optimizer, then compare executed vs. planned stops, miles, and fuel at the end of each week.
Scale and close the loop
Roll out fleet-wide. Executed route plans feed back into the engine for schedule variance analysis — planned vs. actual arrival, dwell overrun, and missed-window count. The matrix learns every week.
How Oxmaint Closes The Loop
Telematics in, executed plans back, maintenance informed
In Oxmaint, route optimization is not a separate tool — it runs through the same telematics spine that already tracks vehicle health. Historical drive data feeds the planning engine; executed plans feed back for variance analysis; and the maintenance side sees the miles and idle hours that drive PM scheduling.
Telematics history → planning
GPS pings, geofence events, and fuel data flow from the ELD/telematics provider into the route engine. No second data entry, no CSV exports, no stale averages.
Route plan → driver
The optimized plan — stops sequenced, windows respected, HOS-checked — goes to the driver mobile app. The driver sees turn-by-turn with real expected arrival times.
Executed plan → variance
Actual arrival, dwell, and idle feed back into Oxmaint for schedule variance analysis. Patterns surface: stop 7 always overruns by 11 minutes; the 4 PM I-95 segment always underperforms the matrix.
Variance → maintenance
Miles and idle hours from executed routes update PM triggers in Oxmaint — oil life, brake inspections, DPF regen intervals — so maintenance follows real operating stress, not a calendar guess.
Stop planning routes against map averages your fleet already disproves every day.
Connect your telematics feed, build the speed matrix, and run shadow plans against next week's dispatch in under 48 hours.
Frequently Asked
Route optimization on telematics history — the questions operators ask first
How much telematics history do I need before the optimizer produces useful plans?
A minimum of 90 days of clean GPS pings per vehicle, with geofence entry/exit events at every customer site. Below 90 days, the speed matrix is too sparse for off-peak hours and the optimizer falls back on map averages — which is exactly what you are trying to escape. Six months is the comfortable baseline; 12 months captures seasonal traffic shifts.
Does this replace Routific, OptimoRoute, Onfleet, Samsara, or Motive?
No — Oxmaint sits alongside them. The routing engine inside those tools does the solve; Oxmaint supplies the historical telematics data that makes the solve accurate, and then ingests the executed plan for schedule variance analysis and maintenance impact. Most fleets keep their existing routing tool and point it at richer Oxmaint-fed inputs.
How is the maintenance impact measured if it is hard to attribute cleanly?
Track three lagging indicators over 6–12 months: brake pad replacement frequency per 10,000 miles, tire tread wear rate per axle, and PM-interval variance (are you hitting PMs early or on schedule). A fleet that cut total miles 10% and idle hours 30% should see brake and tire burn rates slow within two PM cycles. You can start tracking this in a Start Free Trial alongside your existing maintenance logs.
What happens if a driver ignores the optimized route?
The executed route still feeds back into Oxmaint for variance analysis — planned vs. actual stops, miles, and arrival times. If drivers routinely override a specific segment, that is a signal the speed matrix is wrong for that corridor, or that a driver-only shortcut exists. Either the matrix gets corrected or the shortcut gets captured, and the next plan improves. Persistent off-route driving also flags for coaching.
How long until I see the 8–12% fuel savings?
Shadow plans in month two give you a directional number. The fuel cut becomes measurable in month three when the pilot group goes live, and defensible by month four once you have a full four-week baseline against pre-optimization fuel burn. Most 50-truck fleets see payback inside 3–6 months on fuel alone, before counting the stop-capacity lift. To see the rollout plan mapped to your fleet, Book a Demo and we will walk through the timeline.
Telematics Route Guide 2026
Your fleet has already driven every route you need to optimize.
Turn 90 days of telematics history into routes your drivers can actually run — fewer miles, more stops, lower fuel, and a maintenance schedule that follows real operating stress.
Free 14-day trial · No credit card




.png)