Vehicle age and downtime correlation is one of the most predictable — and most expensive — patterns in fleet management: as assets cross certain mileage and age thresholds, breakdown frequency and total cost per mile climb in a non-linear curve. Data from maintenance reliability studies shows that unplanned downtime events can increase by up to 40% once a vehicle passes year five of service, driven by wear-related failures in braking, suspension, and powertrain systems. Tracking downtime frequency against vehicle age across the fleet exposes the exact age threshold where breakdown risk spikes and replacement becomes cheaper than continued repair. With an AI-powered CMMS like OxMaint, reliability teams can see that threshold in real time and automate the age-based preventive maintenance that delays it — start your Start Free Trial to see your own age-downtime curve today.
At what vehicle age does downtime frequency spike?
Most fleets see a flat downtime rate in years 1–4, then a sharp inflection point at year 5–7 where breakdowns, tow bills, and rental costs compound. Identifying your fleet's age correlation threshold is the single highest-leverage data point for controlling total cost of ownership.
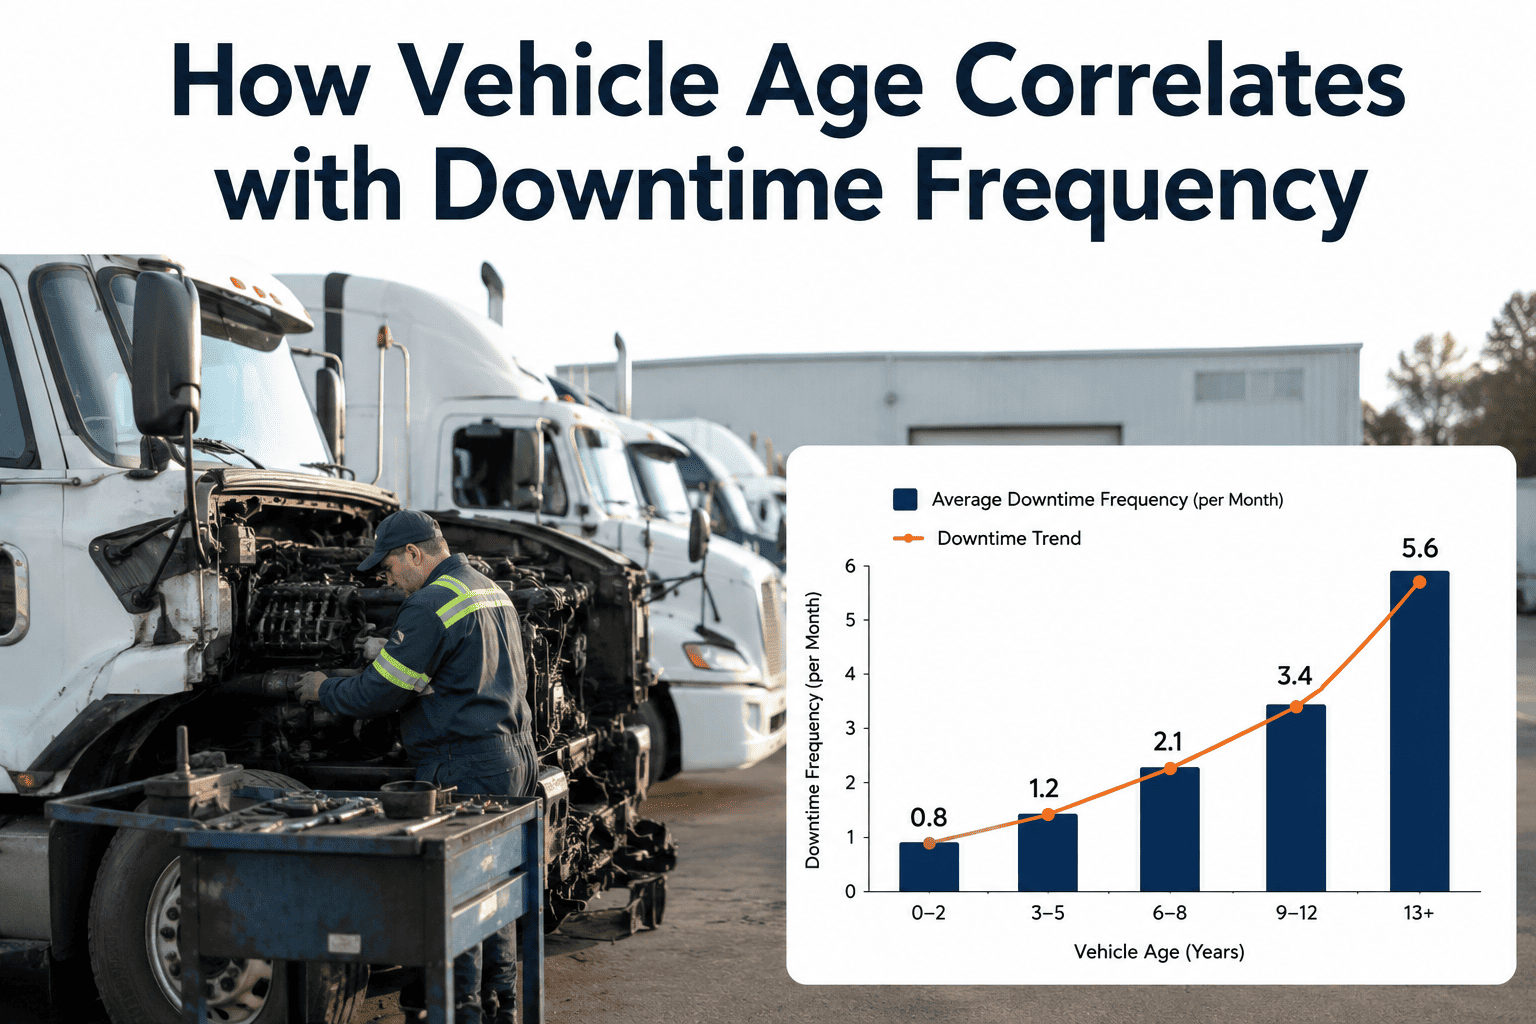
How vehicle age correlates with downtime frequency by year
The relationship between vehicle age and downtime is not linear — it follows an S-curve. The first three years are statistically the most reliable period in a vehicle's life, while years six through eight produce a compounding failure rate that catches most fleet managers off guard.
Warranty & Bed-in Period
Downtime events: 0.8 per vehicle/year
Breakdowns are rare and typically covered by OEM warranty. Predictive maintenance has limited value here; focus on adherence to the factory PM schedule and early-life defect logging.
Steady-State Operations
Downtime events: 1.5 per vehicle/year
Warranty expires. Wear items (brakes, tires, belts, hoses) drive scheduled downtime. Reactive events creep up. This is where a CMMS delivers the strongest ROI by enforcing PM compliance.
The Inflection Point
Downtime events: 3.1 per vehicle/year
Component fatigue accelerates. Transmission, engine, and suspension failures cluster. Unplanned downtime jumps 100%+ over Phase 2. Maintenance cost per mile often exceeds the vehicle's residual value.
Run-to-Failure Zone
Downtime events: 4.5+ per vehicle/year
Vehicles become net-negative assets. Every additional year of service increases downtime risk by roughly 15–20%. Most reliability teams begin aggressive age replacement cycling here.
The true cost of vehicle age: downtime, tows, and lost revenue
A single unplanned downtime event for a commercial vehicle costs an average of $448 to $760 per day in lost revenue, rental replacement, and emergency labor — before the repair bill. When older vehicles stack 3–4 events per year, the math overwhelmingly favors replacement.
A 50-vehicle delivery fleet with 12 trucks in the 7-year age bracket
These 12 trucks average 3.1 unplanned downtime events per year, each lasting 2.5 days. With daily revenue loss of $400 and rental replacement at $180/day, each event costs $1,450 in downtime alone — before parts and labor.
When to replace vs. repair: the fleet age threshold
The age replacement decision should be driven by data, not gut feel. The industry benchmark — aligned with ISO 55000 asset management principles — is to replace when annual maintenance cost exceeds 60–70% of the asset's residual market value, or when downtime frequency crosses 3 events per year.
| Vehicle Age | Avg Downtime Events/Yr | Maint. Cost per Mile | Recommended Action |
|---|---|---|---|
| 1–2 years | 0.8 | $0.09 | OEM PM schedule only |
| 3–5 years | 1.5 | $0.14 | Enforce CMMS-driven PM; begin condition monitoring |
| 6–8 years | 3.1 | $0.22 | Evaluate replacement; increase predictive inspections |
| 9+ years | 4.5+ | $0.31+ | Replace immediately; cost of ownership is net-negative |
Track vehicle age, predict downtime, and automate replacement decisions
OxMaint's AI-powered CMMS turns the age-downtime correlation from a retrospective report into a live, predictive dashboard — so you see the inflection point coming and act before the breakdown wave hits.
Asset age & downtime analytics
Automatically tracks every vehicle's age, mileage, and downtime history in one dashboard. Visualizes your fleet's age-downtime curve in real time so you spot the inflection point before costs spike.
Outcome: Identify high-risk vehicles 30–60 days earlierPredictive maintenance triggers
AI models learn each asset's failure patterns by age and usage, auto-generating work orders for inspections and component replacements before failures occur — not after a tow.
Outcome: Cut unplanned downtime 30–50%Replacement cost forecasting
Compares real-time maintenance spend against residual asset value and projected downtime cost, flagging vehicles that have crossed the 60% replacement threshold for capital planning.
Outcome: Right-time replacement saves $4K–$8K per assetFMCSA-ready compliance & audit trail
Every PM, inspection, and repair is logged with timestamped digital records. Age-based inspection schedules are enforced automatically, keeping aging assets compliant with FMCSA and DOT requirements.
Outcome: Pass audits with zero manual paperworkSee your fleet's age-downtime curve before it costs you
Book a 30-minute demo and we'll map your vehicle ages against downtime history live — showing you exactly which assets are approaching the breakdown threshold.
Common questions about vehicle age and downtime correlation
At what vehicle age does downtime frequency increase the most?
Downtime frequency increases most sharply between years 5 and 7, when most commercial vehicles cross 300,000–500,000 miles. This is the inflection point where wear-related failures in major systems (engine, transmission, suspension) begin compounding, and unplanned events can jump from 1.5 to 3+ per year. Tracking this curve in a CMMS like OxMaint lets you see it coming and schedule replacements proactively — Book a Demo to see how.
How is vehicle age downtime correlation calculated?
The correlation is calculated by plotting unplanned downtime events per vehicle per year against the vehicle's age in years or miles. A regression analysis or simple moving average reveals the slope — typically flat for years 1–4, then steepening after year 5. Most fleet maintenance platforms can generate this report automatically; OxMaint displays it as a live dashboard updated with every work order.
What is the optimal replacement age for fleet vehicles?
The optimal replacement age is when annual maintenance cost plus downtime cost reaches 60–70% of the vehicle's residual market value — typically year 6–8 for light-duty fleets and year 8–10 for heavy-duty. Beyond that point, every additional year of service costs more in repairs and lost productivity than the depreciation saved by holding the asset. OxMaint's replacement forecasting module calculates this threshold automatically for every vehicle.
Can preventive maintenance extend the age threshold before downtime spikes?
Yes — strong PM compliance can push the inflection point back by 1–2 years. Fleets that enforce age-based inspections, oil analysis, and component replacement at 80% of expected life typically see downtime frequency stay below 2 events/year through year 6. The key is enforcing the schedule consistently, which is why CMMS-driven automated work orders outperform spreadsheet-based maintenance by a wide margin.
How much does unplanned downtime cost per aged fleet vehicle?
Unplanned downtime for a commercial vehicle costs $448–$760 per day in lost revenue, rental replacement, and emergency labor, before the repair itself. A vehicle in the 7+ year age bracket averaging 3 downtime events per year at 2.5 days each incurs $3,360–$5,700 in downtime cost alone — often more than the annual depreciation of a new replacement. You can calculate your exact exposure with a free Start Free Trial of OxMaint.
Stop guessing. Start predicting your fleet's downtime.
OxMaint maps every vehicle's age against real downtime history, predicts failures before they happen, and tells you exactly when to replace — so you cut unplanned downtime 30–50% and eliminate reactive maintenance for good.
Free 14-day trial · No credit card