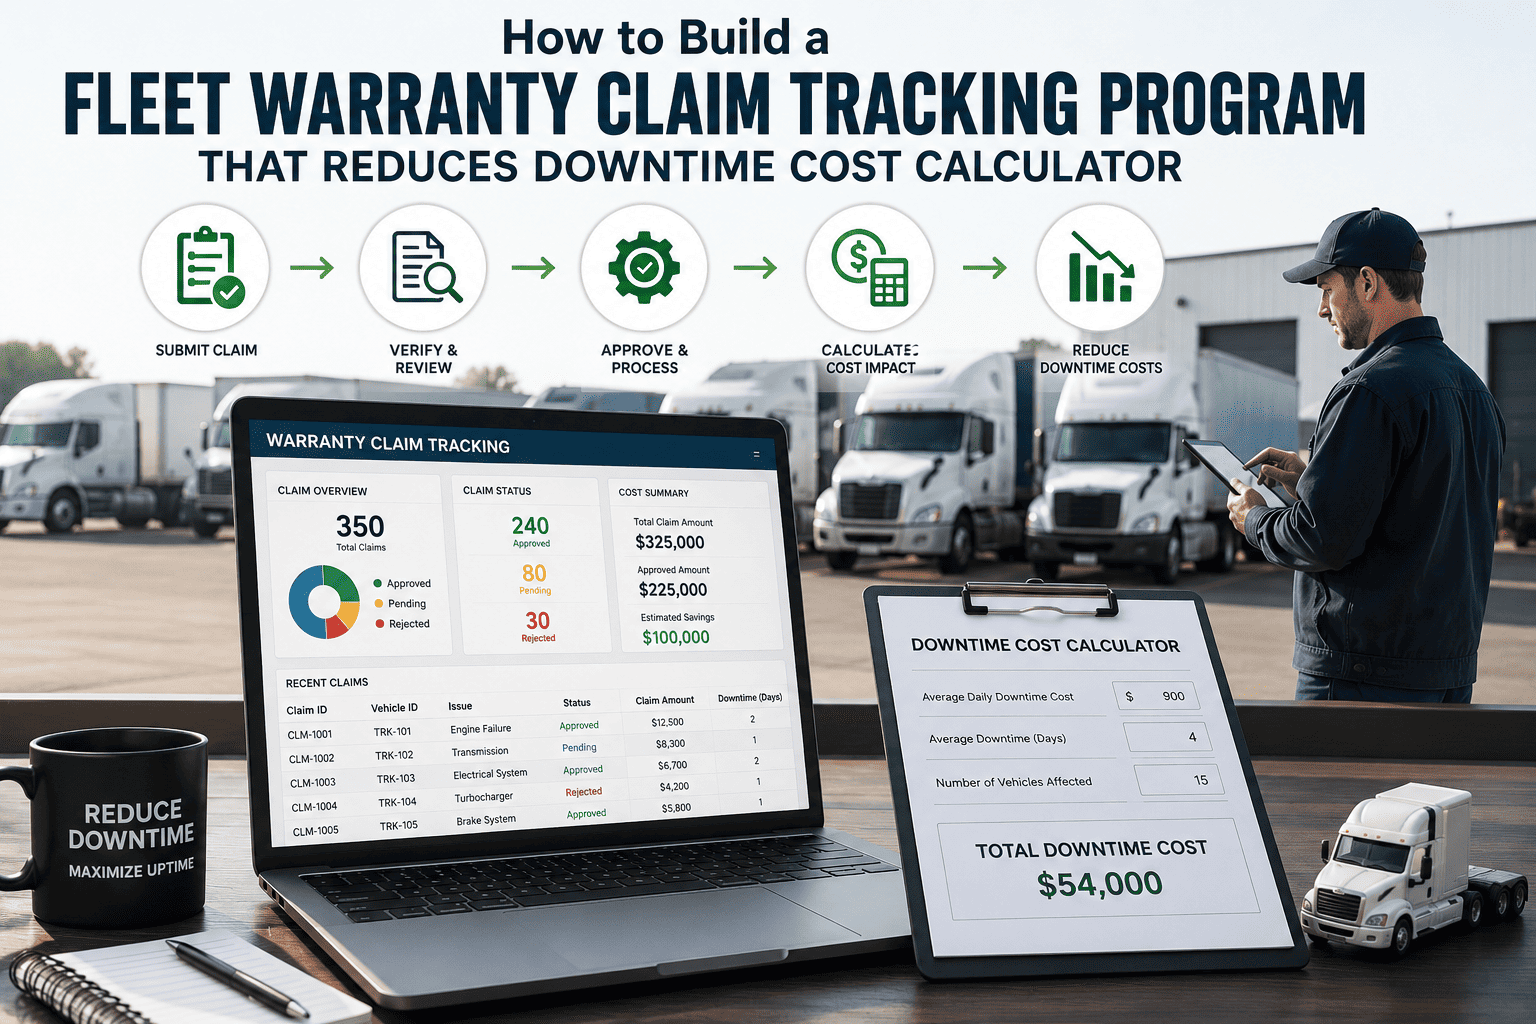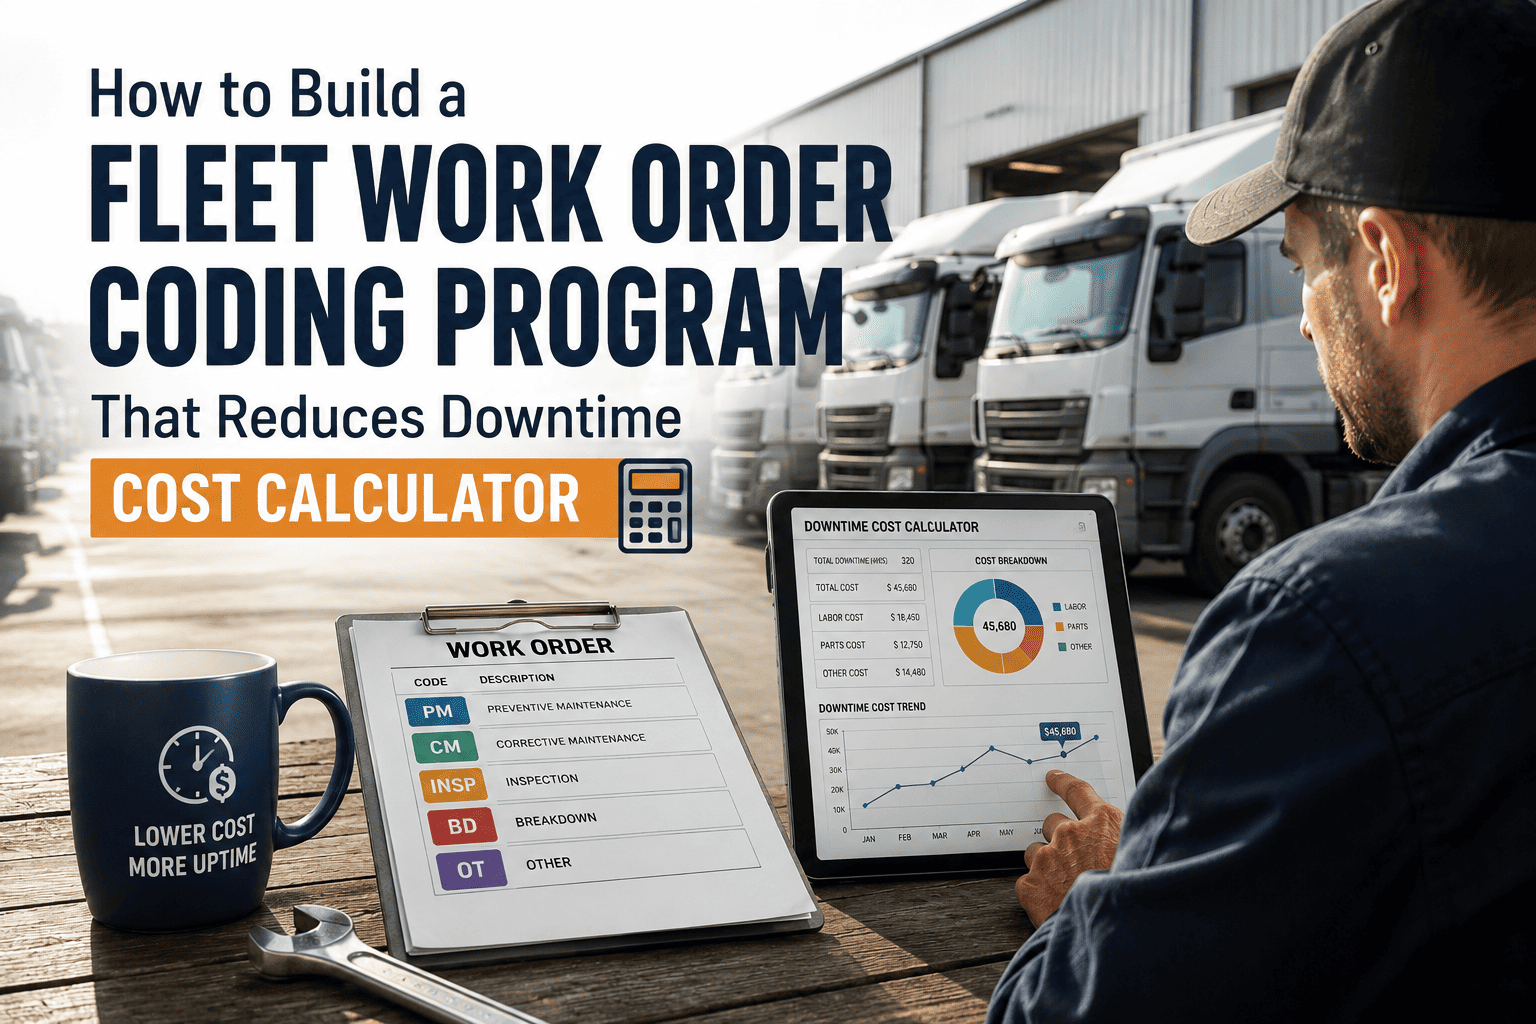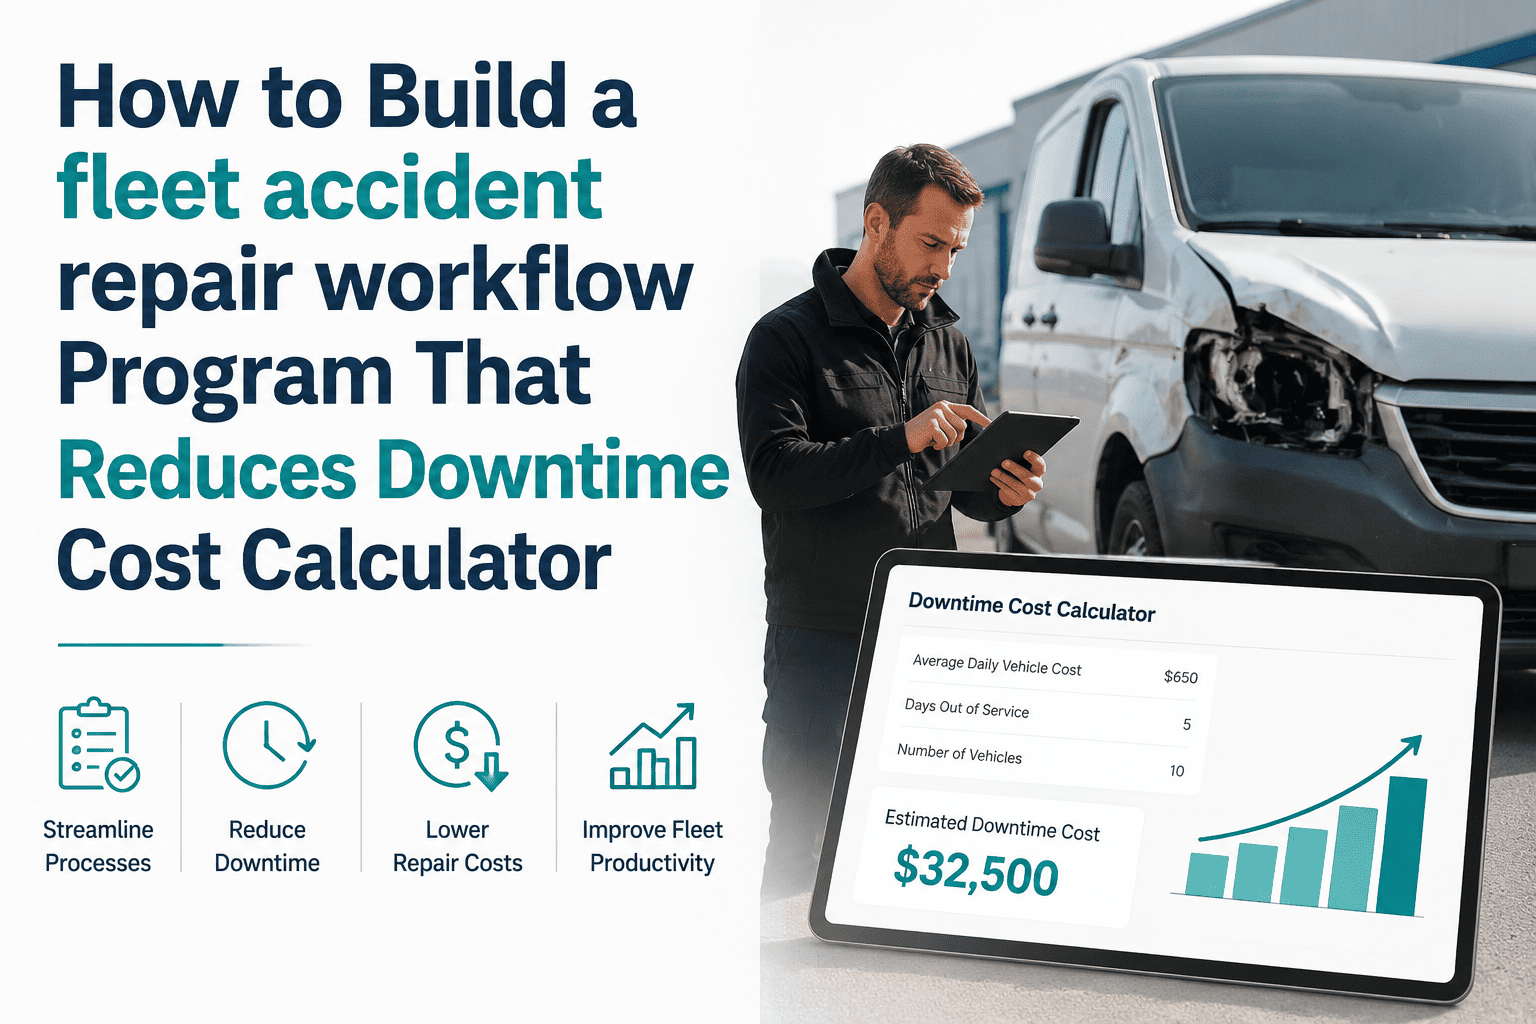
A vehicle sitting idle in a repair bay looks like it is costing nothing, since no fuel is burning and no parts are being ordered. That impression is exactly why downtime is one of the most underestimated costs in fleet operations — the damage is happening in missed deliveries, idle drivers, rerouted work, and customer service penalties that never show up on a repair invoice. Building a downtime cost calculator framework forces those hidden costs into the open, and once a fleet manager sees the real number attached to an hour of downtime, maintenance investment decisions start to look very different. This guide breaks down how to calculate the true cost of fleet downtime by vehicle type, where the biggest impact sits, and how a system like Oxmaint helps shrink that number through better preventive planning.
Fleet Downtime Cost Calculator Framework: Maintenance Impact by Vehicle
A structured way to calculate what an hour of vehicle downtime actually costs, broken down by vehicle type, so maintenance investment can be justified with real numbers instead of guesswork.
Why Downtime Cost Is Usually Underestimated
Most fleets can tell you what a repair invoice cost. Far fewer can tell you what the downtime around that repair cost, because the expenses are scattered across dispatch, customer service, driver payroll, and lost revenue rather than sitting in one line item on a maintenance report.
Building the Downtime Cost Formula
A usable downtime cost calculator does not need to be complex, but it does need to account for every category of cost that accumulates while a vehicle is off the road rather than just the repair bill.
Step-by-Step: Calculating Cost for a Single Downtime Event
Downtime Impact Varies Significantly by Vehicle Type
Not every vehicle in a mixed fleet carries the same downtime cost. A specialized or high-utilization vehicle going down tends to cost far more per hour than a lightly used backup unit, which matters directly when prioritizing preventive maintenance budget.
| Vehicle Type | Primary Downtime Driver | Relative Cost Impact | Mitigation Priority |
|---|---|---|---|
| Last-Mile Delivery Van | Missed delivery windows, customer SLA exposure | High during peak season | Preventive PM before seasonal demand spikes |
| Long-Haul Tractor | Lost revenue per day out of service, driver idle time | High per incident | Predictive component monitoring on drivetrain and engine |
| Refrigerated Truck | Spoiled or rejected load if reefer unit fails | Very high when cargo is lost | Dedicated reefer inspection schedule |
| Service or Utility Vehicle | Missed appointment windows, rescheduling cost | Moderate to high | Spare vehicle pool sized to fleet demand |
| Backup or Spare Vehicle | Low utilization limits direct revenue impact | Low | Standard preventive schedule, lower priority |
Turn Downtime Into a Number Finance Can Act On
Oxmaint tracks downtime start and end times against every work order, so the true cost of a repair — not just the invoice — becomes visible per vehicle and per incident.
Root Causes That Drive Downtime Costs Higher
Downtime cost is rarely random. It clusters around a small set of recurring causes that, once identified, become the clearest targets for preventive maintenance investment.
Before and After: What Changes When Downtime Is Actively Managed
Using the Downtime Number to Justify Preventive Maintenance Spend
One of the most practical uses of a downtime cost calculator is building the business case for preventive maintenance investment that might otherwise be deferred as a discretionary cost. When downtime cost per hour is quantified, the comparison against the cost of a scheduled inspection or early part replacement becomes straightforward.
This is also where asset-level history matters: a vehicle with three downtime events tied to the same component in six months is telling a very specific story, and that story is only visible if downtime and repair records are connected in one system rather than split across paper logs and separate spreadsheets.
Frequently Asked Questions
Downtime should be measured from the moment a vehicle is taken out of service until it is confirmed roadworthy and redispatched, including diagnostic and parts-waiting time, not just active repair time.
Yes, if the driver remains on payroll without reassignment during the downtime window, since that cost accrues regardless of whether the vehicle is moving.
High-utilization or specialized vehicles, such as refrigerated trucks or long-haul tractors, typically carry a much higher downtime cost per hour than lightly used backup vehicles.
It is one of the strongest justifications available, since a quantified downtime figure makes the comparison against preventive maintenance cost direct and defensible. Book a demo to see downtime reporting in Oxmaint.
By tying preventive maintenance scheduling, parts inventory, and repair history to each asset, a CMMS reduces both the frequency and duration of downtime events. Sign up to start tracking downtime automatically.
Stop Absorbing Downtime Costs You Can't Even See
Oxmaint connects downtime tracking, work orders, and asset history so every hour a vehicle is off the road has a real, calculable cost attached to it.