Compressed air accounts for 12% to 18% of total energy consumption in FMCG manufacturing facilities—yet up to 35% of that energy is wasted through system inefficiencies, leaks, and poor maintenance practices. For a mid-sized food processing plant running four 200 HP compressors, that translates to $127,000 in annual wasted electricity. The solution is not capital-intensive equipment replacement—it's systematic maintenance, leak detection, and intelligent scheduling. This guide shows exactly how to reduce compressed air energy costs by 25% to 40% through proven maintenance strategies. Want to optimize your compressed air operations? Start a free trial to track compressor performance and automate leak detection workflows, or book a demo to see how real-time monitoring cuts energy waste.
FMCG Energy Optimization
Compressed Air System Maintenance for FMCG Energy Savings
Cut Energy Costs by 25-40% Through Systematic Leak Detection, Pressure Optimization, and Intelligent Compressor Scheduling
12-18%
Of plant energy consumed by compressed air
35%
Typical energy waste in unoptimized systems
$127K
Annual waste for 4×200HP compressors
25-40%
Energy reduction through proper maintenance
Stop Wasting Energy on Compressed Air
Track compressor efficiency, automate leak detection workflows, and optimize pressure setpoints across your entire FMCG operation. Oxmaint connects to your existing pressure sensors and flow meters to give you real-time visibility into energy waste.
Why Compressed Air Is FMCG's Most Expensive Utility
Compressed air powers conveyor systems, pneumatic actuators, product packaging, mixing processes, cleaning applications, and material transfer across every FMCG production line. Unlike electricity or natural gas where inefficiency shows up as wasted kilowatt-hours, compressed air waste hides in plain sight: small leaks at connection points, slightly elevated pressure setpoints, compressors running unloaded for hours, and filters that haven't been changed in months. Each inefficiency compounds the others, creating a system that consumes vastly more energy than necessary to deliver the required air volume. The core problem is that compressed air generation converts electrical energy at roughly 10% to 15% efficiency—meaning every cubic foot of wasted air represents seven times that energy loss at the compressor. Discover how proactive maintenance transforms this equation by implementing systematic tracking or schedule a session to review your current air system configuration.
Reactive Maintenance Approach
✕
Leaks detected only when audible or causing pressure drops severe enough to affect production
✕
Pressure setpoint raised to compensate for leaks rather than fixing the root cause—compounding energy waste
✕
Compressors run in baseload mode regardless of actual demand variation throughout shift schedules
✕
Filter changes based on calendar intervals, not actual pressure differential readings
✕
No correlation between compressed air consumption and production output metrics
✕
Annual energy waste: $127,000 for typical four-compressor installation
Preventive Maintenance System
✓
Ultrasonic leak detection surveys conducted quarterly, with every identified leak tagged and repaired within 48 hours
✓
Pressure maintained at minimum required setpoint—each 1 PSI reduction saves 0.5% energy across the system
✓
Compressor sequencing based on real-time demand, with automated start-stop control tied to production schedules
✓
Filter maintenance triggered by actual differential pressure sensors—replaced only when needed, preventing energy loss from restriction
✓
SCFM per production unit tracked continuously, establishing baseline efficiency for continuous improvement
✓
Energy savings: $45,000 to $51,000 annually through systematic optimization
The Six Maintenance Strategies That Cut Compressed Air Energy Costs
Energy reduction in compressed air systems does not come from a single intervention—it emerges from six interconnected maintenance practices executed consistently. Each strategy addresses a specific inefficiency vector, and the compounding effect delivers the 25% to 40% energy reduction achievable in most FMCG facilities. These are not theoretical recommendations—they represent the operational playbook used by beverage bottling plants, snack food manufacturers, and dairy processing facilities that have documented their compressed air energy costs dropping by six figures annually. Ready to implement these strategies in your facility? Start tracking your air system performance or schedule a walkthrough of your current maintenance gaps.
01
Systematic Leak Detection and Repair
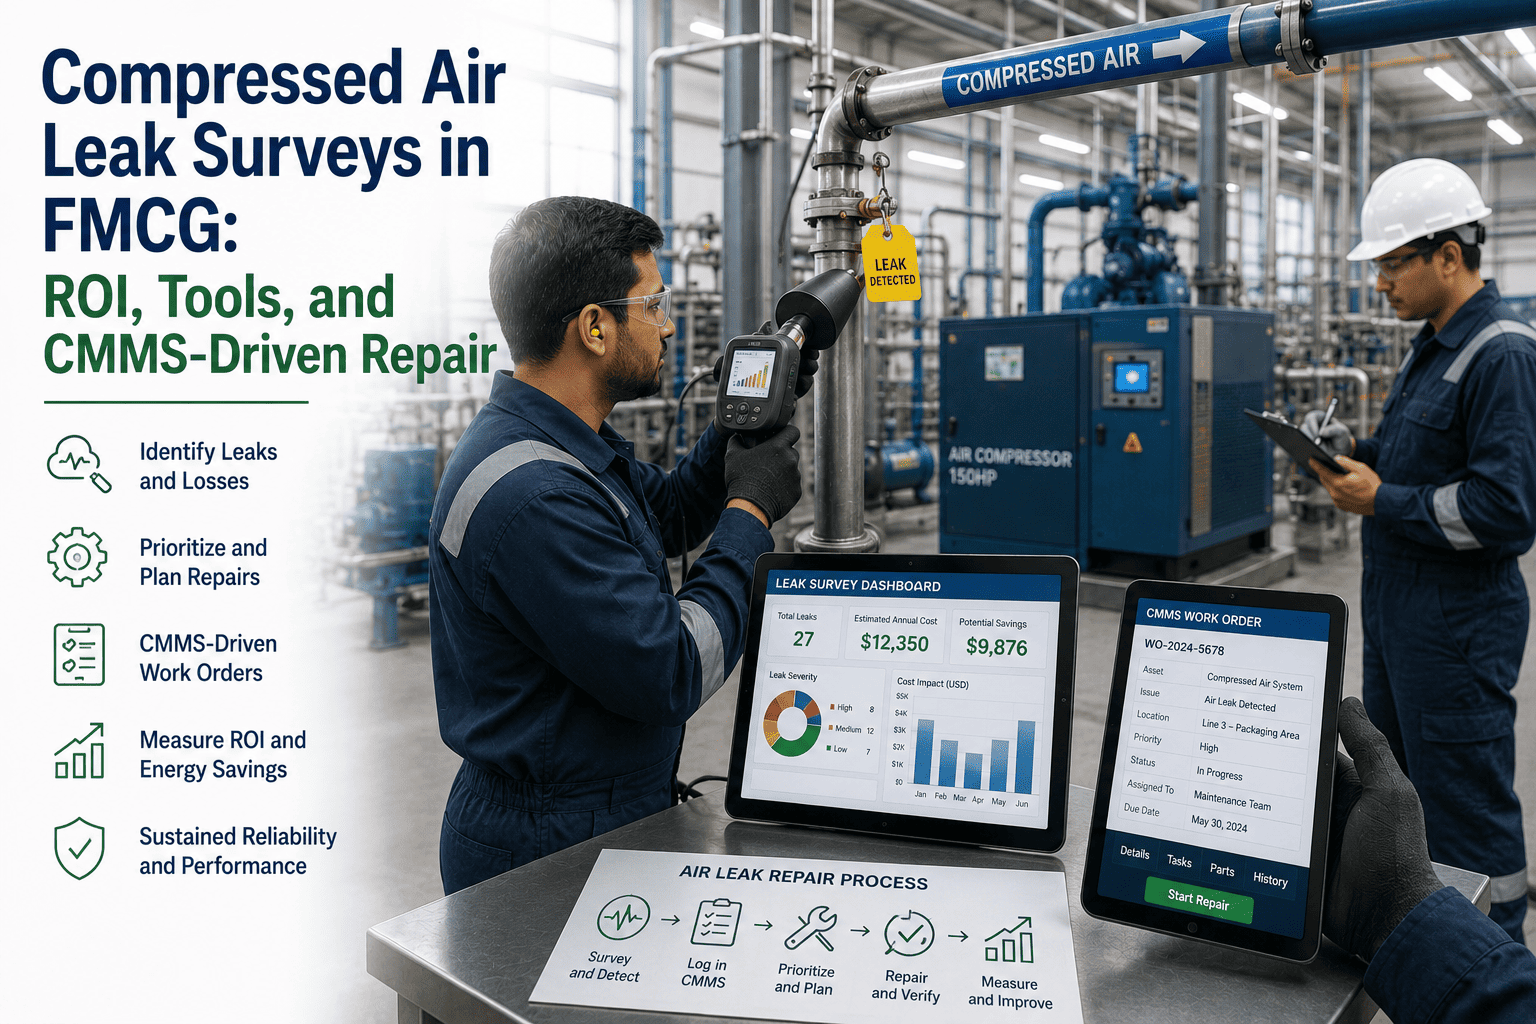
Deploy ultrasonic leak detectors on a quarterly survey schedule covering every compressed air line, connection point, and end-use device. A 1/8-inch leak at 100 PSI wastes 32 CFM—costing $2,600 annually in electricity. Typical FMCG facilities have 15 to 40 undetected leaks at any given time. Tag every leak immediately upon detection, assign repair work orders with priority based on CFM loss, and close the loop within 48 hours. Annual savings from leak elimination alone: $18,000 to $34,000 for mid-sized plants.
02
Pressure Optimization and Setpoint Management
Most FMCG compressed air systems run at 90 to 110 PSI when actual end-use requirements are 85 to 95 PSI. Every 2 PSI reduction in system pressure reduces compressor energy consumption by approximately 1%. Audit every pneumatic device to determine its minimum required pressure, then set system pressure 5 PSI above the highest requirement. Install pressure regulators at high-demand zones. Lowering system pressure from 105 PSI to 95 PSI on a 200 HP compressor saves $4,200 annually per compressor.
03
Intelligent Compressor Sequencing and Load Management
Replace manual compressor start-stop decisions with automated sequencing controls that match compressed air supply to real-time demand. Install flow meters and pressure sensors at key distribution points. Configure lead-lag-trim compressor control: one baseload unit handles minimum demand, a secondary unit covers normal production load, and a trim compressor handles peak demand spikes. Shut down compressors during non-production hours—a 200 HP compressor running unloaded still consumes 25% to 35% of full-load power. Annual savings from sequencing optimization: $12,000 to $22,000.
04
Filter and Separator Maintenance Based on Differential Pressure
Clogged intake filters, coalescing filters, and oil-water separators create backpressure that forces compressors to work harder for the same air output. Install differential pressure gauges across all filtration points. Replace intake filters when differential exceeds 3 PSI, coalescing filters at 5 PSI differential, and oil separators at 10 PSI. Calendar-based replacement either wastes filters or allows excessive energy loss—condition-based replacement optimizes both cost and efficiency. Energy penalty from neglected filters: 8% to 15% on affected compressors.
05
Heat Recovery and Cooling System Efficiency
Compressors convert 80% to 90% of electrical input into waste heat. Recover this heat for facility space heating, process water preheating, or boiler feedwater warming where applicable—particularly valuable in food processing operations requiring hot water. On the cooling side, clean compressor intercoolers and aftercoolers monthly to maintain heat rejection efficiency. Fouled heat exchangers force higher discharge temperatures, reducing volumetric efficiency and increasing energy consumption by 3% to 6%.
06
Demand-Side Reduction Through End-Use Optimization
Eliminate inappropriate compressed air usage: open-tube blowoffs for product cleaning, pneumatic mixing where electric motors would be more efficient, and continuous purge applications that could be intermittent. Replace high-pressure blowoff nozzles with engineered low-pressure Venturi nozzles—reducing air consumption by 30% to 60% per application. Shut off compressed air supply to unused production lines and weekend-idle equipment. Demand reduction strategies often deliver 10% to 20% total system capacity relief.
Real-World Results: Beverage Bottling Plant Case Study
A 240,000 square foot beverage bottling facility running three production lines with five compressors totaling 850 HP implemented the six-strategy compressed air maintenance program over six months. Prior to intervention, annual compressed air energy costs were $186,400 based on $0.11 per kWh electricity rate. The maintenance team conducted baseline measurements, identified improvement opportunities, and executed corrective actions in a phased approach. After twelve months of systematic optimization, annual energy costs dropped to $118,200—a reduction of $68,200 per year representing 36.6% savings. The payback period for ultrasonic leak detection equipment, pressure optimization hardware, and automated sequencing controls was 8 months. Here's exactly what they did and the measurable impact of each intervention, structured to provide clear replication guidance for similar facilities. Explore how CMMS tracking enabled this transformation or discuss your plant's specific setup.
Month 1-2
Baseline Measurement and Leak Detection
Installed flow meters on each compressor discharge and main distribution headers. Conducted comprehensive ultrasonic leak survey identifying 28 leaks totaling 187 CFM of wasted capacity. Tagged each leak with unique ID, estimated CFM loss, and repair priority. Mapped compressed air distribution system to identify pressure drop zones. Baseline energy consumption: 1,694,545 kWh annually.
Result: Full system visibility established, waste quantified at 22% of total capacity
Month 3
Leak Repair and Pressure Reduction
Repaired all 28 identified leaks over 4-week period using scheduled downtime windows and line changeovers. Reduced system pressure setpoint from 108 PSI to 98 PSI after confirming all end-use devices functioned properly at lower pressure. Installed additional pressure regulators at three high-consumption zones. Energy consumption dropped to 1,525,000 kWh annually—10% reduction from baseline.
Result: $18,650 annual savings from leak elimination and pressure optimization
Month 4-5
Compressor Sequencing and Filter Optimization
Installed automated compressor sequencing controller with production schedule integration. Configured lead-lag operation with automatic shutdown during non-production periods—previously two compressors ran 24/7 regardless of demand. Replaced all intake filters and separator elements showing high differential pressure. Implemented condition-based filter replacement protocol using installed pressure sensors. Energy consumption dropped to 1,372,000 kWh annually—19% further reduction.
Result: Additional $29,830 annual savings from intelligent load management
Month 6
Demand Reduction and Heat Recovery
Replaced 14 open-pipe blowoff nozzles with engineered Venturi nozzles reducing air consumption by 42% per application. Installed solenoid valves on packaging line purge applications converting from continuous to intermittent operation. Connected compressor cooling water discharge to CIP system preheating loop. Final energy consumption stabilized at 1,074,545 kWh annually—36.6% total reduction from baseline.
Result: Final $19,720 annual savings plus $6,200 from reduced hot water heating costs
Total Annual Energy Savings
$68,200
36.6% reduction in compressed air electricity costs
Implementation Investment
$44,800
Equipment, controls, and maintenance labor
Simple Payback Period
8 months
ROI: 152% in first year of operation
Ongoing Maintenance Cost
$8,400/yr
Quarterly leak surveys and filter optimization
How to Measure Compressed Air System Efficiency
You cannot optimize what you do not measure. Compressed air energy efficiency requires three key performance indicators tracked continuously: specific power consumption measured in kW per 100 CFM of output, system leak rate expressed as percentage of total capacity, and load factor showing the ratio of productive air delivery to total compressor runtime. These metrics establish your baseline, reveal improvement opportunities, and validate the financial impact of maintenance interventions. Most FMCG facilities lack the metering infrastructure to calculate these KPIs—which is why compressed air remains the most energy-inefficient utility in the plant despite consuming 12% to 18% of total electricity. Installing the right sensors and tracking the right data transforms compressed air from an invisible energy drain into a managed, optimized system. Use Oxmaint's CMMS platform to centralize this data or discuss sensor integration options for your existing infrastructure.
Specific Power (kW per 100 CFM)
Formula: (Total Compressor kW Input) ÷ (System Output in CFM) × 100
Industry Benchmark: 16-19 kW/100 CFM for rotary screw compressors at full load
Measure compressor electrical input using power meters. Measure air output using thermal mass flow meters on discharge headers. Calculate hourly and track trends over time. Specific power creeping upward indicates developing maintenance issues: fouled coolers, worn compression elements, or elevated intake temperatures.
System Leak Rate (%)
Formula: (Air Flow During Non-Production Hours) ÷ (Average Production Air Flow) × 100
Acceptable Target: Under 10% | Typical Unmanaged Systems: 25-35%
Measure total system air flow during a period when all production equipment is shut down but compressors remain running to maintain pressure. Any flow during this period represents leaks and inappropriate uses. Compare to average flow during production. Leak rates above 10% indicate immediate survey and repair requirements. Systems above 25% are wasting significant energy and likely masking the problem by running excess compressor capacity.
Compressor Load Factor
Formula: (Loaded Hours) ÷ (Total Runtime Hours)
Optimal Range: 85-95% | Poor Performance: Below 70%
Track loaded hours vs. unloaded hours from compressor control systems or motor current sensors. Low load factors indicate oversized compressor capacity, poor sequencing control, or artificial demand from leaks forcing excess compressor runtime. Compressors running below 70% load factor consume 40% to 60% of full-load power while delivering minimal useful air—pure energy waste. Address through compressor downsizing, improved sequencing, or leak elimination.
Pressure Band Stability
Measure: Maximum Pressure Swing During Production Cycle
Target: ±3 PSI variation | Excessive: ±8 PSI or greater
Install pressure transducers at key distribution points and log data continuously. Wide pressure swings indicate inadequate receiver capacity, poorly tuned compressor controls, or sudden demand spikes that could be buffered through receiver sizing. Pressure instability forces operators to set higher average pressure to prevent low-pressure events—wasting energy. Stable pressure allows minimum-required setpoint operation.
SCFM per Production Unit
Formula: (Total Compressed Air Consumption) ÷ (Units Produced)
Establish Internal Baseline, Then Track Improvement Over Time
Correlate compressed air usage with production output to create normalized efficiency metric independent of production volume changes. Calculate SCFM per case packed, SCFM per pallet, or SCFM per batch depending on your production metric. Track weekly and monthly. Increases indicate developing leaks or equipment issues. Decreases validate improvement efforts. This metric makes compressed air efficiency visible to operations and production teams who control equipment usage.
Energy Cost per CFM
Formula: (Monthly Compressor Electricity Cost) ÷ (Total CFM Delivered)
Typical Range: $0.08-$0.14 per CFM-year at $0.10/kWh electricity
Calculate monthly energy cost by multiplying compressor kWh consumption by blended electricity rate. Divide by average CFM output. Track over time to quantify financial impact of efficiency improvements. Use this metric to justify maintenance investments: every 100 CFM of leak elimination saves $8 to $14 per year in electricity. Makes the business case for compressed air optimization visible to plant management and finance teams.
Common Compressed Air Maintenance Mistakes That Waste Energy
Even facilities with dedicated maintenance teams make predictable errors that undermine compressed air efficiency. These mistakes are not the result of negligence—they stem from incomplete understanding of compressed air thermodynamics, reliance on legacy practices that predate energy cost concerns, and misalignment between maintenance scheduling and actual system condition. Recognizing these patterns allows immediate correction and prevents compounding waste over time. If you want to audit your current practices against this checklist, schedule a compressed air system review or implement condition-based maintenance tracking to eliminate these inefficiencies.
Mistake #1
Increasing Pressure Instead of Fixing Leaks
When system pressure drops due to accumulated leaks, the intuitive response is raising compressor discharge setpoint to restore pressure at end-use points. This creates a vicious cycle: higher pressure increases leak rate exponentially—a leak at 110 PSI loses 30% more air than the same leak at 90 PSI. The correct response is systematic leak detection and repair, not pressure escalation. Energy penalty: 5% to 7% additional consumption for every 10 PSI pressure increase.
Mistake #2
Calendar-Based Filter Changes Regardless of Condition
Changing filters every 3,000 hours or six months regardless of actual differential pressure wastes money when filters are replaced prematurely and wastes energy when clogged filters remain in service beyond optimal change point. Install differential pressure gauges and replace filters based on actual restriction. A filter showing 8 PSI differential pressure creates backpressure equivalent to 4% compressor capacity loss—yet the filter itself may cost only $120. Replace when conditions warrant, not by calendar.
Mistake #3
Running Compressors 24/7 for Instantaneous Demand Response
Facilities often run compressors continuously including nights and weekends to ensure immediate air availability when production restarts—but compressors running unloaded consume 25% to 35% of full-load power while delivering zero productive output. Install receiver capacity and automatic restart controls to shut down compressors during idle periods. A 200 HP compressor running unloaded for 60 hours per week wastes $18,500 annually in electricity that could be eliminated through proper control sequencing.
Mistake #4
Neglecting Cooler and Heat Exchanger Cleaning
Compressor intercoolers and aftercoolers accumulate dust, oil residue, and airborne contaminants that reduce heat transfer efficiency. Elevated discharge temperatures reduce volumetric efficiency—hot air is less dense, delivering fewer molecules per cubic foot of displacement. Monthly cleaning of cooler fins and heat exchanger surfaces maintains optimal performance. Fouled coolers can increase discharge temperature by 15°F to 25°F, reducing actual air delivery by 3% to 5% while consuming the same electrical input.
Mistake #5
Using Compressed Air for Inappropriate Applications
Compressed air is the most expensive form of energy in the facility—yet it is frequently used for applications where alternatives would be more efficient: open-tube blowoffs for debris removal, cooling electronic panels, pneumatic mixing where electric motors would suffice, and continuous purging where intermittent operation is adequate. Audit all compressed air end uses and eliminate inappropriate applications. Replacing a single open-pipe blowoff with a low-pressure Venturi nozzle can save $800 to $1,400 per year.
Mistake #6
Ignoring Small Leaks Because They Are Not Audible
Many leaks are inaudible in a noisy production environment but still waste significant energy. A 1/16-inch leak at 100 PSI loses 6.5 CFM—small enough to be silent, large enough to cost $530 annually in electricity. Ultrasonic leak detectors identify leaks by frequency signature, not sound volume, revealing dozens of energy-wasting leaks that would otherwise remain undetected. Systematic ultrasonic surveys should be conducted quarterly regardless of whether leaks are audible.
Implementation Roadmap: 90-Day Compressed Air Optimization Plan
Transforming compressed air energy efficiency does not require a multi-year capital project. Most facilities can achieve 20% to 30% energy reduction within 90 days through systematic execution of the strategies outlined in this guide. The key is structured implementation: baseline measurement first, high-impact corrections second, and ongoing optimization third. This roadmap provides the specific action sequence that delivers measurable results in the shortest timeframe while building organizational capability for continuous improvement. Track progress and work order completion using digital maintenance management or get expert guidance by booking a consultation call.
Install power meters on all compressor electrical feeds to measure actual kW consumption
Install flow meters on compressor discharge headers to track CFM output
Install pressure transducers at 4-6 key distribution points across the facility
Log one week of baseline data at 15-minute intervals
Calculate baseline specific power, leak rate during non-production hours, and compressor load factors
Map compressed air distribution system identifying all major usage points
Deliverable: Baseline energy consumption report quantifying current waste and improvement opportunities
Conduct comprehensive ultrasonic leak detection survey covering entire compressed air system
Tag and photograph each identified leak with estimated CFM loss and GPS location
Execute leak repairs in priority sequence starting with largest CFM losses
Reduce system pressure setpoint by 5-10 PSI after confirming end-use compatibility
Replace all filters showing excessive differential pressure
Clean all compressor coolers and heat exchangers
Deliverable: 15-25% energy reduction from leak elimination and pressure optimization
Install or configure automated compressor sequencing controls
Program compressor start-stop schedules aligned with production shifts
Identify and eliminate inappropriate compressed air applications
Replace high-consumption blowoff nozzles with engineered Venturi designs
Install solenoid valves on continuous purge applications to convert to intermittent operation
Commission heat recovery systems where applicable
Deliverable: Additional 10-15% energy reduction from intelligent load management and demand optimization
Establish quarterly ultrasonic leak detection survey schedule
Configure automated alerts for pressure excursions, flow anomalies, and specific power degradation
Implement condition-based filter replacement using differential pressure triggers
Track SCFM per production unit as normalized efficiency metric
Calculate monthly energy cost per CFM and trend over time
Review compressed air KPIs in monthly maintenance meetings
Deliverable: Sustained 25-40% energy reduction with continuous improvement feedback loop
Frequently Asked Questions
How much does ultrasonic leak detection equipment cost and is it worth the investment?
Professional-grade ultrasonic leak detectors suitable for industrial compressed air systems cost $2,800 to $8,500 depending on sensitivity, data logging capability, and camera integration features. For a typical FMCG facility with 15 to 30 undetected leaks representing $18,000 to $34,000 in annual energy waste, the payback period is 3 to 6 months. Even facilities that contract quarterly leak surveys to third-party providers typically see ROI within the first year compared to energy costs without systematic detection.
Track leak detection schedules and repair completion in your CMMS or
discuss equipment options for your facility size.
What is the actual energy cost of a compressed air leak at different sizes and pressures?
Leak energy cost scales with hole size and system pressure. At 100 PSI and $0.11/kWh electricity: a 1/16-inch leak costs $530 annually, a 1/8-inch leak costs $2,600 annually, a 1/4-inch leak costs $8,400 annually, and a 1/2-inch leak costs $33,600 annually. These costs increase proportionally with pressure—the same 1/4-inch leak at 110 PSI costs $10,200 annually. Most facilities have 20 to 40 leaks in the 1/16-inch to 3/16-inch range that individually seem negligible but collectively represent $15,000 to $40,000 in annual waste. Begin tracking with
automated work orders generated from leak surveys.
How low can I safely reduce my compressed air system pressure without affecting production?
Most FMCG compressed air systems can safely reduce pressure by 5 to 15 PSI from current setpoints after proper end-use analysis. The procedure: audit every pneumatic device to determine its minimum required operating pressure—typically stamped on the equipment nameplate or listed in technical specifications. Set your system pressure 5 PSI above the highest requirement to account for distribution losses. Install local pressure regulators at zones requiring higher pressure rather than elevating the entire system. Test pressure reduction in 2 PSI increments during production to confirm no adverse effects. Each 2 PSI reduction saves approximately 1% in compressor energy. Need guidance on your specific configuration?
Schedule a system review call.
Should I repair small leaks or just add compressor capacity to compensate?
Repairing leaks is always more cost-effective than adding compressor capacity to compensate for lost air. A new 100 HP compressor costs $35,000 to $55,000 installed plus $14,000 to $18,000 in annual electricity at full load. That same 100 HP of leak-driven demand represents approximately 400 CFM of wasted capacity—achievable through systematic leak elimination at $8,000 to $15,000 one-time cost. Even small leaks should be repaired: the labor cost to fix a typical connection-point leak is $40 to $120, while allowing that leak to persist costs $200 to $800 annually in electricity. The economic choice is unambiguous. Manage leak repair workflows with
digital work order tracking.
Cut Your Compressed Air Energy Costs by 25-40%
Oxmaint connects to your existing flow meters, pressure sensors, and compressor controls to give you real-time visibility into energy waste. Track specific power consumption, automate leak detection workflows, and optimize compressor sequencing across your entire FMCG operation. Start reducing energy costs this month.