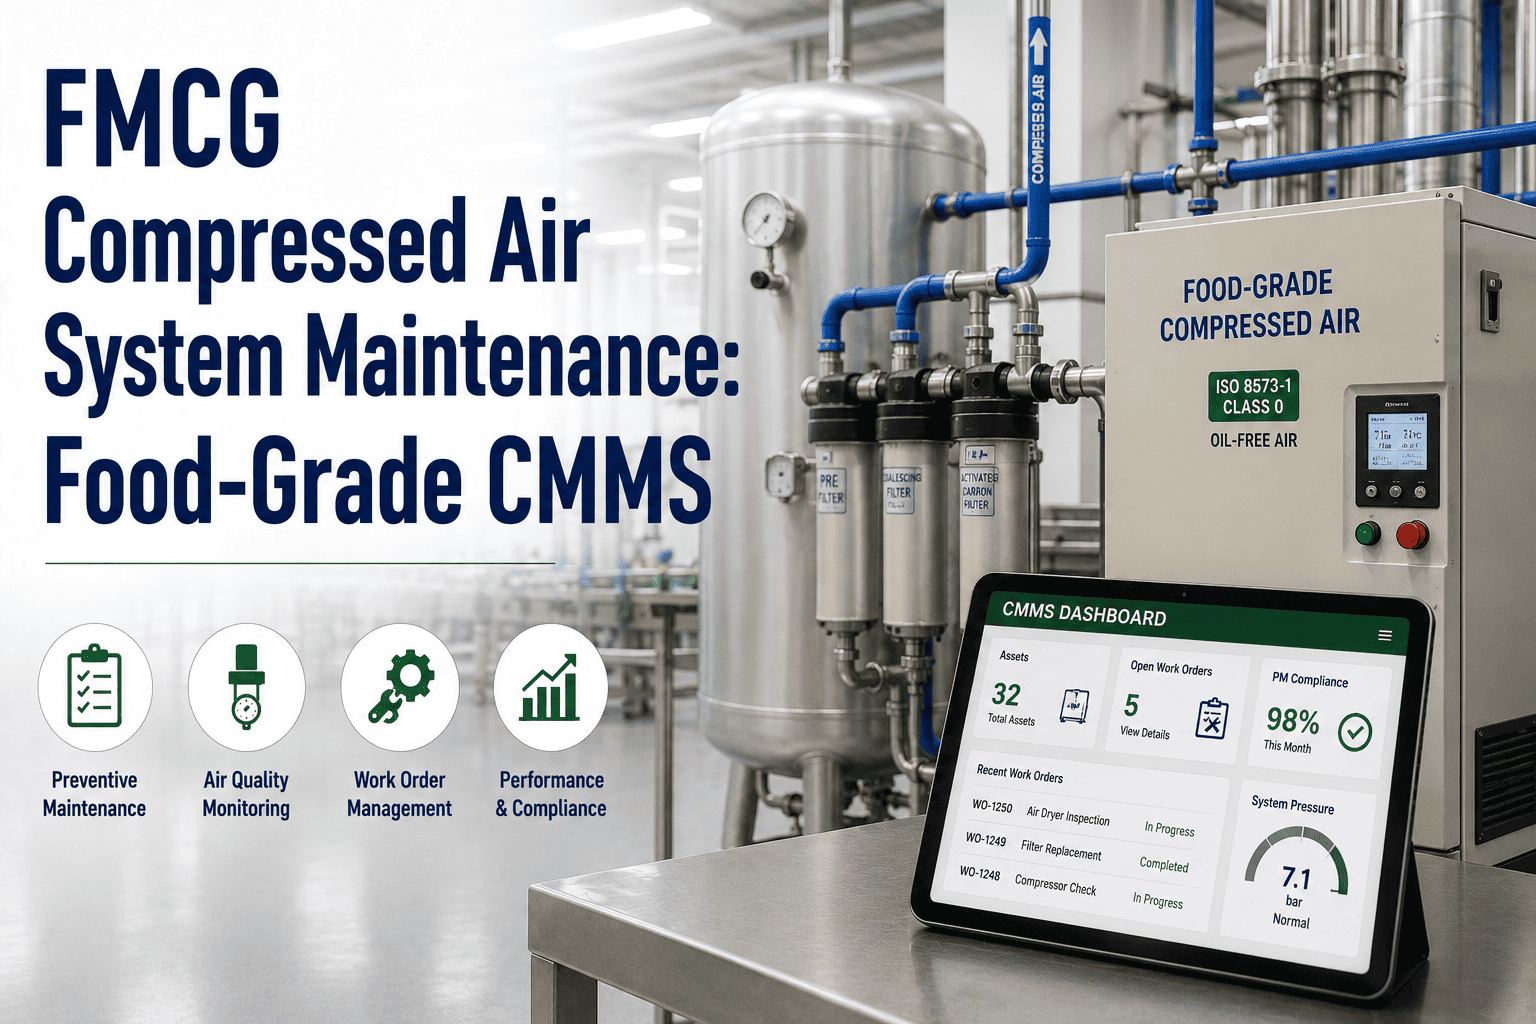
Compressed air is the most expensive utility in most FMCG plants — and the most wasteful. A single 3mm leak wastes over 25,000 litres of compressed air per hour. Pressure drop across an unmaintained filter bank costs the equivalent of running a compressor at partial load continuously. OxMaint's Energy & Sustainability Tracking schedules every compressed air audit task automatically — leak detection, pressure drop analysis, dryer maintenance, and filter replacement logged and trended so energy waste is visible and actioned before it compounds. Book a free demo to see compressed air energy tracking in action.
Audit Coverage Across the 4 Compressed Air Zones
Every zone in a compressed air system contributes to energy cost and air quality. Compressor faults raise generation cost. Saturated dryers and blocked filters degrade air quality and increase pressure drop. Distribution leaks waste generated air before it reaches any point of use. Without structured audit data, none of these losses are visible — they accumulate silently in the energy bill. OxMaint captures every audit result and trends it over time so rising costs and degrading performance are caught before they reach critical levels.
Before the Audit: Baseline and Asset Registration
A compressed air audit without a baseline is just a snapshot. To identify energy waste and degradation, teams need design-intent pressure values, original air quality specifications, compressor rated outputs, and historical energy consumption — all registered in the system before the first audit interval begins. OxMaint registers every compressor, dryer, filter, and distribution zone as a tracked asset before scheduling begins.
| # | Audit Task | Schedule | Acceptance Criteria | Sign-Off | |
|---|---|---|---|---|---|
| 1.1 | Oil level checked and topped up if below minimum. Condition assessed for discolouration or emulsification. Running hours confirmed against OEM oil change interval. | Daily | Oil level within min-max marks. No discolouration or emulsification. Hours to next oil change logged. Change triggered at OEM interval. | ________ | |
| 1.2 | Discharge temperature, inlet pressure, and discharge pressure recorded and compared against the baseline operating envelope for current conditions. | Daily | All parameters within baseline operating envelope. Discharge temperature above limit triggers investigation. Values logged and trended per shift. | ________ | |
| 1.3 | Load/unload cycle time monitored over 15 minutes. Short-cycling more than once per minute indicates receiver, demand, or leak issues requiring investigation. | Daily | Cycle time within normal operating range. Short-cycling rate above threshold triggers demand-side investigation. Cycle data logged. | ________ | |
| 1.4 | Inlet filter differential pressure measured against OEM replacement threshold. Blocked filters raise suction resistance and increase energy cost — replace at threshold regardless of appearance. | Weekly | Differential pressure below OEM replacement threshold. Replacement triggered at threshold regardless of visual appearance. Result logged per filter asset. | ________ | |
| 1.5 | Belt tension and condition inspected on belt-driven compressors. Checked for cracking, glazing, or fraying. Tension verified with gauge against OEM specification. | Weekly | Belt tension within OEM specification. No cracking, glazing, or fraying. Tension adjustment or replacement scheduled if out of spec. | ________ | |
| 1.6 | Full PM per OEM schedule: oil and filter change, separator element, valve condition, and safety relief valve test. PM record linked to asset in CMMS. | Monthly | All PM tasks completed per OEM specification. Safety relief valve tested and confirmed functional. Full PM record archived per compressor asset ID. | ________ | |
| 1.7 | Oil sample taken and submitted for lab analysis. Detects bearing wear, water contamination, and acid development before catastrophic failure occurs. | Monthly | Oil analysis result within acceptable wear metal and contamination limits. Any adverse finding triggers increased monitoring and maintenance review before next scheduled interval. | ________ |
| # | Audit Task | Schedule | Acceptance Criteria | Sign-Off | |
|---|---|---|---|---|---|
| 2.1 | Dew point checked on the dryer controller and recorded. Above-spec reading indicates saturation, refrigerant loss, or heat exchanger fouling — triggers immediate investigation. | Daily | Dew point at or below specification for the application class (typically +3°C or lower for refrigerant dryers). Above-spec reading triggers immediate dryer investigation. Logged per shift. | ________ | |
| 2.2 | All automatic condensate drains tested by observing or manually triggering the drain cycle. Failed drains allow liquid water into the distribution system — replace before next shift. | Daily | All condensate drains confirmed cycling and discharging. No drain found blocked or stuck open (which wastes air continuously). Failed drain replaced before next shift. | ________ | |
| 2.3 | Differential pressure measured across each filter stage — coalescing, particulate, and carbon. dP is the only reliable indicator of element condition; visual inspection is insufficient. | Weekly | Differential pressure below OEM replacement threshold for each filter stage. Threshold reached triggers element replacement regardless of visual condition. Results logged per filter. | ________ | |
| 2.4 | Desiccant condition and regeneration cycle confirmed for adsorption dryers. Dew point probe reading verified against controller display for accuracy. | Weekly | Desiccant confirmed active and regeneration cycle confirmed completing normally. Dew point probe reading within ±2°C of controller display. Desiccant replacement triggered per OEM schedule. | ________ | |
| 2.5 | All filter elements replaced per OEM interval with correct-grade elements. Housing o-rings and seals inspected and replaced where worn. Post-replacement dP confirmed at baseline. | Monthly | All elements replaced with correct-grade elements per OEM interval. Housing seals confirmed. Post-replacement differential pressure confirmed at baseline (near-zero). Logged per filter asset ID. | ________ | |
| 2.6 | Air quality spot-test at food-contact blow-off, open-product conveyors, and filling inlets. Oil vapour, moisture, and particulate tested against the required ISO 8573-1 class. | Monthly | Air quality at all tested points meets or exceeds the required ISO 8573-1 class. Any fail triggers immediate investigation of the upstream dryer and filter train. Results archived. | ________ |
| # | Audit Task | Schedule | Acceptance Criteria | Sign-Off | |
|---|---|---|---|---|---|
| 3.1 | System pressure at main header and key point-of-use locations recorded at shift start and end. Drop above design tolerance indicates distribution resistance requiring investigation. | Daily | Pressure drop from header to point of use within designed tolerance (typically <0.3 bar). Any reading above threshold triggers distribution investigation. Values trended daily. | ________ | |
| 3.2 | System isolated at end of shift. Initial pressure recorded and residual pressure measured after 8–12 hours. Pressure drop indicates total system leakage rate — results trended weekly. | Daily | Pressure decay below 0.3 bar over the test period for a well-maintained system. Decay above 0.5 bar indicates significant leakage requiring a zone-by-zone leak hunt. Results trended weekly. | ________ | |
| 3.3 | Ultrasonic leak survey across production areas — headers, branch connections, point-of-use fittings, and tool connections. Every leak tagged with location and estimated flow rate. | Weekly | All detected leaks tagged and logged with location, connection type, and estimated flow rate. Repair work orders raised immediately. High-flow leaks repaired within 24 hours. | ________ | |
| 3.4 | Pipe joints, compression fittings, and push-in connectors in high-vibration areas inspected visually and with soap solution. Vibration progressively loosens fittings over time. | Weekly | All fittings in high-vibration zones confirmed secure with no audible or visible leakage. Any loose or leaking fitting repaired and re-tested before the area returns to production. | ________ | |
| 3.5 | Full pressure map completed — pressure measured at each branch takeoff and point of use. Compared against design intent to identify sections with excessive drop. | Monthly | All pressure readings mapped and compared against design intent. Any section with drop >0.5 bar above design triggers pipework investigation. Pressure map archived monthly. | ________ | |
| 3.6 | All prior-month leaks confirmed repaired and re-tested. Total estimated flow rate before and after repairs calculated to quantify energy saving achieved. | Monthly | All prior-month leaks confirmed repaired and re-tested clean. Estimated annual energy saving from repairs calculated and reported. Outstanding repairs escalated with revised completion date. | ________ |
| # | Audit Task | Schedule | Acceptance Criteria | Sign-Off | |
|---|---|---|---|---|---|
| 4.1 | kWh recorded from energy meter and compared against the rolling 7-day production-adjusted baseline to detect unexplained energy increases. | Daily | kWh per unit of production within ±5% of 7-day baseline. Increase above threshold triggers demand-side and supply-side investigation. Logged daily per compressor. | ________ | |
| 4.2 | Load factor reviewed — percentage of time each compressor runs loaded vs unloaded vs idle. High unloaded running indicates sequencing or pressure band optimisation opportunity. | Daily | Load factor above 75% loaded indicates high demand. Unloaded running above 25% indicates optimisation opportunity. Both conditions logged and reviewed weekly. Action triggered above threshold. | ________ | |
| 4.3 | Pressure set point confirmed at the minimum required by the highest-demand application. Set point creep — upward drift caused by leaks or filter dP — identified and corrected. | Weekly | Pressure set point at minimum required by highest-demand application. Any unexplained set point increase triggers demand-side audit. Set point confirmed and logged weekly. | ________ | |
| 4.4 | Sequencing reviewed for multi-compressor installations. Trim compressor confirmed in load-following mode. No two compressors running simultaneously in unloaded mode. | Weekly | Sequencing confirmed correct with trim compressor load-following. No two compressors running simultaneously in unloaded mode. Sequencing logic confirmed per the energy management procedure. | ________ | |
| 4.5 | Monthly kWh and energy cost calculated. Cost per unit of production compared against prior month and annual target. Increases above 5% month-on-month trigger a full system investigation. | Monthly | Energy cost per unit of production at or below monthly target. Year-on-year comparison calculated. Any cost increase above 5% month-on-month triggers a full system investigation. | ________ | |
| 4.6 | Non-production air consumption measured and compared against acceptable standby level. Exceedance indicates open lines, failed drains, or leaking isolation valves — triggers a non-production leak audit. | Monthly | Non-production air consumption below acceptable standby level. Any exceedance triggers a leak and isolation valve audit during the next planned non-production window. | ________ | |
| 4.7 | Monthly optimisation review: three priority saving opportunities identified, action plan updated with owners and due dates, and year-to-date saving reported against annual target. | Monthly | Three priority opportunities identified and actioned. Year-to-date saving calculated and reported. Review signed by energy manager. Actions logged in OxMaint with assigned owners and due dates. | ________ |
Audit Sign-Off — Issued When All 4 Zones Are Confirmed
Audited ✓
Filters ✓
& Leaks ✓
Optimisation ✓
Complete
Performance Metrics — Compressed Air Audit Programme
kWh per unit of production for compressed air generation. Trended monthly to identify genuine efficiency degradation versus production volume change — the only metric that separates energy performance from production output.
Total estimated leak flow rate in litres per minute across the plant, calculated from overnight decay tests and ultrasonic surveys. Target below 10% of peak demand for a well-maintained FMCG system.
Average pressure drop from compressor discharge to highest-demand point of use. Rising pressure drop indicates filter, dryer, or distribution blockage and forces the compressor set point higher — compounding energy cost.
Percentage of point-of-use air quality tests passing the required ISO 8573-1 class for each application. Any failure at a food-contact point is a quality and safety event requiring immediate corrective action.