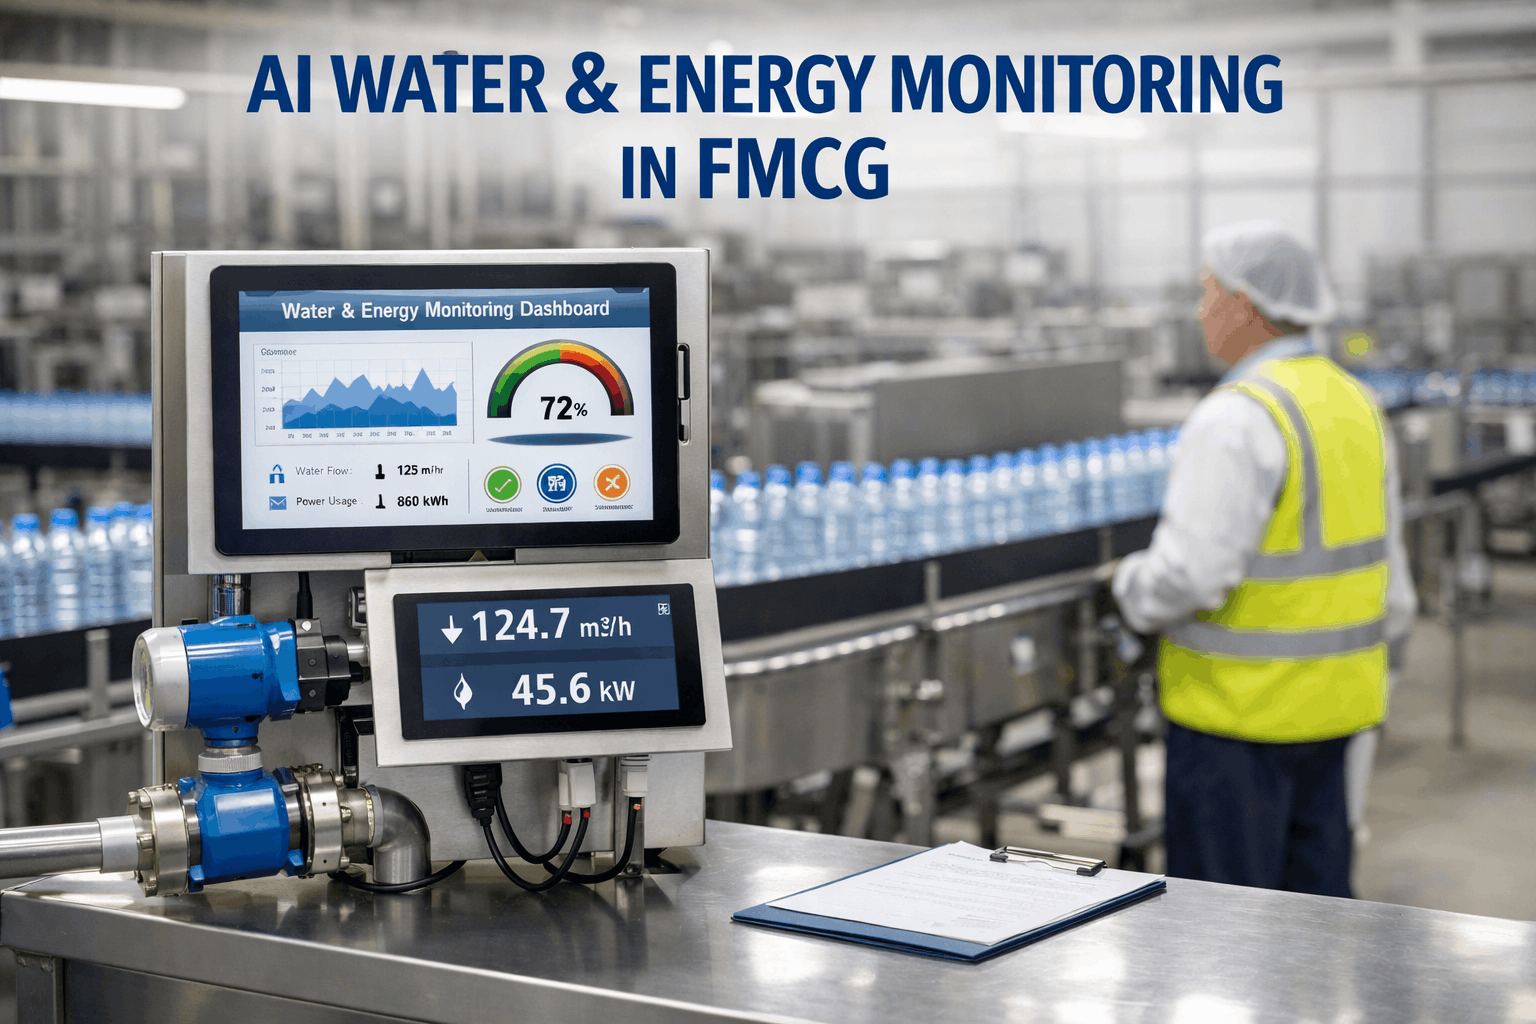
Energy is the second or third largest operating cost in most FMCG manufacturing plants — and in sectors like dairy, frozen food, beverage, and personal care, it routinely represents 8 to 15 percent of total production cost. Unlike raw material cost, which is governed by commodity markets, or labor cost, which is largely fixed, energy cost in FMCG manufacturing is directly controllable — with 15 to 30 percent of current consumption either wasted through equipment inefficiency, operating at the wrong time, or drawn by assets that are running when they should not be. The difference between FMCG plants managing energy reactively — looking at the monthly bill — and those managing it proactively — tracking consumption by asset, by hour, and by production unit — is typically $200,000 to $800,000 per year at a mid-size plant. Start a free trial and connect your equipment assets to Oxmaint's energy monitoring today, or book a demo to see how FMCG plants are cutting energy costs 15 to 30 percent with connected asset and energy management.
8–15%
Energy as % of Production Cost
in energy-intensive FMCG sectors — dairy, frozen food, beverage manufacturing
15–30%
Energy Reduction Achievable
from structured energy management with AI monitoring and asset-linked consumption tracking
$800K
Annual Energy Saving Potential
at a mid-size FMCG plant from eliminating identified waste across utilities and production
30%
Compressed Air Waste Typical
share of compressed air generation lost through leaks, pressure drop, and over-specification in average FMCG plants
Energy waste and equipment maintenance are the same problem — Oxmaint solves both
When a compressor runs inefficiently, a refrigeration condenser coil is fouled, or a steam trap has failed open, the energy waste is inseparable from the maintenance failure. Oxmaint connects asset health monitoring to energy consumption tracking — making the link between equipment condition and energy cost immediately visible and actionable.
Where FMCG Plants Lose Energy — The 6 Major Systems
Energy waste in FMCG manufacturing is not spread evenly — it concentrates in six utility and process systems where equipment condition directly determines consumption efficiency. Understanding which system is consuming the most above its optimal baseline is the foundation of any meaningful energy reduction program.
System 1
Compressed Air
Typically 20–30% of total plant energy spend
Leakage: 25–30% of generated air lost through fittings, hoses, and aging connections
Over-pressure: running at 8 bar when processes need 6 bar wastes 16% of compressor energy
Artificial demand: pressure fluctuations in the distribution system increasing compressor cycling
Achievable reduction: 20–35% with leak detection and pressure optimization
System 2
Refrigeration
Typically 30–50% of total energy in cold chain and dairy FMCG
Fouled condensers: 15–25% efficiency loss from scale and biofilm buildup on heat exchange surfaces
Refrigerant charge: low or contaminated charge forcing compressors to work 20–30% harder
Door seal failure: cold room infiltration load adding 10–20% to refrigeration energy demand
Achievable reduction: 15–25% with condenser cleaning schedule and leak detection
System 3
Steam and Hot Water
Typically 15–25% of total plant energy in food processing
Steam trap failure: failed-open traps waste 8–12% of total steam generation
Distribution losses: uninsulated pipework and flanges losing 15–20% of steam enthalpy
Over-generation: boiler running at full capacity during low-demand periods
Achievable reduction: 15–20% from steam trap surveys and insulation improvement
System 4
HVAC and Ventilation
Typically 10–20% of total plant energy
Constant-speed fans: running at 100% capacity when 65% would meet demand — VFD opportunity
Filter fouling: dirty air filters increasing fan work by 15–25% to maintain flow rate
Zone control: conditioning unmanned production areas during non-production hours
Achievable reduction: 20–40% with VFD installation and scheduling optimization
System 5
Production Line Motors
Typically 15–25% of total plant energy in packaging
Fixed-speed drives on variable-demand conveyors and pumps
Degraded bearings increasing motor current draw by 10–20%
Idling consumption: motors running at 40–60% of load drawing disproportionate reactive power
Achievable reduction: 15–30% from VFD retrofit and bearing maintenance program
System 6
Lighting and Facilities
Typically 5–10% of total plant energy — easy wins available
Fluorescent lighting in high-bay production areas drawing 3–5x LED equivalent energy
No occupancy-based control in warehouses and secondary areas
Daytime lighting at full power in naturally lit perimeter production zones
Achievable reduction: 40–60% from LED migration and occupancy control
Reactive Energy Management vs. AI-Driven Energy Optimization
How Oxmaint Connects Asset Maintenance to Energy Management
The most significant energy reduction opportunities in FMCG manufacturing are not efficiency projects — they are maintenance failures. A fouled refrigeration condenser is a maintenance problem and an energy problem simultaneously. Oxmaint bridges the gap by linking asset condition monitoring to energy consumption data, making the maintenance-energy connection automatic and actionable. Start a free trial and begin tracking energy-linked asset conditions across your FMCG plant, or book a demo to see the asset-energy monitoring dashboard.
Condition Monitoring
Asset Condition to Energy Deviation Alerts
When a compressor, refrigeration unit, or steam system asset's condition score falls below threshold, Oxmaint automatically compares current energy consumption against the asset's baseline — flagging the deviation as both a maintenance priority and an energy waste event requiring action.
PM Scheduling
Energy-Linked Preventive Maintenance Triggers
Condenser cleaning schedules, steam trap surveys, compressed air leak checks, and bearing inspections are scheduled as preventive maintenance tasks in Oxmaint — triggered by run hours, consumption deviation, or calendar interval. Energy-saving maintenance is tracked, completed, and verified like any other PM task.
Production Analytics
Energy per Production Unit Tracking
Track energy consumption per production unit by line, shift, and SKU — the metric that makes energy cost visible in terms management understands. Rising energy per unit is an early warning of equipment efficiency degradation, triggering maintenance investigation before the inefficiency becomes a budget problem in next month's utility invoice.
Work Order Integration
Energy Waste Events Generate Maintenance Actions
Automated work orders generated when energy monitoring detects compressed air flow deviation above baseline, refrigeration COP below target, or motor current draw outside normal range. The energy waste triggers the maintenance response — closing the loop between monitoring and action automatically.
Energy Reduction Results: What FMCG Plants Achieve
30%
Compressed Air Reduction
From continuous leak detection and pressure optimization on FMCG packaging and processing lines
20%
Refrigeration Saving
From condenser cleaning schedules, refrigerant charge management, and door seal maintenance programs
$800K
Annual Energy Saving
Typical annual energy cost reduction at a mid-size FMCG plant with comprehensive asset-linked energy management
18 months
Payback Period
Typical payback on energy management platform and targeted maintenance investment for FMCG plants
Frequently Asked Questions
How much energy can FMCG plants realistically reduce through energy management?
Most FMCG plants operating without structured energy management have 15 to 30 percent of their total energy consumption either wasted or sub-optimally used. Compressed air systems alone typically lose 25 to 30 percent of generated air through leaks and over-pressure. Refrigeration systems with fouled condensers run 15 to 25 percent less efficiently than their cleaned baseline. Steam systems with failed traps waste 8 to 12 percent of steam generation. Addressing these three systems with maintenance-linked monitoring typically delivers 15 to 25 percent overall energy reduction — translating to $200,000 to $800,000 per year at a mid-size FMCG manufacturing site.
What is the relationship between equipment maintenance and energy efficiency in food plants?
Every major energy system in an FMCG plant has a direct link to asset maintenance: compressor efficiency degrades when air dryers and filters are unmaintained; refrigeration COP drops when condensers are fouled; steam system efficiency falls when traps fail and insulation degrades; motor efficiency decreases when bearing wear increases current draw. In most FMCG plants, the largest energy reduction opportunities are maintenance interventions — not capital efficiency projects. This means the Maintenance Manager and the Energy Manager need to work from the same asset data platform to identify and resolve the overlap effectively.
What is energy per production unit and why does it matter more than total energy cost?
Energy per production unit (kWh per case, per tonne, or per thousand units) normalizes energy consumption against actual production output — making it the only metric that tells you whether energy performance is improving or deteriorating independent of volume fluctuations. A plant's total energy bill rising by 8% during a 15% production volume increase is actually better per-unit performance. Tracking total energy cost alone misses this distinction. Per-unit energy tracking also enables comparison across lines, shifts, and SKUs — identifying where the highest energy waste per unit of production is occurring and targeting maintenance and operational improvements to the highest-impact areas.
How does AI monitoring improve energy management compared to manual energy audits?
Annual energy audits find waste that has been accumulating for months and will continue accumulating until the next audit. AI continuous monitoring detects deviations from asset energy baselines within hours or days of their occurrence — catching a new compressed air leak within 24 hours rather than discovering it 8 months later at the next survey. AI monitoring also eliminates the fixed audit schedule limitation: rather than surveying all systems annually, AI prioritizes investigation to the specific assets currently showing the largest deviations from their energy baseline — directing engineering time to where the financial impact is greatest at any given time.
Reduce your FMCG energy costs 15–30% — by maintaining your equipment better, not buying new kit
Oxmaint connects asset condition monitoring to energy consumption tracking across your compressed air, refrigeration, steam, HVAC, and motor systems — making maintenance failures visible as energy cost events before they appear on the monthly utility invoice. Join FMCG plants recovering $200,000 to $800,000 per year in energy cost through maintenance-linked energy management.