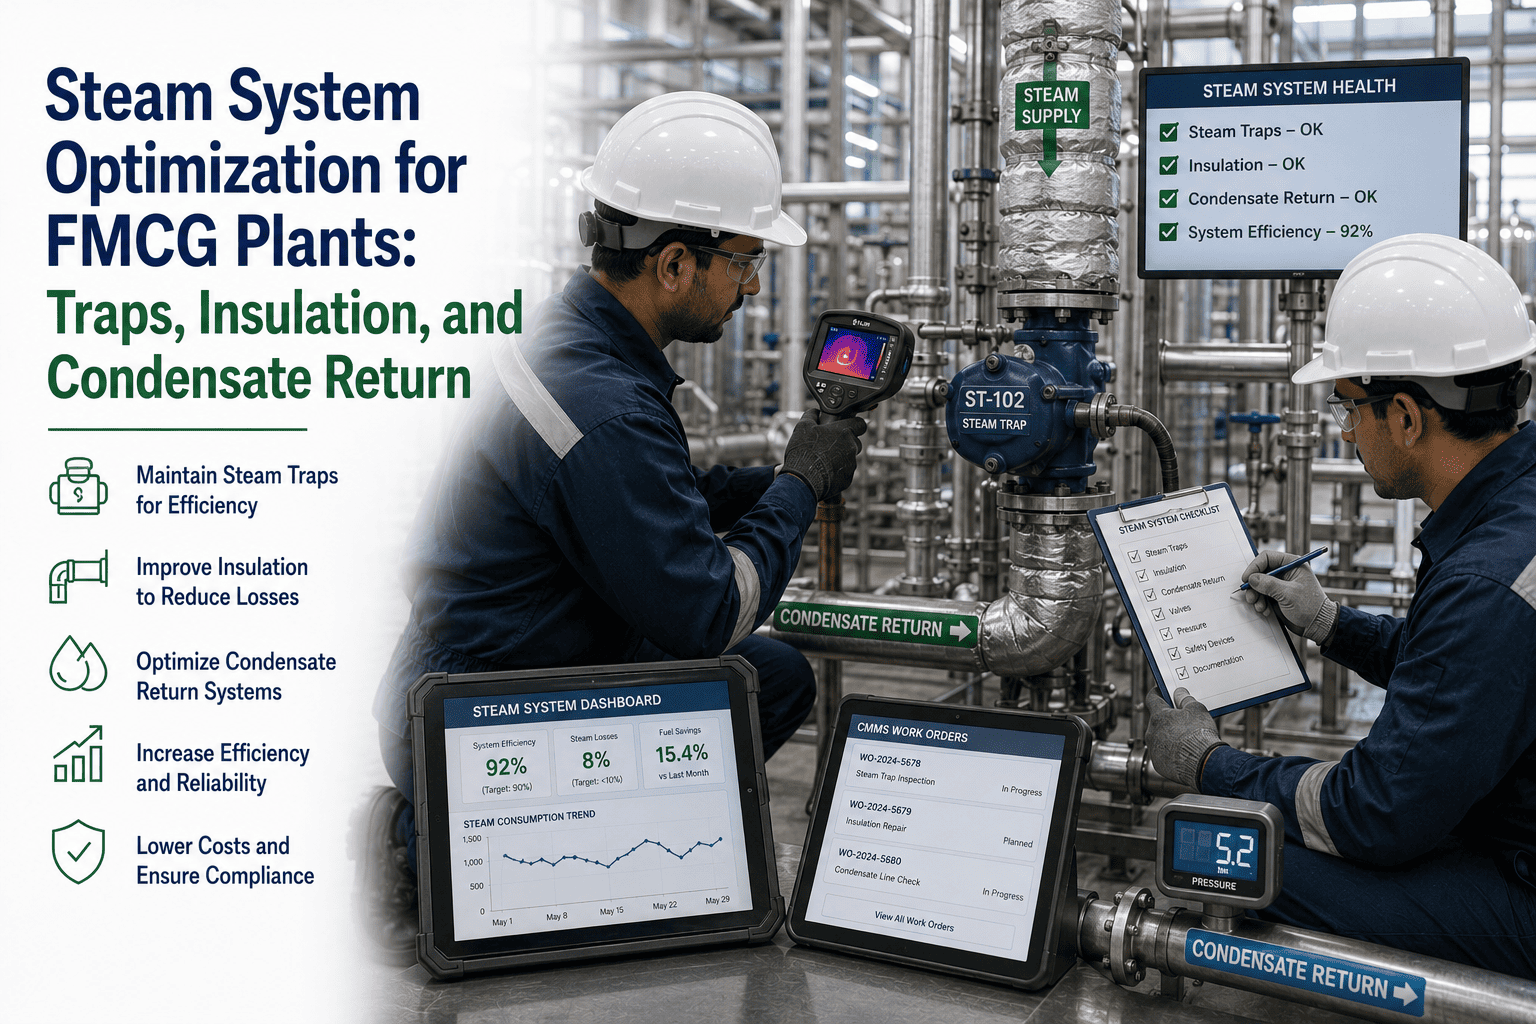
A frozen food manufacturer in Minnesota was spending $4.1M annually on energy — and treating every dollar of that as a fixed cost of doing business in cold chain manufacturing. The assumption was reasonable on the surface: refrigeration, compressed air, and steam systems have to run. What wasn't reasonable was the assumption that they were running efficiently. When Oxmaint's Energy and Sustainability Tracking module was connected to the facility's utility meters and equipment sensors, it revealed that 31% of energy consumption was directly linked to deferred maintenance — refrigeration systems running with fouled coils, compressed air leaks consuming 18% of compressor output, and steam traps failing open and bleeding $340,000 of thermal energy annually into the atmosphere. Within 14 months, a maintenance-driven energy programme reduced the facility's total energy spend by 22% — saving $902,000 per year without a single capital equipment upgrade.
Case Study · Frozen Food Manufacturing · United States
Frozen Food Manufacturer Cuts Energy Costs 22% Through Maintenance-Driven Optimisation
31% of energy waste traced directly to deferred maintenance
Zero capital equipment upgrades required — existing assets optimised
$902K saved annually · 14-month payback on full programme
14 mo.
To full programme results
Company Profile
IndustryFrozen vegetables, entrées, and ready-to-cook meals — retail and foodservice
HeadquartersMinneapolis, Minnesota
Facility380,000 sq ft · 6 production lines · cold storage: 2.4M cubic ft
Annual energy spend$4.1M pre-deployment · electricity 71%, natural gas 29%
Key energy systemsAmmonia refrigeration, compressed air (4 compressors), steam boilers, HVAC
Maintenance team22 technicians · 3 shifts · refrigeration specialist on each shift
The Challenge: $4.1M Energy Bill With No Visibility Into Why
Before Oxmaint, the facility's energy management consisted of monthly utility invoices and a general sense that refrigeration was "the biggest cost." No one had correlated energy consumption to equipment condition. No one had calculated the energy cost of a fouled evaporator coil or a failed steam trap. And no one had a mechanism to detect the gradual efficiency losses that occur between planned maintenance intervals — the losses that don't trigger fault codes but consume energy continuously until the next scheduled service.
31%
Energy waste from maintenance gaps
Oxmaint's energy audit baseline revealed that $1.27M of the annual $4.1M energy spend was directly attributable to maintenance-correctable conditions — fouled coils, compressed air leaks, failed steam traps, and misaligned drive belts. None of these conditions were visible in the existing maintenance system.
18%
Compressed air lost to leaks
Industry benchmark for leak loss in compressed air systems is 6–8%. The facility was losing 18% of total compressor output — 3× the acceptable rate. At $0.12/kWh, this represented $187,000 per year of electricity generating pressure that immediately leaked away. Leak detection had never been conducted with ultrasonic equipment.
$340K
Steam trap failures bleeding energy
Of the 84 steam traps across the facility, 23 were found to be failed open — passing live steam continuously rather than condensate only. Each failed trap was wasting between $8,000 and $22,000 of natural gas annually. The traps had not been individually tested in over 3 years. No trap was assigned to an individual work order in the maintenance system.
Zero
Energy-maintenance correlation in place
The maintenance team had no mechanism to see the energy cost of deferred maintenance. A fouled refrigeration evaporator coil that increases compressor load by 12% shows no fault code — it simply costs more to run. Without energy consumption linked to asset health in the same platform, this relationship was invisible.
"
We knew our energy bill was high. We didn't know how much of it was a maintenance bill in disguise. When Oxmaint showed us that 31% of our energy spend was connected to conditions our team could fix — not capital we needed to buy — that changed the entire framing of our sustainability programme.
Plant Engineering Manager, Frozen Food Manufacturing Facility, Minneapolis, MN
How Oxmaint Energy Tracking Works: Connecting Maintenance to Utility Consumption
Oxmaint's Energy and Sustainability Tracking module connects utility meter data, equipment sensor readings, and maintenance work order history in a single platform — making the energy cost of equipment condition visible for the first time. The core insight the platform delivers: every asset's energy consumption is a function of its maintenance state, and deferred maintenance has an energy cost that can be calculated, tracked, and eliminated through structured maintenance action.
✓
Utility Meter Integration — Energy Consumption by Asset
Oxmaint connects to smart utility meters and submeters via Modbus TCP or BACnet, pulling electricity, natural gas, and compressed air consumption data by circuit and by production zone. This data is mapped to individual assets in the Oxmaint asset register — so the energy consumption of the ammonia refrigeration compressor bank is tracked separately from the blast freezer evaporators, and both are visible on the same dashboard as their maintenance history and PM compliance status. The relationship between a missed evaporator coil cleaning PM and a 14% increase in compressor electricity consumption becomes a visible, documented fact rather than a general assumption.
✓
Energy Baseline Per Asset — Detecting Efficiency Degradation
For each energy-intensive asset, Oxmaint establishes a performance baseline — the expected energy consumption per unit of output under well-maintained operating conditions. As equipment condition degrades between PM intervals, energy consumption rises above baseline. Oxmaint tracks this deviation continuously and alerts the maintenance team when an asset's energy consumption exceeds its baseline by a configured threshold — typically 8–10% — generating a predictive maintenance work order before the condition worsens. In this deployment, the refrigeration evaporator coil cleaning interval was extended 40% on two evaporator banks and reduced on three others — based on actual energy deviation data rather than a uniform calendar schedule.
✓
Steam Trap Survey Integration — Making Invisible Losses Visible
Oxmaint's steam trap management module creates an individual asset record for every steam trap in the facility — each with its own location, trap type, expected condensate load, and inspection history. Steam trap surveys — conducted with ultrasonic or infrared testing equipment — are completed as mobile work orders in Oxmaint, with each trap's test result recorded and the annual energy loss calculated automatically for any trap found to be failed open. The calculated loss per trap is displayed in the asset record and feeds the facility's annual steam trap energy savings dashboard. For this facility, the first survey identified 23 failed-open traps with a combined calculated annual loss of $340,000.
✓
Compressed Air Leak Tracking — From Detection to Verified Savings
Oxmaint manages compressed air leak detection campaigns as structured work orders — each detected leak is logged with its location, estimated flow rate (litres per minute), calculated annual energy cost, and repair priority. After repair, the post-repair flow rate is recorded and the energy saving is calculated and posted to the facility's Oxmaint energy savings ledger. This creates a documented, auditable record of energy savings that satisfies utility rebate programme requirements and sustainability reporting needs. In this deployment, 47 individual leaks were detected, logged, repaired, and verified — with a combined annual saving of $187,000 documented in the Oxmaint energy savings ledger.
Energy & Sustainability Tracking — Oxmaint
See the Energy Cost of Every Deferred PM — Before It Appears on Your Utility Bill.
✓Utility meter to asset — energy consumption mapped per equipment
✓Steam trap survey management — loss calculated, tracked, and auditable
✓Compressed air leak ledger — from detection to verified savings
✓Energy deviation alerts — predictive PM before efficiency loss grows
The Programme: 14 Months of Maintenance-Driven Energy Reduction
The energy reduction programme was structured in three streams running in parallel — refrigeration system optimisation, compressed air leak elimination, and steam trap remediation. Each stream had its own baseline, its own action plan, and its own savings ledger in Oxmaint. The three streams were sequenced to address the largest identified losses first, generating early savings that built programme momentum and management confidence.
Stream 1
Months 1–14
Refrigeration System Optimisation
Largest single energy system — 58% of total facility electricity. Target: 15% efficiency improvement on refrigeration load
1Evaporator coil energy baseline established — individual submeter data mapped to each of 14 evaporator banks. Coil 7 and Coil 11 identified as consuming 23% above baseline — confirmed as fouled on inspection. Cleaned and returned to within 3% of baseline within 48 hours
2Coil cleaning intervals optimised — uniform 6-week cleaning schedule replaced with individual energy-deviation-triggered intervals. 5 coils extended to 10 weeks. 3 coils with higher loading reduced to 4 weeks. Net PM labour reduced 18% while energy performance improved
3Condenser approach temperature tracking — Oxmaint energy dashboard tracks condenser approach temperature (the difference between condensing temperature and ambient) as a key refrigeration efficiency indicator. Alert set at +3°C above seasonal baseline. 4 condenser cleaning events triggered proactively in the first year
4Refrigeration compressor envelope optimisation — suction and discharge pressure setpoints reviewed against actual load data from Oxmaint. Condensing pressure reduced 18 kPa on two compressors based on actual ambient temperature data — reducing shaft power requirement 4.2%
Stream 1 result: Refrigeration electricity consumption reduced 17% — saving $418,000 annually against the baseline.
Stream 2
Months 1–4
Compressed Air Leak Elimination
18% system leak rate — 3× acceptable. Target: reduce to below 8% within 4 months
1Ultrasonic leak survey — all compressed air distribution across 380,000 sq ft surveyed with Fluke ii910 ultrasonic camera. 47 leaks detected, logged in Oxmaint with location, estimated flow rate, and calculated annual cost. Combined cost: $187,000/yr
2Prioritised repair campaign — leaks ranked by annual cost in Oxmaint. Top 15 leaks (accounting for 71% of loss) repaired in week 2. Remaining 32 repaired over 8 weeks during production changeovers to minimise disruption
3Post-repair verification — each repaired leak re-tested with ultrasonic device. Flow rate confirmed at zero and saving posted to Oxmaint energy savings ledger. System leak rate verified at 6.1% by month 4 — below the 8% target
4Quarterly leak survey established — Oxmaint PM schedule generates a leak survey work order every quarter. Leak rate has remained below 7% through 4 subsequent quarterly surveys
Stream 2 result: Compressed air leak rate 18% → 6.1%. Annual saving: $187,000. Payback on survey and repair cost: 6 weeks.
Stream 3
Months 2–8
Steam Trap Remediation
84 steam traps — 23 failed open. $340,000 annual loss. Target: all traps repaired and on annual survey cycle
1Full trap survey — all 84 traps individually tested with Spirax Sarco SteamStar ultrasonic device. Results logged in Oxmaint: 23 failed open (27% failure rate), 8 failed closed (condensate backing up), 53 operating correctly. Individual energy loss calculated per failed trap
2Emergency repairs on highest-loss traps — 6 traps with calculated individual losses above $18,000/year repaired within 72 hours of survey completion. Combined saving from emergency repairs: $142,000/yr
3Phased remediation of remaining failed traps — 17 remaining failed traps repaired over 6 weeks. 8 failed-closed traps repaired to restore condensate drainage. Total $340,000 annual loss eliminated
4Annual survey PM established — Oxmaint PM schedule generates individual survey work orders for all 84 traps on a 12-month cycle. High-risk traps (process heating, freeze protection) assigned a 6-month interval
Stream 3 result: $340,000 annual steam loss eliminated. 23 failed traps remediated. All 84 traps now on individual Oxmaint maintenance schedule.
The Results: 14-Month Energy Performance
All results are measured against the 12-month pre-deployment energy baseline using actual utility invoice data. The 22% reduction is a verified financial figure — not an engineering estimate — confirmed against utility billing records at month 14.
22%
Total Energy Cost Reduction
From $4.1M to $3.2M annually — $902,000 per year in documented utility savings across electricity and natural gas. The reduction came entirely from maintenance-correctable conditions: no capital equipment was replaced, no systems were upgraded, and no production capacity was reduced.
$902K
Annual Utility Savings
Refrigeration optimisation: $418K. Steam trap remediation: $297K (net of replacement parts). Compressed air leak elimination: $187K. The three streams operated independently with separate savings ledgers in Oxmaint — each verifiable against the utility submeter data for that system.
17%
Refrigeration Electricity Reduction
The largest single contributor — a 17% reduction in refrigeration electricity consumption achieved entirely through maintenance action: evaporator coil cleaning on energy-deviation triggers, condenser approach temperature management, and compressor setpoint optimisation based on actual load data.
18% → 6.1%
Compressed Air Leak Rate
47 leaks detected, repaired, and verified in the first 4 months. System leak rate reduced from 18% — 3× the acceptable benchmark — to 6.1%, below the industry target of 8%. Quarterly leak surveys have maintained the rate below 7% through 4 subsequent survey cycles.
27% → 0%
Steam Trap Failure Rate
23 of 84 traps found failed open in the initial survey — a 27% failure rate against an industry benchmark of below 5%. All 23 were remediated within 8 weeks. The current failure rate at the most recent annual survey: 1 trap failed (1.2%) — caught and repaired before the next survey cycle.
1,840 t
CO₂e Reduction Annually
The 22% energy reduction translates to 1,840 tonnes of CO₂e per year — equivalent to removing 400 passenger vehicles from the road. The figure is calculated using EPA emission factors for the Minnesota grid and natural gas combustion and is included in the corporation's annual sustainability report.
"
The sustainability team had been trying to get capital approved for new refrigeration equipment for two years. Oxmaint showed us we could cut our energy bill by $902,000 with the equipment we already had — we just had to maintain it properly. The board approved the Oxmaint investment in the same meeting where we presented the energy baseline findings.
Plant Engineering Manager, Frozen Food Manufacturing Facility, Minneapolis, MN
Deep Dive: How Maintenance-Driven Energy Optimisation Works in Cold Chain
Cold chain manufacturing is unique in energy management because the dominant energy systems — refrigeration, compressed air, and steam — all degrade gradually in ways that increase energy consumption without triggering fault codes. Understanding the specific degradation mechanisms and how Oxmaint detects them before they become expensive is the foundation of the energy programme.
Refrigeration Evaporator Coil Fouling — The Invisible Energy Drain
$418K of the $902K saved
Evaporator coils in frozen food facilities accumulate frost, ice, and product debris between defrost cycles. As fouling builds, heat transfer efficiency drops — the coil surface that should be exchanging heat with the refrigerated space instead acts as insulation. The refrigeration compressors compensate by working harder, drawing more electricity. A coil that is 15% fouled increases compressor electrical demand by approximately 12%. In a facility with 14 evaporator banks drawing a combined 380kW, that represents 45.6kW of wasted electricity running continuously. Oxmaint detects this by monitoring the relationship between evaporator inlet and outlet temperatures against the compressor suction pressure — when the approach temperature difference widens beyond the baseline, a coil cleaning work order is generated automatically, regardless of the calendar-based cleaning schedule.
Steam Trap Failure — The Most Underestimated Energy Loss in Manufacturing
$340K eliminated (net $297K after parts)
A failed-open steam trap passes live steam directly to the condensate return system — bypassing the heat exchanger or process it was supposed to serve. Each failed trap represents the full thermal energy of the steam it passes: at $8–$22 per trap per day in natural gas costs, 23 simultaneously failed traps were burning $184–$506 daily. The failure mode is silent and invisible without testing — the condensate return system operates normally, the boiler makes up the additional steam demand automatically, and the only evidence is a natural gas consumption that is higher than it should be. Oxmaint's steam trap module assigns each trap its own annual test work order, calculates the energy cost of any failed trap automatically from the measured flow rate and the facility's gas cost, and generates a repair work order with priority set by the calculated daily loss.
Compressed Air Leaks — Paying for Pressure You Never Use
$187K eliminated · 6-week payback
Compressed air is typically the most expensive energy carrier in a manufacturing facility — the conversion from electrical energy to compressed air is inherently inefficient (approximately 8–10% of input energy becomes useful work). Every litre per minute of compressed air that leaks to atmosphere represents a direct loss of the electricity used to compress it. At 18% system loss, this facility was running compressors around the clock to produce air that never reached a production tool. The ultrasonic detection and Oxmaint tracking approach works because it makes each leak a discrete, costed, assignable maintenance task rather than a general "system efficiency" problem. When a technician can see that leak #23 in packaging bay 4 costs $4,200 per year and takes 20 minutes to fix, the maintenance economics are compelling. When the repair is completed and the saving is posted to the Oxmaint ledger, it becomes an auditable sustainability result.
Financial Summary
The energy savings programme was presented to the plant's board at month 14 with a complete financial record from Oxmaint's energy savings ledger, verified against utility invoices. The 4.8× ROI calculation uses only the first 14 months of audited savings — the ongoing annual saving of $902,000 against a one-time programme investment produces a significantly higher lifetime return.
14-Month Financial Performance — Energy Optimisation Programme
All figures verified against utility invoices and Oxmaint energy savings ledger
Refrigeration Optimisation (17% reduction)
Coil cleaning, condenser management, compressor setpoint optimisation · electricity savings
+$418,000
Steam Trap Remediation (23 traps)
$340K gross gas saving · minus $43K trap replacement parts · net saving
+$297,000
Compressed Air Leak Elimination
47 leaks repaired · 18% → 6.1% leak rate · electricity saving
+$187,000
Oxmaint Platform + Programme Investment
Software, energy module, survey equipment, implementation, staff training
−$188,000
Net 14-Month Financial Return
$714,000 · 4.8× ROI
The $902K annual saving figure is the ongoing annualised return. The 14-month ROI calculation above uses only the prorated savings for the programme period. From month 15, the full $902K annual saving accrues against the one-time $188K investment.
Frequently Asked Questions
Energy & Sustainability Tracking — Oxmaint
Cut Your Energy Bill 22% — With the Equipment You Already Have.
✓Utility meter to asset — energy per equipment, not per building
✓Steam trap management — individual survey, loss calculated, repair tracked
✓Compressed air leak ledger — savings auditable for utility rebates
✓CO₂e reporting — EPA factors, monthly output, sustainability-report ready