A beverage bottling plant in Georgia was spending $2.8 million annually on water and $1.9 million on energy — and had no reliable way to determine where either resource was being wasted. Monthly utility bills arrived weeks after consumption occurred. Submetering covered only main feeds, not individual lines or process stages. When leadership asked where the facility could cut 15% from resource costs to meet new ESG targets, the operations team had no data to answer the question.
Manual utility tracking told them totals. It could not tell them that Line 3's CIP cycles consumed 34% more water than identical cycles on Line 1 due to a valve that never fully closed. It could not reveal that the refrigeration compressors on the east wing ran 22% longer than the west wing because of condenser fouling.
And it could not quantify that weekend production shifts consumed 18% more energy per unit than weekday shifts due to HVAC scheduling that nobody had adjusted since the building opened.
After deploying AI-powered water and energy monitoring integrated with CMMS equipment data, the facility identified $1.1 million in recoverable resource waste within the first 90 days. Schedule a consultation to see how Oxmaint connects AI resource monitoring to the maintenance workflows that fix the equipment conditions driving excess consumption.
You Cannot Reduce What You Cannot Measure at the Process Level
AI resource monitoring reveals exactly where water and energy waste originates — by line, by process, by shift — and connects every anomaly to the equipment condition causing it.
How AI Water and Energy Monitoring Works in FMCG Plants
Traditional utility monitoring tells you how much water and energy your facility consumed last month. AI monitoring tells you why consumption deviated from expected levels on Line 4 during second shift last Tuesday — and which piece of equipment caused it. That specificity is the difference between paying utility bills and managing resource efficiency.
AI models establish dynamic baselines for every process, line, and piece of equipment based on production volume, product type, ambient conditions, and equipment state. Deviations from those baselines trigger investigation — not at the end of the month, but in real time. Sign up for Oxmaint to connect AI resource monitoring directly to the maintenance workflows that address the equipment root causes of excess consumption.
Process-Level Metering
Submeters on water and energy feeds capture consumption at every major process stage — CIP, heating, cooling, compressed air, packaging — not just facility totals.
AI Baseline Modeling
Machine learning establishes expected consumption per unit of production for every process, adjusted for product type, season, shift, and equipment condition.
Anomaly Detection
When consumption exceeds baseline, AI identifies the specific process, time window, and correlated equipment conditions — turning waste into an actionable finding.
CMMS Maintenance Loop
Equipment-related consumption anomalies generate Oxmaint work orders automatically — fixing the valve, cleaning the condenser, or recalibrating the controller causing waste.
What AI Monitors for Water and Energy Efficiency
FMCG plants consume water and energy through dozens of distinct process systems, each with different efficiency drivers, failure modes, and optimization opportunities. AI monitoring tracks the specific parameters that reveal waste in each system — not just total consumption, but consumption relative to production output and equipment condition. Book a demo to see how Oxmaint tracks resource efficiency alongside equipment health data.
CIP and Wash Systems
Refrigeration and Cooling
Steam and Heating
Compressed Air Systems
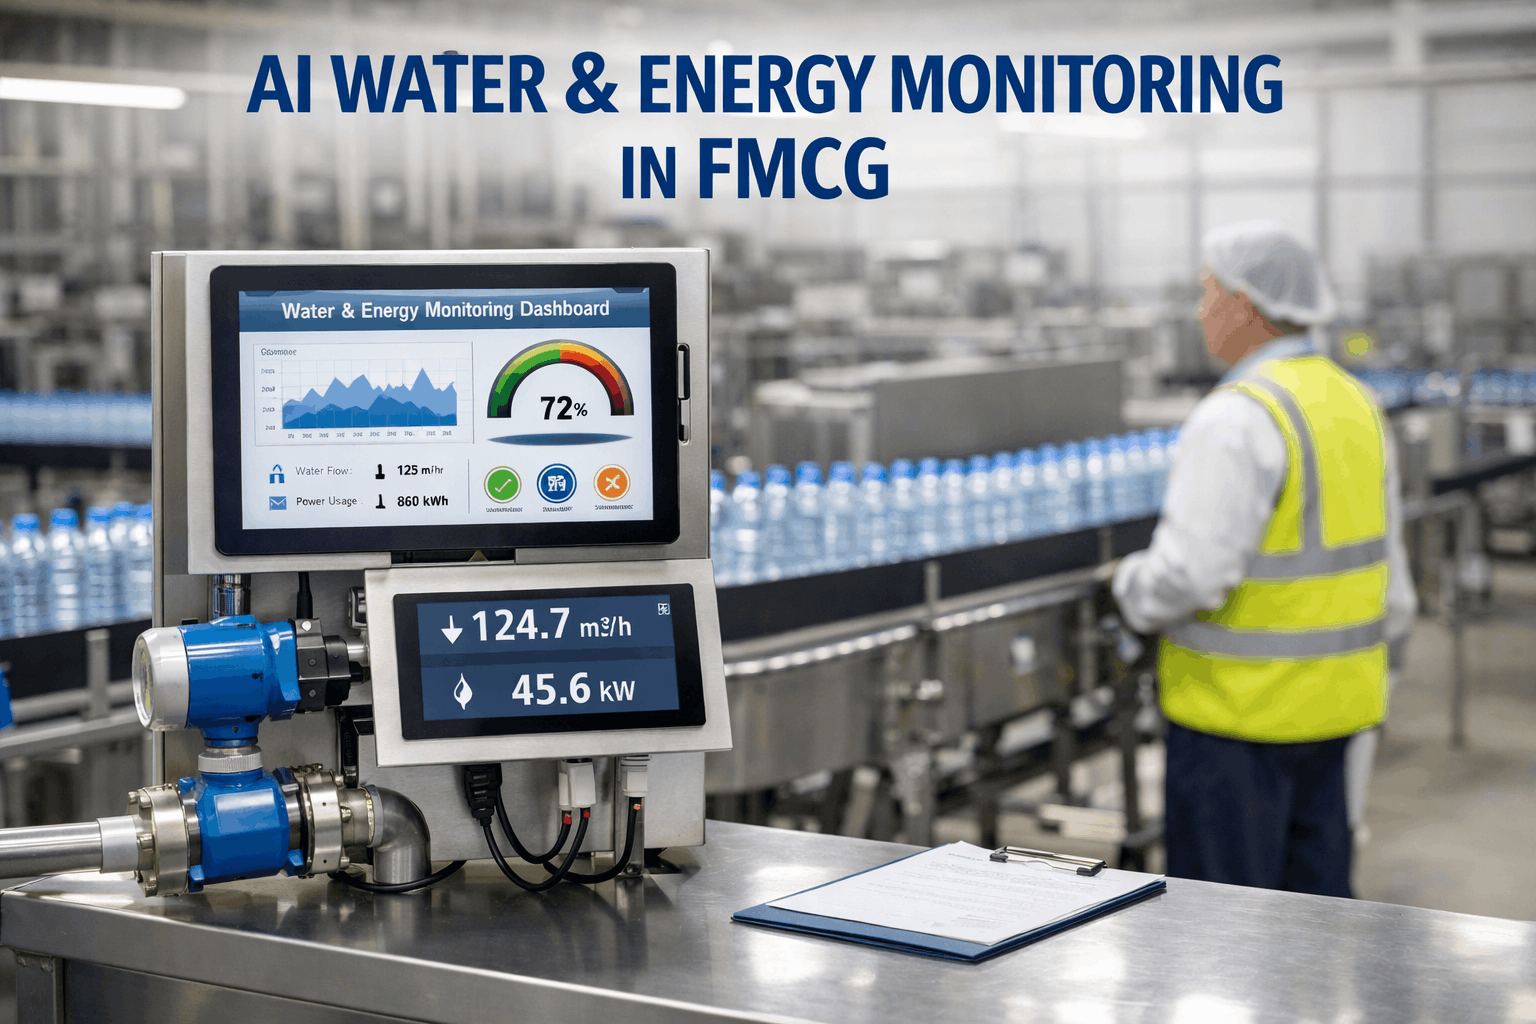
Live Resource Efficiency Dashboard
Monitor water and energy consumption across every process system from a single dashboard. Real-time efficiency scores, anomaly alerts, and equipment health correlations give operations and sustainability teams complete visibility into resource performance — not monthly summaries, but live data connected to maintenance actions.
See Where Every Dollar of Water and Energy Spend Goes
Real-time resource efficiency monitoring across every process system — with automatic work orders when equipment degradation drives excess consumption.
The Equipment–Resource Connection: Why CMMS Data Transforms Sustainability
The single most important insight in FMCG resource management is this: the majority of water and energy waste traces back to equipment conditions that maintenance teams can fix. A fouled condenser does not appear on a utility bill as "condenser fouling" — it appears as higher electricity consumption. A failing steam trap does not show up as "trap failure" — it shows up as increased boiler fuel use and higher water treatment costs.
AI resource monitoring without equipment condition data identifies that consumption is high but cannot explain why. Oxmaint closes this gap by correlating resource anomalies with CMMS equipment health data, turning vague "consumption is up" alerts into specific "CIP valve V-304 is not seating fully, consuming 1,200 extra gallons per cycle" findings with a maintenance work order attached. Sign up for Oxmaint to see how equipment condition intelligence transforms resource monitoring from reporting to remediation.
ESG Reporting and Sustainability Compliance
FMCG companies face intensifying pressure from retailers, investors, and regulators to document and reduce environmental impact. AI resource monitoring does not just cut costs — it generates the auditable, granular data that sustainability reporting frameworks demand.
Oxmaint's resource monitoring module produces ESG-ready data automatically. Every kilowatt-hour and gallon is traced to a specific process, shift, and product — enabling Scope 1 and Scope 2 emissions calculations, water intensity metrics, and year-over-year improvement tracking without manual data collection. Schedule a consultation to discuss how AI resource monitoring supports your specific ESG reporting requirements and retailer sustainability scorecards.
CDP and GRI Reporting
Retailer Sustainability Scores
Implementation Roadmap
Deploying AI water and energy monitoring builds on existing utility infrastructure and metering. Most FMCG plants achieve full process-level visibility within 8–10 weeks. The approach prioritizes the highest-consumption systems first to deliver measurable savings during implementation rather than after it.
Utility Audit and Meter Mapping
Catalog existing meters, identify submetering gaps, and prioritize high-consumption systems for process-level monitoring. Establish current consumption baselines from utility data and production records.
Submeter Installation and CMMS Integration
Install process-level water and energy meters on high-priority systems. Connect meter data streams to AI analytics platform and integrate with Oxmaint CMMS equipment health records for correlation analysis.
AI Baseline Development and Anomaly Tuning
AI models learn normal consumption patterns for each process, product, and shift combination. Anomaly detection thresholds calibrated to identify genuine waste without generating excessive false alerts.
Full Monitoring and ESG Reporting
All systems monitored with automated anomaly detection, CMMS-integrated work orders, resource efficiency dashboards, and ESG-ready reporting. Continuous optimization and expansion to secondary systems begins.
Frequently Asked Questions
Turn Utility Bills into Maintenance Work Orders
The majority of water and energy waste in FMCG plants traces back to equipment conditions maintenance teams can fix — but only if they know which equipment is causing the waste. Build the AI monitoring infrastructure that connects resource consumption to equipment health and generates the work orders that eliminate waste at the source.
Process-level resource visibility in weeks. Auditable ESG data from day one.