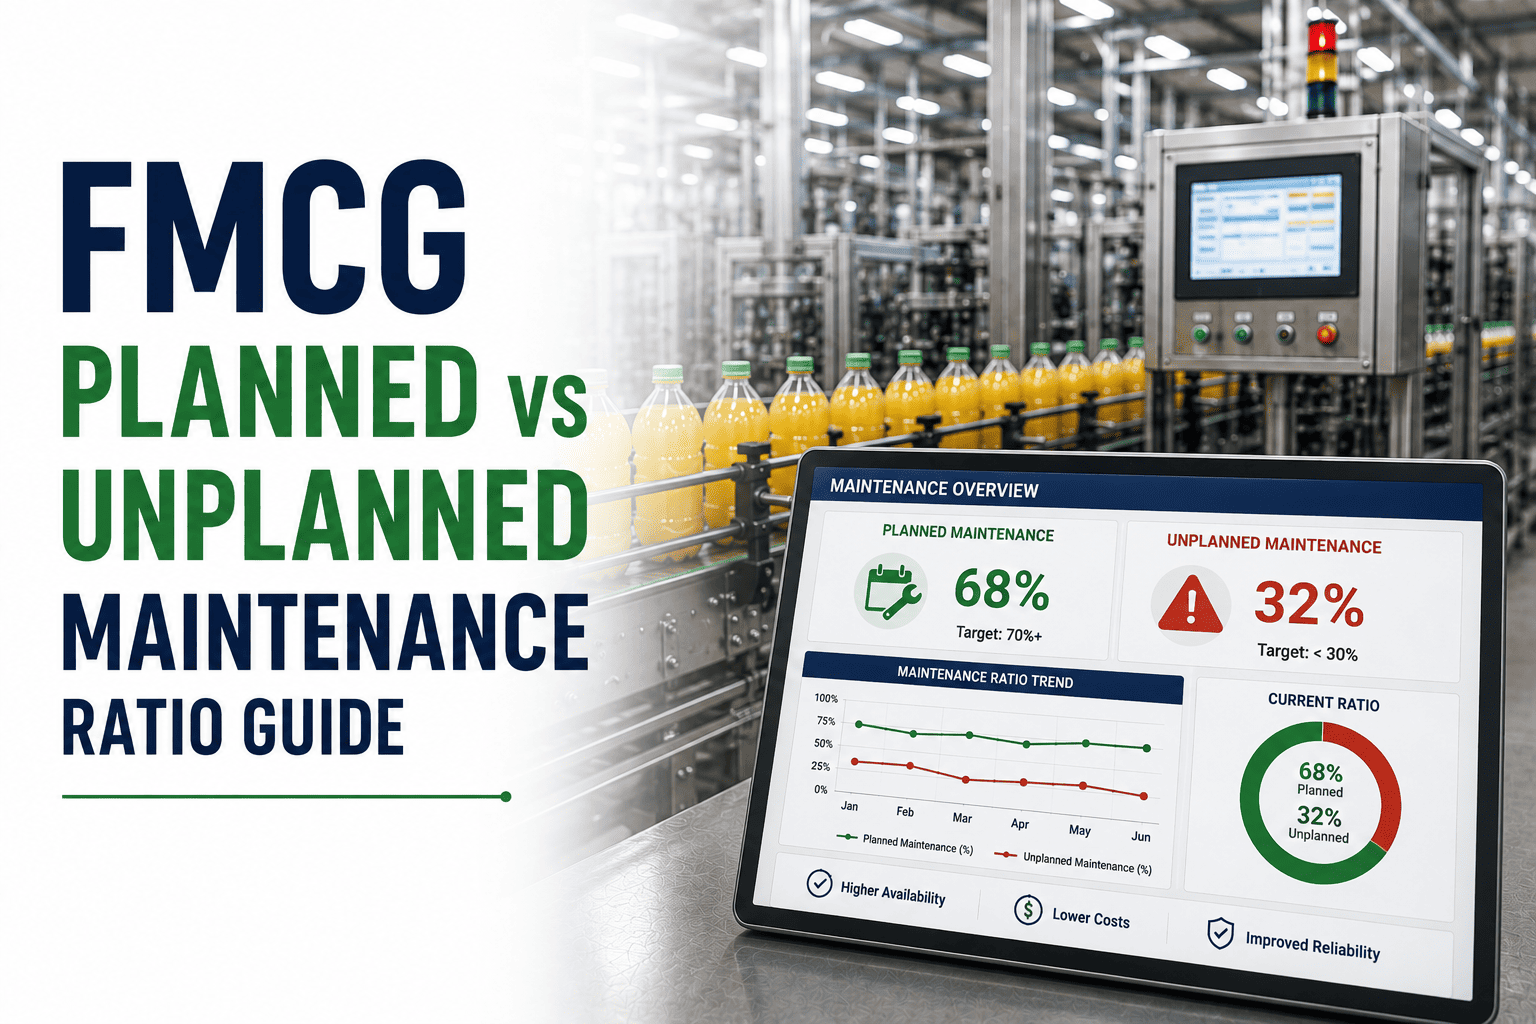
Most FMCG maintenance teams track two numbers: repair cost and downtime hours. These are lagging indicators — they tell you what already went wrong but reveal nothing about what is going wrong right now or what will go wrong next week. Meanwhile, the 10 other metrics that actually drive reliability improvement — PM compliance, first-time fix rate, planned-to-unplanned ratio, wrench time, spare parts turnover — go unmeasured because nobody built the dashboard. The result is a maintenance department that reacts to failures instead of preventing them, spends more than it should on emergency repairs, and cannot prove its value to plant leadership in financial terms. These 12 KPIs, tracked weekly in a single dashboard, transform maintenance from a cost center into a strategic asset that directly improves OEE, reduces unplanned downtime by 40–60%, and recovers $500K–$2M in annual production value. Start your free trial to see all 12 KPIs auto-calculated from your work order data. Book a demo to see OxMaint's Analytics and Reporting Dashboard on live FMCG plant data.
Analytics & Reporting Dashboard
All 12 KPIs. One Dashboard. Zero Spreadsheets.
OxMaint auto-calculates every maintenance KPI from your work order, downtime, and parts data — updated in real time so you always know where you stand and where to focus next.
12
essential KPIs that separate reactive from world-class maintenance
40–60%
downtime reduction when KPIs drive targeted improvement actions
$500K–$2M
annual value recovered through KPI-driven maintenance optimization
Why Most FMCG Plants Track the Wrong Metrics
Repair cost and downtime hours are the two most commonly tracked maintenance metrics — and the two least useful for driving improvement. Repair cost tells you what you spent but not whether you spent wisely. Downtime hours tell you how much time was lost but not why, where, or how to prevent the next event. They are rear-view mirror metrics in a discipline that needs a windshield.
Equipment health
Total downtime hours
MTBF trending up/down per asset
Repair quality
Total repair cost
First-time fix rate and repeat failures
Team effectiveness
Headcount and overtime hours
Wrench time % and PM compliance
Cost efficiency
Total maintenance budget
Maintenance cost per unit produced
The shift from lagging to leading indicators is the single most impactful change a maintenance leader can make. Leading indicators tell you what is changing right now — PM compliance dropping from 92% to 84% this month predicts increased breakdowns next month. MTBF on Filler 3 declining from 320 hours to 180 hours signals that a root cause analysis is overdue. These are actionable signals that create time to intervene before failures occur.
The 12 Essential Maintenance KPIs
These 12 metrics are organized into four categories: Equipment Reliability, Maintenance Execution, Cost Efficiency, and Inventory Management. Each KPI includes the formula, the world-class benchmark for FMCG, and the specific action it triggers when it moves in the wrong direction.
Equipment Reliability KPIs (1–4)
MTBF — Mean Time Between Failures
Total Operating Time ÷ Number of Failures
World-class FMCG400+ hours
Average FMCG plant120–200 hours
Track per asset weekly. Declining MTBF triggers root cause analysis on that specific asset.
400+ hrs
MTTR — Mean Time to Repair
Total Repair Time ÷ Number of Repairs
World-class FMCG<1.5 hours
Average FMCG plant3–5 hours
High MTTR signals parts availability, diagnostic, or skill gaps. Break into diagnosis time + repair time + restart time to find the bottleneck.
<1.5 hrs
Equipment Availability
(Planned Time - Downtime) ÷ Planned Time × 100
World-class FMCG92%+
Average FMCG plant78–85%
The availability component of OEE. Pareto by loss category (breakdowns, changeovers, cleaning) to target the biggest availability thief.
92%+
Planned vs. Unplanned Ratio
Planned Maintenance Hours ÷ Total Maintenance Hours × 100
World-class FMCG85%+ planned
Average FMCG plant45–55% planned
The single most important maintenance maturity indicator. Below 60% means your team is firefighting. Every 5-point increase toward 85% reduces total downtime 8–12%.
85%+ planned
Maintenance Execution KPIs (5–8)
PM Compliance Rate
PM Tasks Completed On Time ÷ PM Tasks Scheduled × 100
World-class FMCG95%+
Average FMCG plant70–80%
Below 90% means PM tasks are being deferred — and deferred PM becomes unplanned breakdown within 30–90 days. Track by asset criticality, not just overall.
95%+
First-Time Fix Rate
Repairs Completed First Visit ÷ Total Repair Attempts × 100
World-class FMCG90%+
Average FMCG plant65–75%
Low FTFR means repeat visits — double the labor cost, double the downtime. Root causes are usually missing parts, incomplete diagnosis, or skill gaps.
90%+
Wrench Time
Time Actively Repairing ÷ Total Shift Time × 100
World-class FMCG55–65%
Average FMCG plant25–35%
Technicians spend 65–75% of their shift not repairing — walking, waiting for parts, searching for information, getting approvals. Improving wrench time is a planning problem, not a people problem.
55–65%
Work Order Backlog (Weeks)
Open WO Labor Hours ÷ Available Weekly Labor Hours
World-class FMCG2–4 weeks
Average FMCG plant6–12 weeks
Above 6 weeks means work is accumulating faster than your team can complete it. Either reduce incoming work (improve reliability) or increase capacity (hire, outsource, or improve wrench time).
2–4 weeks
Auto-Calculated KPIs
Stop Calculating KPIs Manually. Let Your CMMS Do the Math.
OxMaint calculates all 12 KPIs automatically from work order completions, downtime logs, and parts transactions — updated in real time on dashboards visible to technicians, supervisors, and plant leadership.
Cost Efficiency KPIs (9–10)
Maintenance Cost Per Unit Produced
Total Maintenance Cost ÷ Total Units Produced
World-class FMCG$0.01–$0.04/unit
Average FMCG plant$0.04–$0.08/unit
The metric that connects maintenance to finance. Declining cost per unit means maintenance is getting more efficient as production scales. Rising cost per unit triggers investigation.
$0.01–$0.04
Maintenance Cost as % of RAV
Annual Maintenance Cost ÷ Replacement Asset Value × 100
World-class FMCG2–3% of RAV
Average FMCG plant4–6% of RAV
Above 5% means you are spending too much on maintenance relative to asset value — usually from excessive reactive work. Below 2% means you may be undermaintaining and heading for reliability problems.
2–3% RAV
Inventory Management KPIs (11–12)
Spare Parts Turnover Ratio
Annual Parts Consumption ÷ Average Parts Inventory Value
World-class FMCG2.0–3.0x/year
Average FMCG plant0.8–1.5x/year
Below 1.0x means you are carrying dead stock — parts sitting in the storeroom that will never be used. Audit parts with zero consumption in 24 months and either return, sell, or write off.
2.0–3.0x
Stockout Rate (Critical Parts)
WOs Delayed Due to Missing Parts ÷ Total WOs × 100
World-class FMCG<2%
Average FMCG plant8–15%
Every stockout extends MTTR by 4–24 hours (waiting for parts). Track which parts cause stockouts most frequently and adjust reorder points. This single fix improves first-time fix rate by 10–15 points.
<2%
What Each KPI Improvement Is Actually Worth
KPIs are only valuable if they connect to dollars. Here is what moving each key metric by a realistic improvement increment is worth annually for a typical 5-line FMCG plant producing $12,000/hr in product value.
+5 pts PM Compliance
$185K/yr
Prevents 2–3 additional breakdowns per year that deferred PM would have caused
+100 hrs MTBF
$340K/yr
Fewer failures = fewer emergency stops, less scrap, less overtime, less cascade damage
-1 hr MTTR
$144K/yr
Each failure resolved 1 hour faster across 12 events/yr at $12K/hr production value
+10 pts Planned %
$420K/yr
Every 10 points toward 85% planned reduces total downtime 15–20% and emergency costs 25%
+10 pts Wrench Time
$96K/yr
10% more productive time from existing team = equivalent of 0.8 additional technician FTE
+15 pts FTFR
$165K/yr
15% fewer repeat visits = 15% less total repair time, parts waste, and production disruption
Total Value of KPI-Driven Improvement: $1.35M/yr at a 5-Line FMCG Plant
The planned-to-unplanned ratio delivers the highest dollar value per point of improvement because it acts as a multiplier — shifting work from reactive (expensive, disruptive, wasteful) to planned (efficient, scheduled, low-impact). This is why it is the single most important KPI for maintenance leaders to move.
How KPIs Connect: The Cause-and-Effect Chain
These 12 KPIs are not independent — they form a cause-and-effect chain where improving upstream metrics automatically pulls downstream metrics in the right direction. Understanding these connections prevents teams from chasing symptoms instead of causes.
PM Compliance (95%+)
→
MTBF rises, unplanned % drops, availability increases
Stockout Rate (<2%)
→
FTFR rises, MTTR drops, wrench time improves
Wrench Time (55%+)
→
Backlog shrinks, PM compliance rises, cost per unit drops
MTBF (400+ hrs)
→
Planned % rises, availability increases, cost as % RAV drops
FTFR (90%+)
→
MTTR drops, backlog shrinks, wrench time improves, cost per unit drops
The most powerful intervention point is PM Compliance — because it sits at the top of the cause-and-effect chain. A plant that fixes PM compliance to 95%+ will see MTBF rise within 60–90 days, which reduces unplanned work, which frees technician time for more planned work, which further improves MTBF. It is a virtuous cycle — and PM compliance is the ignition switch.
Where Does Your Plant Stand? The Maturity Scorecard
Plot your current performance against these benchmarks. Plants in the "reactive" zone on 4+ KPIs have the most to gain — and typically see the fastest improvement because low-hanging fruit is abundant. Plants in the "proactive" zone across most KPIs should focus on the 2–3 KPIs still lagging.
MTBF
<100 hrs
100–250 hrs
250–400 hrs
400+ hrs
MTTR
>5 hrs
3–5 hrs
1.5–3 hrs
<1.5 hrs
Planned %
<40%
40–65%
65–85%
85%+
PM Compliance
<60%
60–80%
80–95%
95%+
Wrench Time
<25%
25–40%
40–55%
55–65%
FTFR
<60%
60–75%
75–90%
90%+
The planned-to-unplanned ratio is the single most diagnostic KPI on this scorecard. A plant at 45% planned is in reactive mode regardless of how other KPIs look — because the majority of maintenance activity is responding to failures rather than preventing them. Moving from 45% to 70% planned typically improves every other KPI simultaneously because planned work is 3–5x more efficient than emergency work on every dimension: cost, duration, quality, and safety.
How to Start: The 30-Day KPI Launch Plan
Week 1
Pick Your Starting Five
Do not launch all 12 KPIs at once. Start with: MTBF, MTTR, PM Compliance, Planned %, and Maintenance Cost Per Unit. These five tell the complete reliability story and are calculable from basic CMMS data.
Week 2
Establish Your Baseline
Pull 3–6 months of historical data from your CMMS. Calculate each KPI and plot where you stand on the maturity scorecard. This baseline becomes the benchmark against which all improvement is measured.
Week 3
Build the Dashboard
Create a single-page dashboard showing all five KPIs with current value, trend direction, and target. Make it visible — wall-mounted screen in the maintenance office, emailed weekly to plant leadership. Visibility creates accountability.
Week 4
Start the Weekly KPI Review
15-minute weekly meeting: maintenance lead reviews each KPI, identifies which moved in the wrong direction, and assigns one specific improvement action per red KPI. This weekly rhythm turns data into action and action into results.
Frequently Asked Questions
Analytics & Reporting Dashboard
Measure What Matters. Improve What You Measure.
Real-Time
dashboard updates
Trusted by FMCG maintenance teams worldwide. No credit card required.