FMCG Maintenance KPI Dashboard: 15 Metrics Every Plant Manager Must Track
By spencer on March 6, 2026
A beverage plant manager in Texas was asked by her VP of Operations to explain why maintenance costs had increased 18% year-over-year while equipment reliability had declined. She had no answer — not because the data didn't exist, but because it lived in four separate systems, none of which talked to each other. The CMMS had work order data. The ERP had cost data. The SCADA had runtime data. And the spreadsheet tracking PM compliance was updated monthly at best. Without a unified KPI dashboard, the early warning signals had been there for six months — rising corrective-to-preventive ratios, a creeping maintenance backlog, declining wrench time, and MTTR trending upward on the two highest-cost filling lines. None of it was visible until the damage was done. This is not a data problem — it is a visibility problem. Every FMCG plant generates enough data to manage maintenance with precision. The gap between plants that do and plants that don't is a KPI dashboard that surfaces the right 15 metrics, in real time, to the people who can act on them. Start your free trial today or schedule a 30-minute demo to see how Oxmaint builds this dashboard for your plant automatically.
Managing Maintenance Without a KPI Dashboard vs. With One
The operational and financial gap between flying blind and managing by data in FMCG manufacturing
Without a KPI Dashboard
When Problems Become Visible
After financial impact has occurred
Maintenance Budget Defence
Anecdotal — "we've been busy"
Technician Deployment
Whoever shouts loudest gets the resource
Continuous Improvement Basis
Gut feel and post-mortems
With a KPI Dashboard
When Problems Become Visible
4–8 weeks before financial impact
Maintenance Budget Defence
Data-backed ROI — cost per unit, avoided failures
Technician Deployment
Highest-risk, highest-cost assets first
Continuous Improvement Basis
Trend analysis on 15 leading and lagging indicators
Plants With Real-Time KPI Dashboards Report: 22–31% Lower Total Maintenance Cost Within 18 Months
How to Organise Your 15 KPIs: The Four Dashboard Tiers
Not all maintenance KPIs belong on the same screen or serve the same audience. Before building your dashboard, organising the 15 metrics into four functional tiers ensures that each level of your organisation sees the data most relevant to their decisions — without information overload that causes the critical signals to get buried. The tier structure below maps directly to the four layers of maintenance management that exist in every FMCG plant, from shop floor to boardroom.
The Four KPI Dashboard Tiers for FMCG Plants
Reliability → Productivity → Cost → Strategic
Tier Structure and Primary Audience
1
Reliability Tier (KPIs 1–4): Equipment health and failure performance — owned by reliability engineers and maintenance supervisors. Reviewed daily
2
Productivity Tier (KPIs 5–8): Maintenance team efficiency and work order performance — owned by maintenance managers. Reviewed weekly
3
Cost Tier (KPIs 9–12): Financial performance of the maintenance function — owned by plant managers and finance. Reviewed monthly
4
Strategic Tier (KPIs 13–15): Long-term reliability and robotic system performance — owned by plant directors and VP Operations. Reviewed quarterly
The 15 KPIs work as a system, not in isolation. A rising MTTR (Tier 1) combined with a growing maintenance backlog (Tier 2) and increasing emergency repair spend (Tier 3) tells a connected story about resource allocation — one that no single metric would reveal alone. Building a dashboard that shows all four tiers in one view is what enables plant managers to see those connections before they compound.
Tier 1: Reliability KPIs (1–4) — Daily Visibility Into Equipment Health
Reliability KPIs measure the fundamental question every FMCG maintenance team exists to answer: how often does equipment fail, how quickly is it restored, and what percentage of total time is it actually available for production? These four metrics are the bedrock of any maintenance KPI programme — if you only track four metrics, these are the ones. They are also the metrics with the clearest direct link to production throughput and revenue, which makes them the most persuasive data for communicating maintenance value to operations leadership.
Rising MTBF = improving equipment reliability. Declining MTBF on a specific asset is the earliest warning signal that maintenance intervals, lubrication, or operating conditions need attention — weeks before a costly failure.
MTTR measures maintenance response and execution efficiency. A rising MTTR is usually caused by three things: parts unavailability, technician skill gaps, or inadequate diagnostic data. Each has a different fix — and the dashboard surfaces which one is the driver.
OEE is the single metric that connects maintenance performance to production output. Track it at the line level, not the plant average — a 91% plant OEE can hide a 58% OEE on your highest-cost line that is dragging the entire facility's profitability.
KPI 04
Equipment Availability Rate
Availability = (Total Time − Downtime) ÷ Total Time × 100
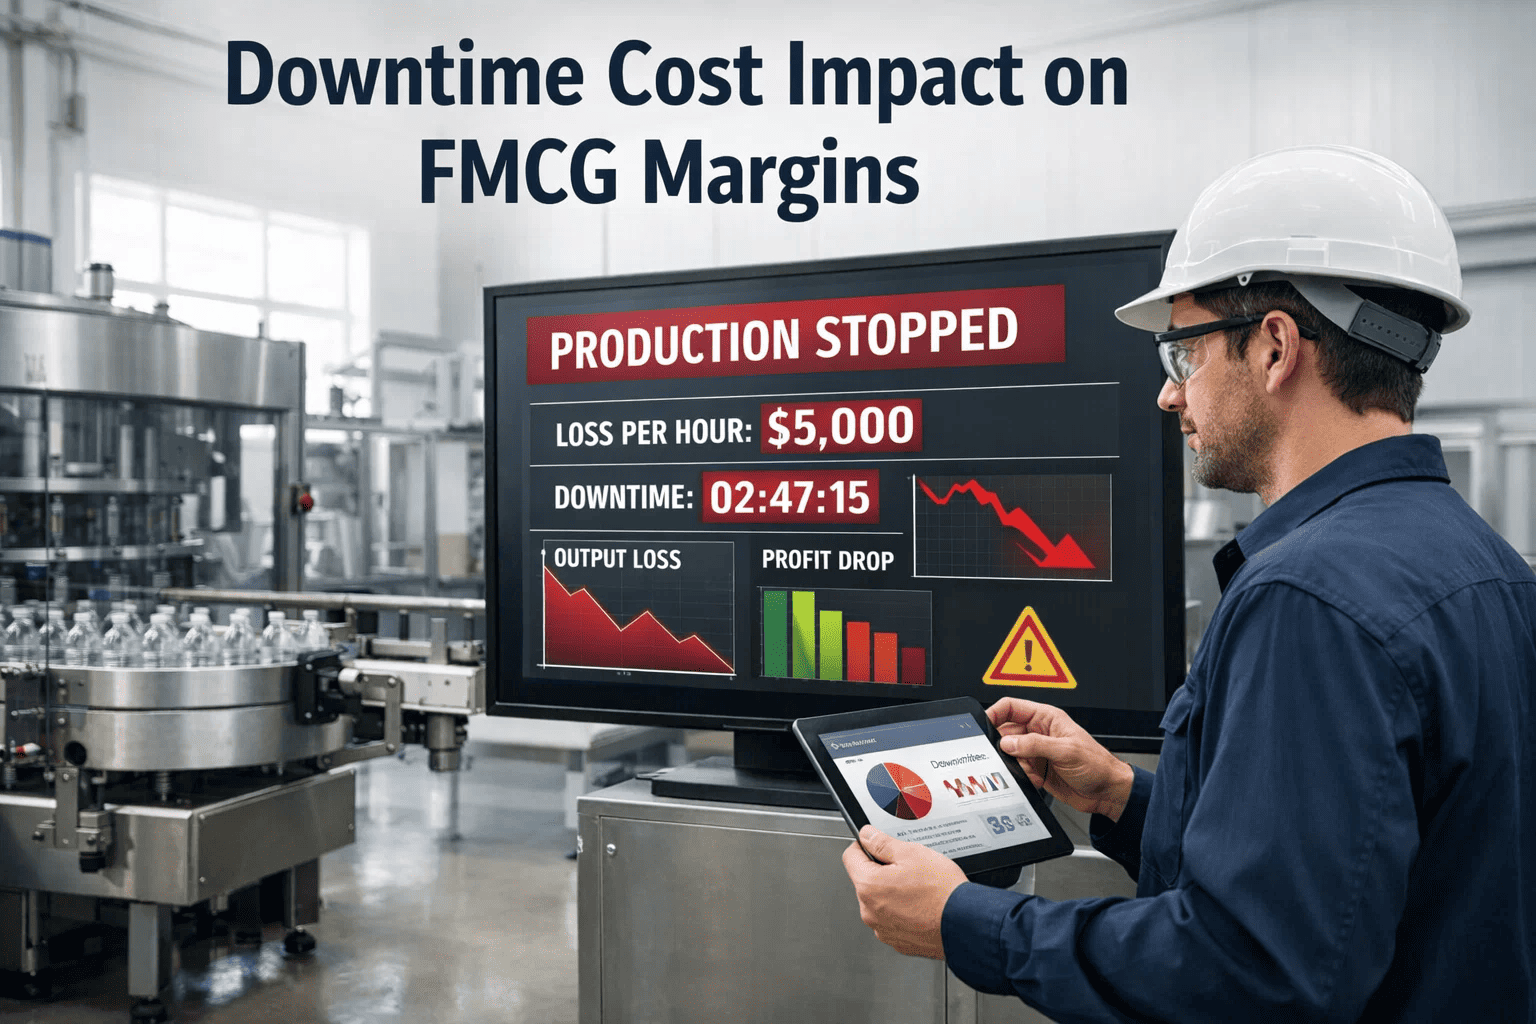
Availability is the maintenance team's primary contribution to production capacity. Track planned and unplanned downtime separately — planned maintenance downtime is evidence of a working PM programme, while unplanned downtime is pure failure cost that the dashboard should flag immediately.
Tier 2: Productivity KPIs (5–8) — Weekly Visibility Into Team Efficiency
Productivity KPIs measure how efficiently your maintenance resources are being deployed. A maintenance team that spends 60% of its hours on reactive firefighting is not twice as bad as one spending 30% — it is structurally incapable of the proactive work that prevents failures from occurring in the first place. These four metrics tell you whether your maintenance programme is functioning as a proactive reliability operation or a reactive emergency response team — and they quantify the productivity improvement as you shift the balance.
Tier 2: Productivity KPIs
KPIs 5–8: Team Efficiency and Work Order Performance
PM compliance is the leading indicator for future failure rates. A plant running at 70% PM compliance has effectively abandoned preventive maintenance on 30% of its asset base. Track compliance by asset criticality tier, not just overall — missing a PM on a non-critical conveyor is very different from missing one on your primary filling line.
KPI 06
Wrench Time (Productive Maintenance Time)
Wrench Time = Actual Repair/Maintenance Time ÷ Total Shift Hours × 100
FMCG Target: Best-in-class ≥ 55% | Good ≥ 45% | Industry average 25–35%
Industry data consistently shows FMCG maintenance technicians spend only 25–35% of their shift on actual hands-on maintenance work. The rest goes to travel, parts hunting, paperwork, waiting, and diagnostics. Every percentage point of wrench time improvement is equivalent to adding capacity without adding headcount.
KPI 07
Work Order Completion Rate
Completion Rate = Completed WOs ÷ Total WOs Created × 100 (rolling 30 days)
FMCG Target: ≥ 90% within SLA | P1 emergency ≤ 4 hrs | P2 same shift | P3 within 48 hrs
Work order completion rate is the operational pulse of your maintenance function. A declining rate typically signals one of three problems: insufficient technician capacity, a poorly calibrated priority system, or a growing backlog that is crowding out planned work. The dashboard should show completion rate by priority tier to isolate which problem is driving the trend.
KPI 08
Maintenance Backlog (in Hours)
Backlog = Total Open WO Hours ÷ Available Technician Hours per Week
A maintenance backlog of 2–4 weeks is healthy — it means you have planned work queued ahead of your team's capacity without stressing the system. Below 2 weeks suggests understaffed planned work or over-reliance on reactive. Above 6 weeks, the backlog is growing faster than the team can consume it — which predicts rising failure rates within 8–12 weeks.
Cost KPIs translate maintenance performance into the financial language that plant directors, CFOs, and operations VPs use to evaluate facility competitiveness. Tracking these four metrics monthly — and trending them against a rolling 12-month baseline — gives plant managers the data they need to defend maintenance budgets, justify technology investments, and demonstrate the financial return of their reliability programme in terms that resonate at every level of the organisation.
Tier 3: Cost KPIs
KPIs 9–12: Maintenance Financial Performance
KPI 09
Maintenance Cost as % of Replacement Asset Value (RAV)
Maintenance Cost % RAV = Annual Maintenance Spend ÷ Total Asset Replacement Value × 100
RAV-based benchmarking is the most reliable way to compare maintenance cost efficiency across different plants, since it normalises for facility size and asset complexity. A plant spending 6% of RAV on maintenance when peers spend 2.5% has a $1.4M–$2.8M annual cost gap to close — and this KPI makes that gap visible and defensible to leadership.
KPI 10
Corrective-to-Preventive Maintenance Ratio
C:P Ratio = Corrective Maintenance Hours ÷ Preventive Maintenance Hours
This ratio is a direct measure of whether your maintenance culture is reactive or proactive. Most FMCG plants run at 50:50 or worse without realising it. Improving the ratio from 50:50 to 30:70 typically reduces total maintenance cost by 18–24% within 12 months — making it one of the highest-leverage single metrics on this dashboard.
KPI 11
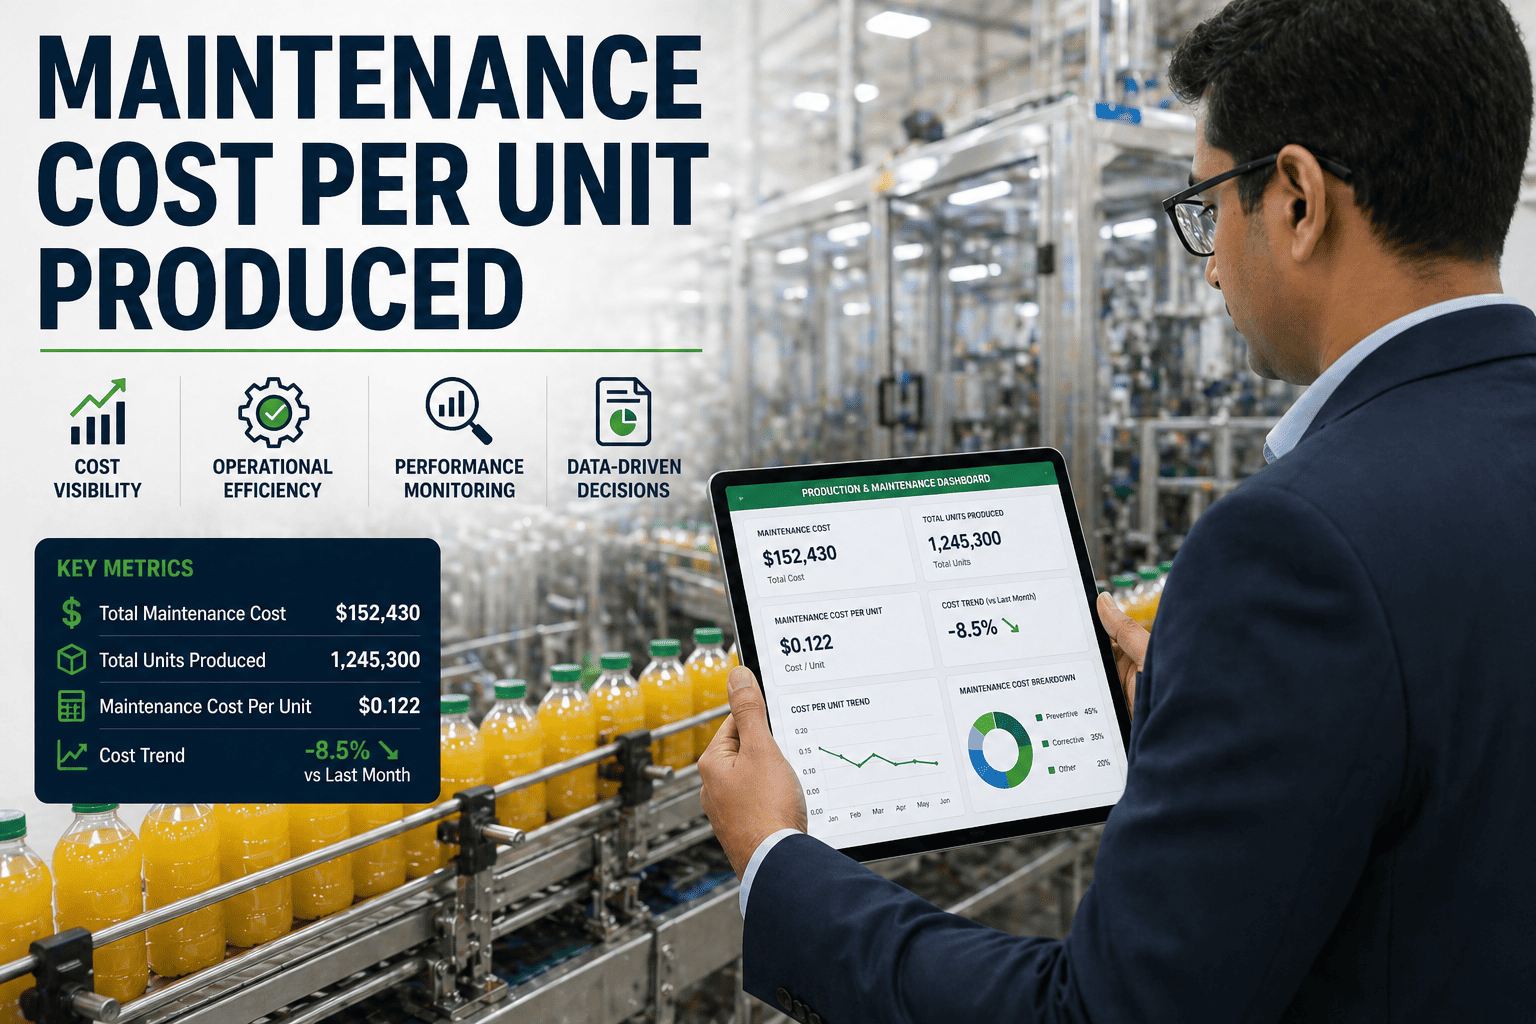
Maintenance Cost per Unit Produced
Cost per Unit = Total Maintenance Spend ÷ Units Produced (rolling 30-day period)
FMCG Target: Trend-based — target is consistent YoY reduction of 5–12% annually
This KPI connects maintenance performance to manufacturing cost-per-unit — the metric production finance teams actually care about. It accounts for both maintenance spend and throughput simultaneously, which means it naturally improves when you prevent failures (lower spend) and when you improve OEE (higher units). Track it by line, not just plant-wide.
KPI 12
Emergency Maintenance Spend Ratio
Emergency Ratio = Emergency Maintenance Spend ÷ Total Maintenance Spend × 100
Emergency spend is the single most expensive maintenance cost category — carrying a 2.8–4.7x premium over planned maintenance rates due to overtime, expedited parts, and cascade damage. A plant spending 40% of its maintenance budget on emergency work is paying a £600K–£1.4M annual tax on poor reliability that this KPI makes impossible to ignore.
Strategic KPIs operate on longer time horizons and measure the structural health of your maintenance programme — the trends that determine whether your facility is becoming more reliable and competitive year over year, or drifting toward increasing costs and decreasing equipment performance. For FMCG plants with robotic systems, KPI 15 is particularly critical: robotic availability directly determines throughput capacity on your highest-speed production lines, and its degradation is often the last thing tracked because robots feel less urgent than mechanical breakdowns — until they aren't.
Tier 4: Strategic KPIs
KPIs 13–15: Long-Term Reliability and Robotic Performance
PMP is the strategic outcome KPI for your entire reliability programme. Every improvement in MTBF, PM compliance, and predictive maintenance adoption should be visible as an improvement in PMP over time. Plants that reach 85%+ PMP consistently report 25–35% lower total maintenance costs than those running below 55% — the gap compounds annually.
KPI 14
Spare Parts Inventory Turnover
Parts Turnover = Annual Parts Consumed ÷ Average Inventory Value × 100
Spare parts inventory represents $400K–$1.2M in tied-up capital for a typical FMCG plant, and most of it sits unused. Low turnover rates signal over-stocked insurance spares that tie up working capital. High turnover rates signal understocked critical spares that will cause emergency procurement costs when they run out. Predictive maintenance changes this dynamic by making demand forecastable — which is reflected directly in improving turnover rates.
Robotic systems in FMCG operate at speeds and precision tolerances where 1% availability loss translates directly to throughput reduction. A palletising robot at 94% availability costs 2% of its line's production capacity — invisible in aggregate plant data but significant at the line level. Track robot MTBF separately from mechanical equipment MTBF: a declining robotic MTBF is almost always a sign of lubrication, calibration, or path programming issues that are far cheaper to address proactively than reactively.
KPI Benchmark Reference: Where FMCG Plants Stand Today
Knowing your current KPI values means little without industry context. The benchmark table below provides the reactive average, industry average, and best-in-class target for all 15 KPIs — giving plant managers a clear view of where their facility sits on each metric and what improvement is achievable within 12–18 months of systematic dashboard-driven management.
All 15 KPIs: FMCG Industry Benchmarks
Reactive average vs. industry average vs. best-in-class across FMCG manufacturing facilities globally
KPI
Industry Average
Best-in-Class
MTBF — Filling Lines
180–280 hours
480–720 hours
MTTR — Critical Assets
4.8–7.2 hours
1.2–2.5 hours
OEE — Primary Lines
68–74%
85–92%
Equipment Availability
82–87%
92–97%
PM Compliance Rate
68–78%
92–98%
Wrench Time
25–35%
52–62%
Work Order Completion Rate
62–74%
88–95%
Maintenance Backlog
6–10 weeks
2–3 weeks
Maintenance Cost % RAV
4–7%
1.5–2.5%
Corrective-to-Preventive Ratio
48:52 — 55:45
18:82 — 22:78
Maintenance Cost per Unit
Baseline year + 3–8% annually
Baseline year − 5–12% annually
Emergency Spend Ratio
32–48% of total
6–12% of total
Planned Maintenance Percentage
48–62%
82–90%
Spare Parts Inventory Turnover
0.3–0.6x annually
0.9–1.3x annually
Robotic System Availability
88–93%
96–99%
The financial gap between industry average and best-in-class performance across all 15 KPIs equates to $800K–$2.1M in annual maintenance cost savings for a mid-size FMCG plant — achievable within 18–24 months of systematic KPI-driven management with the right CMMS platform.
How Oxmaint Builds Your 15-KPI Dashboard Automatically
The reason most FMCG plants don't have a live 15-KPI maintenance dashboard is not lack of data — it is the effort required to assemble that data from multiple disconnected systems in real time. Oxmaint eliminates that barrier by capturing every maintenance event, work order, PM completion, parts transaction, and equipment runtime in a single connected data structure — generating all 15 KPIs automatically, updated in real time, without any manual reporting effort from your maintenance team.
How Oxmaint Generates All 15 KPIs Automatically
Real-Time Data Capture
Live
Every work order opened, completed, or overdue updates KPIs instantly — no end-of-day reporting, no manual data entry, no spreadsheet reconciliation
IoT & SCADA Integration
Connected
Equipment runtime, downtime events, and sensor data stream directly into Oxmaint — MTBF, MTTR, and OEE calculated automatically from live equipment data
Role-Based Dashboard Views
4 Tiers
Technicians see their work queue. Supervisors see team productivity. Managers see cost KPIs. Plant directors see strategic trends. One platform, four views
Automated Threshold Alerts
Proactive
Set upper and lower bounds on any KPI — Oxmaint alerts the right person automatically when a metric crosses its threshold before the trend becomes a crisis
Scheduled KPI Reports
Automated
Daily, weekly, and monthly KPI reports emailed automatically to configured recipients — eliminating the manual reporting burden that prevents most plants from tracking metrics consistently
Trend Analysis Engine
12-Month
Rolling 12-month trend lines on all 15 KPIs reveal the directional story that point-in-time snapshots miss — the compounding improvements that validate your reliability investment
The Financial Impact of Tracking All 15 KPIs
The business case for a 15-KPI maintenance dashboard is not about the dashboard itself — it is about the decisions the dashboard enables. Every KPI on this list has a direct financial consequence when it moves in the right direction. The ROI calculation below models the annual financial impact for a mid-size FMCG plant that moves each KPI from industry average to best-in-class over an 18-month period.
Annual Financial Impact: Moving From Industry Average to Best-in-Class
Mid-size FMCG plant — 4 production lines — $120M annual output — 14-person maintenance team
MTBF Improvement (KPI 01)
Filling line MTBF 220 hrs → 560 hrs: 68% reduction in failure events × $42K avg cost per event
$520K
MTTR Reduction (KPI 02)
MTTR 5.8 hrs → 2.1 hrs: 190 recovered production hours × $1,600/hr avg line value
Oxmaint platform cost for a 14-person team, 4-line facility: $60K–$90K annually. Net ROI from KPI-driven improvements: $1.50M–$1.53M. Return: 17–25x platform investment. The dashboard does not create the savings — it makes the problems visible fast enough that your team can act on them before they compound.
Frequently Asked Questions
Start with the four Tier 1 reliability KPIs — MTBF, MTTR, OEE, and Equipment Availability — plus the Emergency Spend Ratio. These five require data you already collect in your CMMS and ERP, and they show the fastest improvement once action begins. Get them live and accurate before expanding to the full 15.
Tier 1 reliability KPIs daily at shift start, Tier 2 productivity KPIs in the weekly team review, Tier 3 cost KPIs monthly in plant leadership meetings, and Tier 4 strategic KPIs quarterly by plant directors and VP Operations. The review cadence matters as much as the metrics — KPIs not discussed in structured forums don't drive behaviour change.
Through work order time-stamping via mobile CMMS — technicians log start, pause, and completion from the shop floor, creating an exact record of hands-on time vs. travel, parts hunting, and admin. Most plants discover wrench time is 15–20 points lower than estimated once they measure it for the first time.
2–4 weeks of work against available technician capacity is the healthy range. Below 2 weeks signals insufficient planned work; above 6 weeks means the backlog is growing faster than your team can clear it — a reliable predictor of rising failure rates within 8–12 weeks. Always track backlog in hours, not work order count.
Robotic KPIs need three additional dimensions beyond standard MTBF and availability: calibration accuracy trending, path repeatability scoring, and vision system confidence scores. Track at the joint and subsystem level — a robot at 97% availability can have one joint with 14% excess torque variance that will cause a placement failure within 6–8 weeks if unaddressed.
Oxmaint pulls availability from downtime records, performance rate from PLC/SCADA line speed data, and quality rate from production or inspection systems — multiplying the three in real time to produce a continuously updated OEE score at the individual line level. Where SCADA integration isn't live yet, operators log micro-stoppages via the mobile interface. Start your free trial to see it on your lines.
Your Plant Is Already Generating All 15 KPIs. Oxmaint Just Makes Them Visible.
Every work order, PM, downtime event, and parts transaction your team completes today is data that should be driving tomorrow's maintenance decisions. Oxmaint connects those data points automatically — delivering a live 15-KPI dashboard to every tier of your organisation without a single hour of manual reporting.