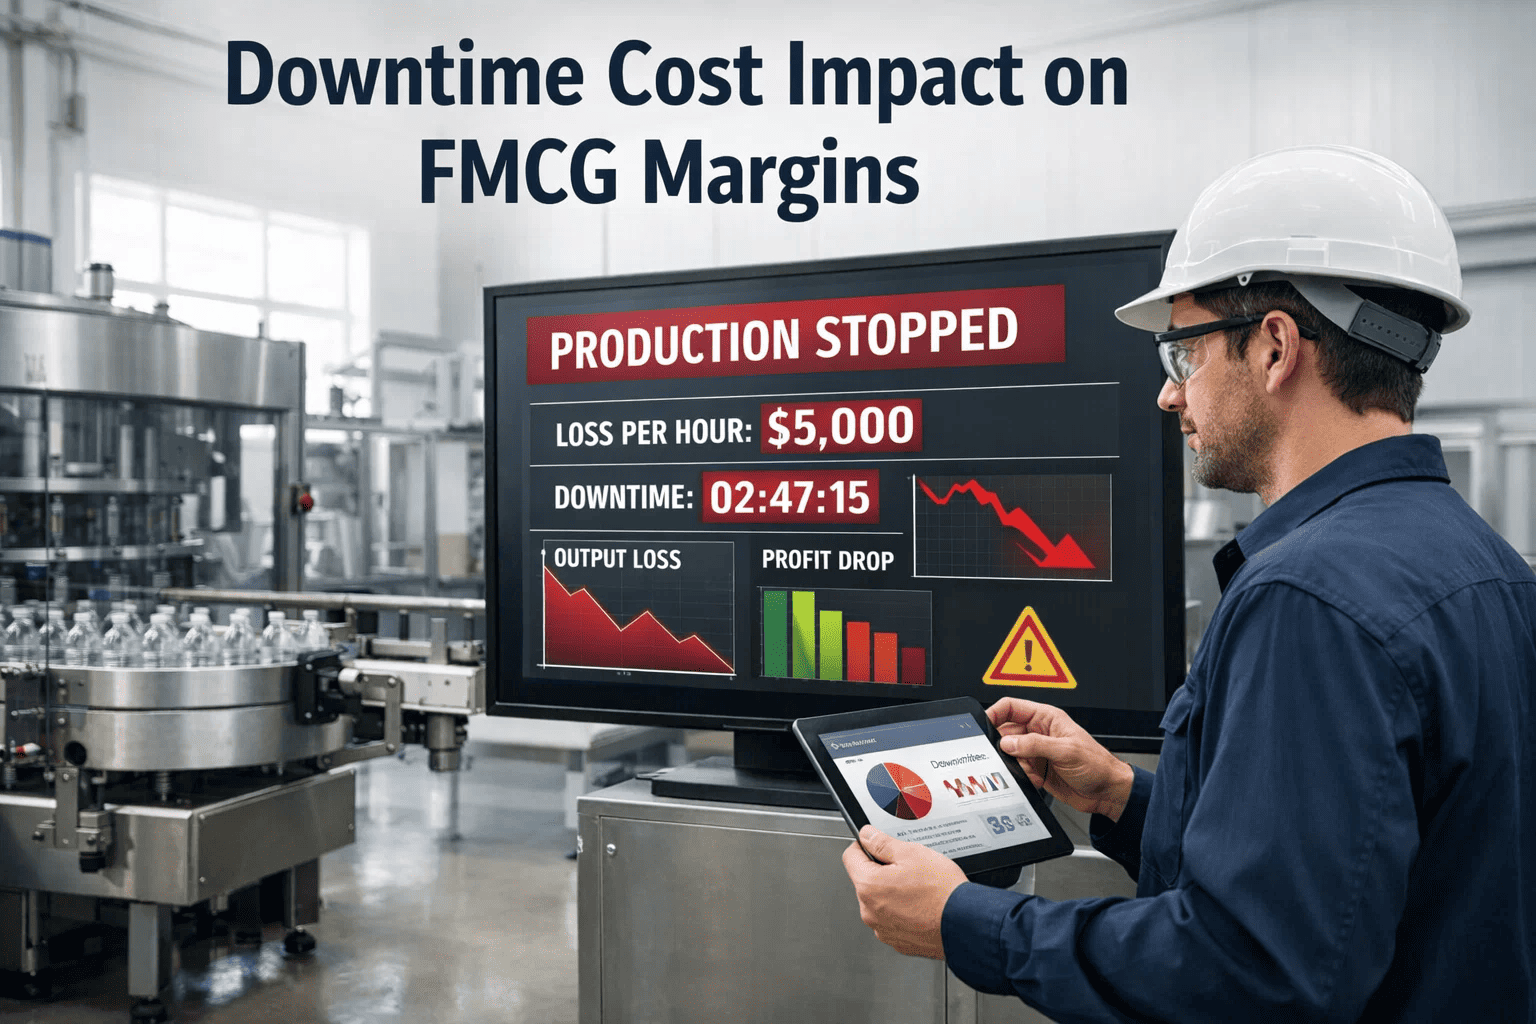
An FMCG packaging line generating $18,000 per hour in product value does not lose $18,000 when it stops unexpectedly. It loses $18,000 in production value, plus $4,200 in scrapped in-process product, plus $2,800 in overtime to recover, plus $1,600 in expedited shipping to meet delivery commitments — a total of $26,600 per hour that compounds with every minute the line stays down. Multiply that by the 180–340 hours of unplanned downtime the average FMCG plant accumulates annually, and the hidden cost reaches $1.2M–$2.8M per year — buried across maintenance budgets, production variance reports, and logistics penalty charges where no single person sees the full picture. This guide shows how data-driven maintenance strategies cut that number by 40–60% within 12 months — not by spending more on maintenance, but by spending smarter. Start your free trial to begin tracking downtime causes and costs in real time. Book a demo to see OxMaint's Downtime Tracking and Root Cause Analysis module on live FMCG data.
The True Cost of Downtime: What Finance Never Sees
Most FMCG plants track repair cost — the parts and labor to fix what broke. But repair cost is typically less than 15% of the true downtime impact. The other 85% hides in production loss, product scrap, overtime, expedited shipping, customer penalties, and cascade damage to adjacent equipment. Here is where the money actually goes when a critical asset fails without warning:
This is why maintenance cost reduction programs that focus on cutting parts spend and labor hours often make the problem worse. A $50,000 reduction in maintenance budget that causes two additional unplanned failures costs $53,200 in downtime impact — a net loss disguised as a savings. The only sustainable path to lower total cost is reducing unplanned downtime itself.
The Six Root Causes of FMCG Downtime
Unplanned downtime is not random. Across thousands of FMCG plants, six root cause categories account for 92% of all unplanned stops. Understanding which categories dominate your plant determines which interventions will deliver the fastest ROI.
The critical insight: mechanical and electrical failures account for 60% of all unplanned downtime, and 85% of those failures show detectable degradation patterns 7–28 days before catastrophic breakdown. These are not random events — they are predictable, preventable failures that happen because the warning signs were never captured, never analyzed, or never acted upon. Every strategy in this guide targets this gap between detectable degradation and actual intervention.
The Downtime Reduction Framework: Five Levels
Cutting unplanned downtime is not a single initiative — it is a maturity journey. Plants that try to jump from reactive maintenance to full predictive analytics skip the foundational steps and fail. This five-level framework builds capability systematically, with each level delivering measurable ROI that funds the next.
Most FMCG plants are stuck between Level 1 and Level 2 — they have a CMMS but capture downtime inconsistently, with vague cause codes like "breakdown" that make root cause analysis impossible. Simply improving data capture quality at Level 1 — requiring specific cause codes, asset tags, and duration logging for every event — typically reveals $200K–$400K in addressable downtime that was previously invisible.
Level 1: Capture — Stop Guessing, Start Measuring
You cannot reduce what you do not measure. The first step is capturing every unplanned stop with enough detail to analyze. This sounds obvious, but 68% of FMCG plants either do not track downtime consistently or track it with cause codes so vague ("mechanical issue," "other") that the data is useless for root cause analysis.
The minimum viable downtime record needs five fields: asset ID, start time, end time, cause code (from a standardized list), and a free-text note from the technician. With a mobile CMMS like OxMaint, operators log this in under 30 seconds per event. Within 4–6 weeks of consistent capture, patterns emerge that were invisible before — the one filler that fails every 6 weeks, the conveyor that jams on the same SKU, the seal system that drifts on night shift.
Level 2: Analyze — Find the 20% Causing 80%
With clean downtime data, Pareto analysis reveals where to focus. In virtually every FMCG plant, 15–20% of assets generate 70–80% of unplanned downtime hours. These are your "bad actors" — and they are where every dollar of improvement investment should go first.
The second Pareto layer drills into failure modes within each bad actor. Filler #3 is not just "unreliable" — its downtime breaks down to 52% seal jaw failures, 28% nozzle blockages, and 20% conveyor jams. Each failure mode has a different root cause and a different fix. This specificity is what transforms vague "reliability improvement" initiatives into targeted engineering actions with measurable outcomes.
Level 3: Prevent — Build PM Programs That Target Your Actual Failures
Most FMCG preventive maintenance programs are built from OEM manuals — generic schedules that do not reflect your plant's actual failure patterns, operating conditions, or production intensity. Data-driven PM design replaces these with targeted interventions based on what actually breaks and why.
The transition from generic to data-driven PM typically reduces total PM hours by 20–30% while preventing 40–60% more failures — because effort shifts from low-value calendar tasks to high-value targeted interventions. The CMMS failure history tells you exactly which bearings fail at 4,000 hours (not the OEM-recommended 8,000), which seals degrade faster on night shift (humidity), and which motors only fail during summer peak production (thermal overload). This is maintenance intelligence, and it only comes from your own data.
Level 4: Predict — Sensors That See Failure Coming
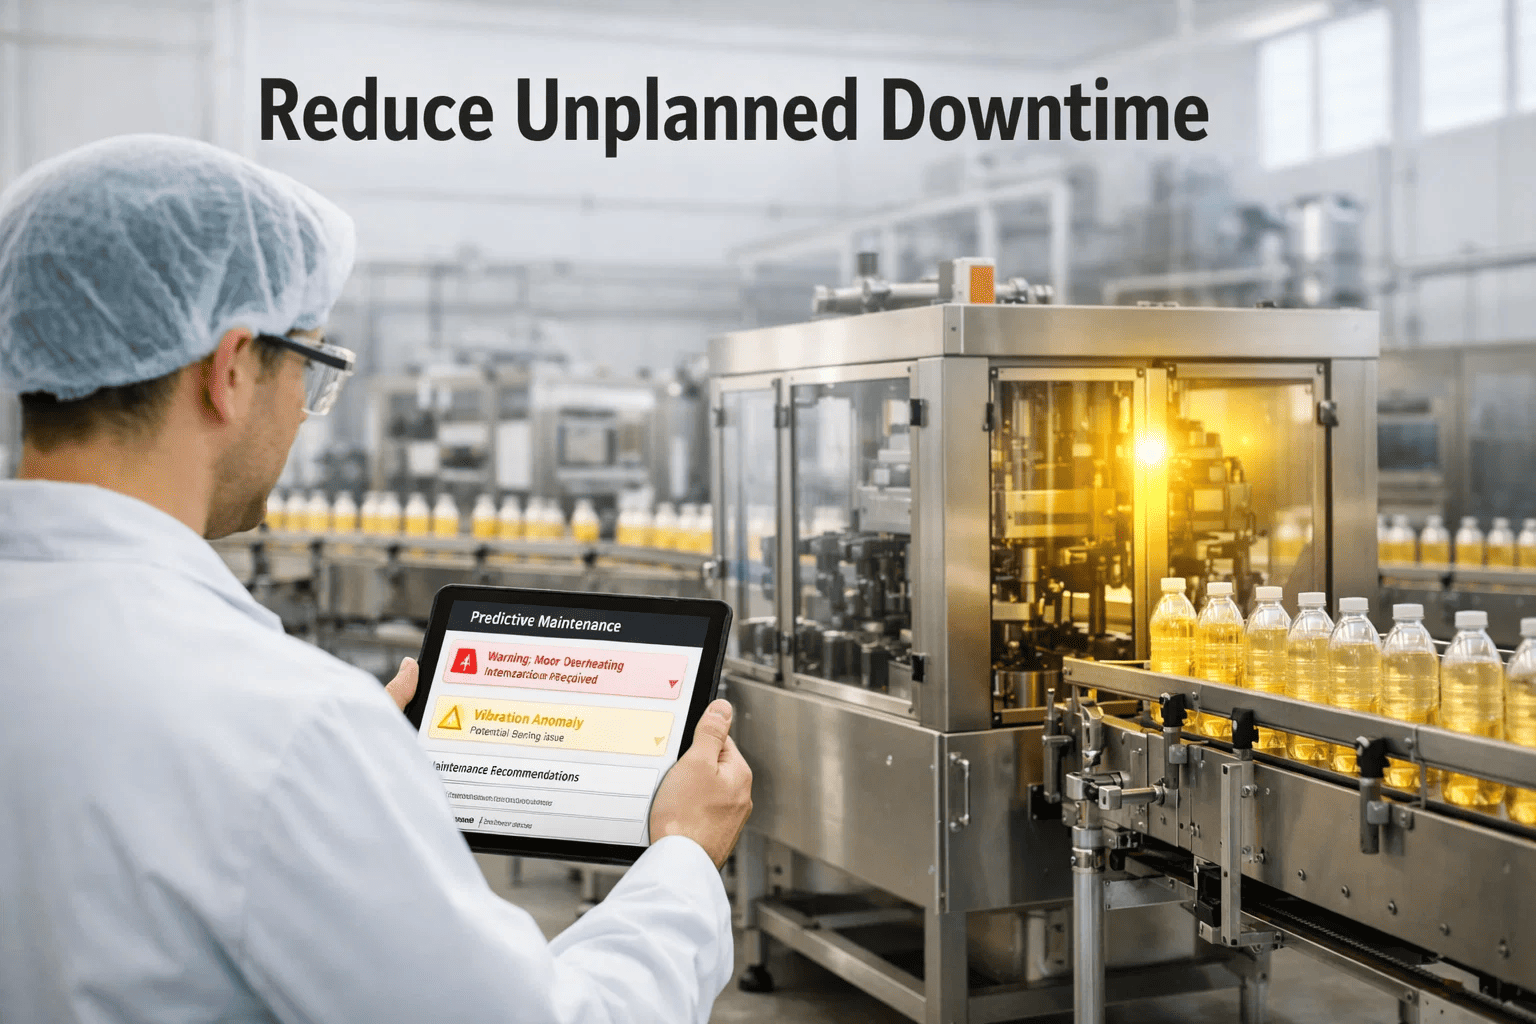
Once your PM program covers the known failure modes, the next level adds IoT sensors to detect the unpredictable ones. Vibration sensors, temperature monitors, and current analyzers give you 7–28 days of advance warning before failures that no calendar-based PM can prevent.
The ROI math is simple: a $340 bearing replacement during a planned window versus an $18,000 emergency failure. One prevented emergency per month justifies the entire sensor investment for a 5-line FMCG plant. Most plants experience their first validated predictive catch within 4–8 weeks of sensor deployment — usually on equipment that was already in early-stage degradation but showed no symptoms visible to human inspection.
The Downtime Reduction ROI
Here is what a typical 5-line FMCG plant saves by progressing through the downtime reduction framework over 12 months:
The fastest value comes from Level 1 (capture) and Level 2 (analyze) — simply knowing where your downtime occurs and focusing PM resources on bad actors delivers 60% of the total savings. Predictive analytics (Level 4) adds another 25–30% but requires the data foundation from earlier levels. Plants that skip straight to sensors without fixing their data capture get impressive dashboards with no actionable insight.
Downtime Metrics That Drive Action
Tracking downtime is only useful if the metrics drive specific actions. These five KPIs, reviewed weekly, create a continuous improvement loop that systematically reduces unplanned stops.
The most powerful metric is the planned-to-unplanned ratio. World-class FMCG plants maintain 85%+ planned maintenance — meaning only 15% of maintenance activity is reactive. The average FMCG plant sits at 45–55% planned. Moving from 50% to 80% planned typically reduces total downtime by 40–50% because planned work is 3–5× more efficient than emergency repairs, produces zero production loss, and prevents the cascade failures that multiply each event's impact.
Quick Wins: Reduce Downtime This Month
While the full framework takes 6–12 months to mature, these five actions deliver measurable downtime reduction within 30 days — requiring no capital investment, no new technology, and no organizational change.
The daily 15-minute downtime review is the single highest-leverage habit a maintenance team can adopt. Each morning, the maintenance lead and production supervisor spend 15 minutes reviewing yesterday's downtime events: what stopped, why, how long, and what can prevent recurrence. This ritual alone reduces downtime 10–15% within the first month because it creates visibility and accountability that did not exist before. Problems that were silently accepted for years become visible and unacceptable once they are reviewed daily.
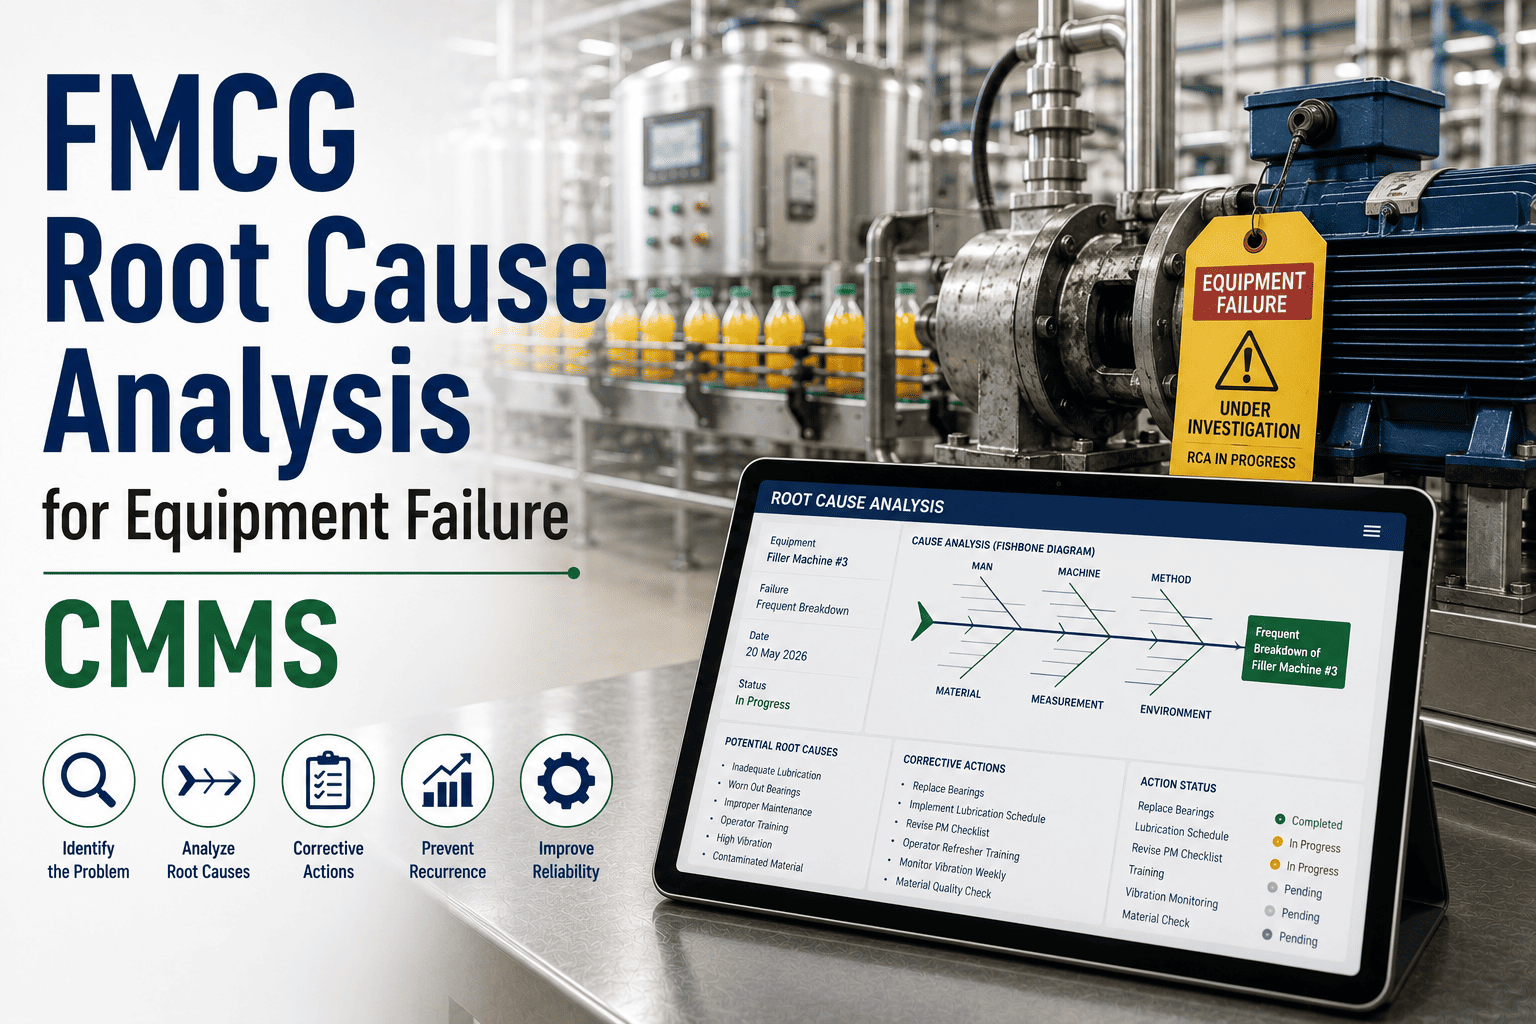

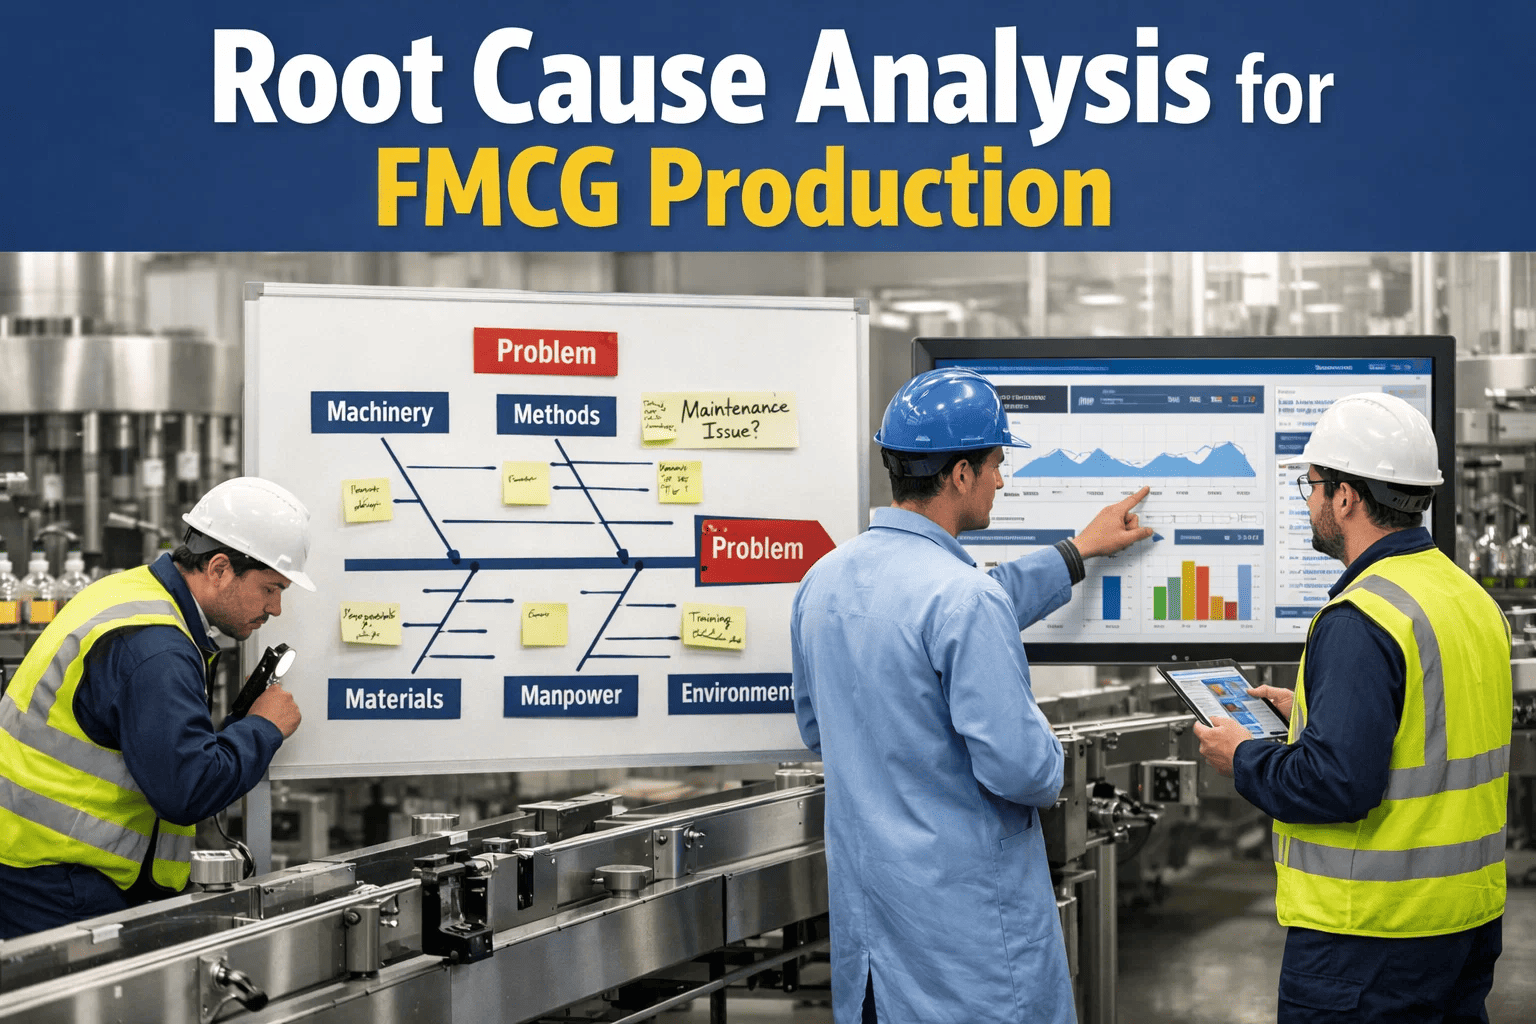
-in-fmcg-a-step-by-step-guide-to-eliminating-recurring-failures.png)