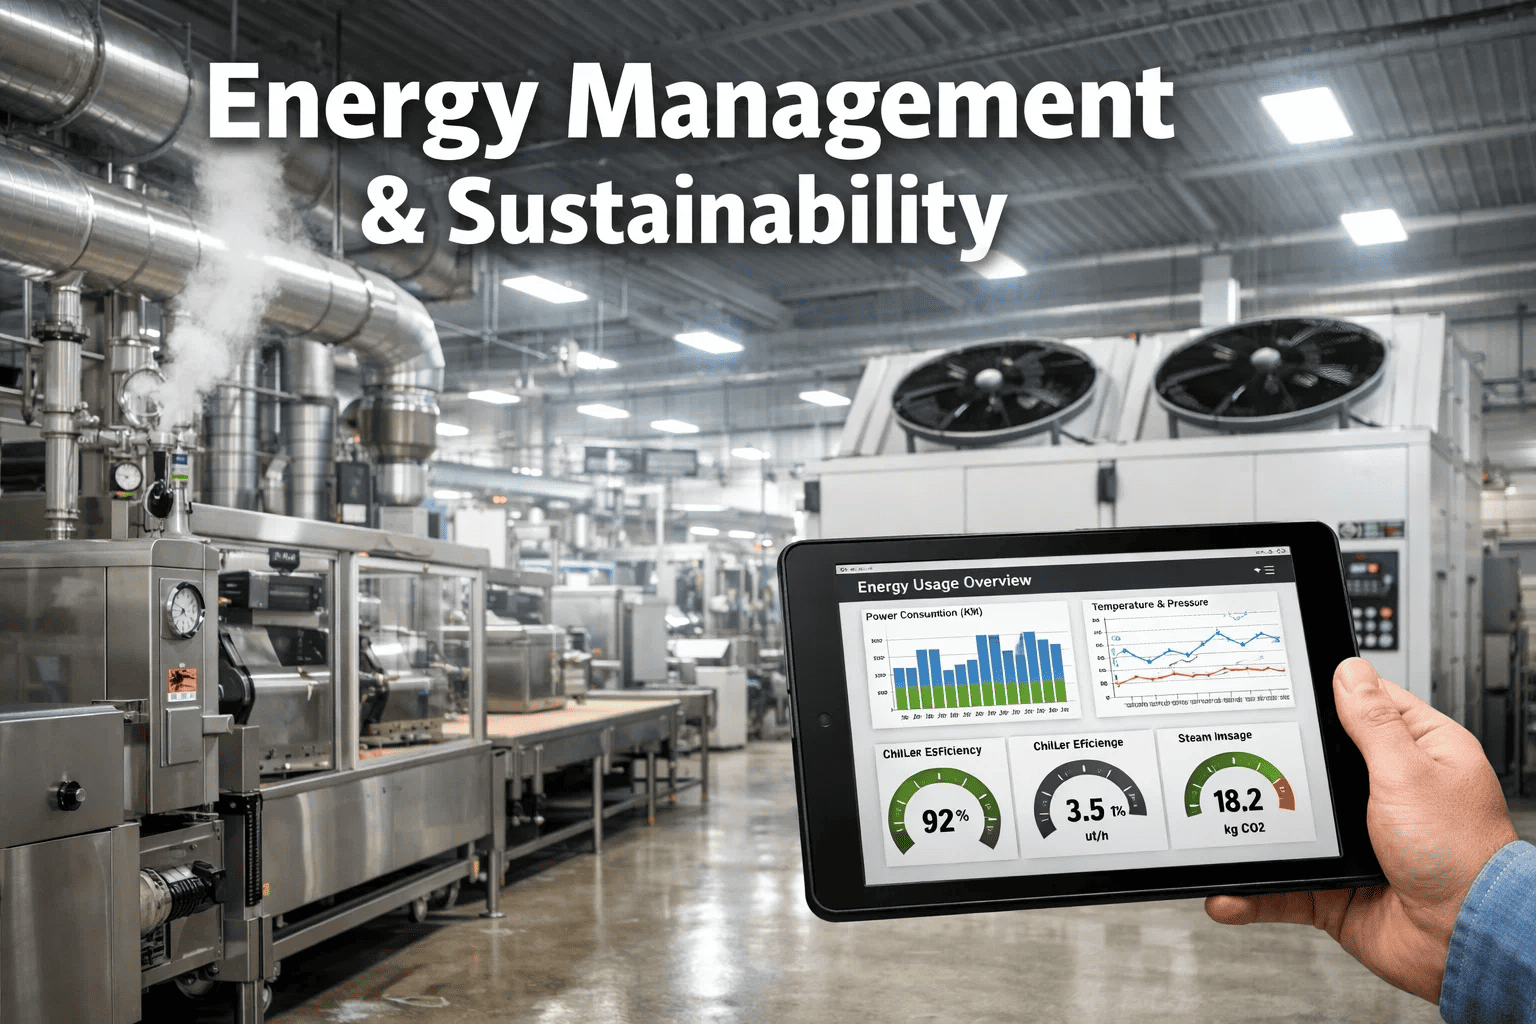
Energy is the second-largest controllable cost in food and beverage manufacturing — behind raw materials but ahead of labour, packaging, and maintenance combined. The average food plant spends between $1.2M and $4.8M annually on electricity, natural gas, steam, and compressed air, yet fewer than 28% track energy consumption at the equipment level where the actual waste occurs. A single steam trap failure wastes $8,000–$12,000 per year in fuel. A refrigeration compressor running at 15% above optimal load costs $22,000 annually in excess electricity. An air compressor system with 20% leakage burns $18,000 per year in wasted energy. These are not theoretical numbers — they are the documented losses from equipment that maintenance teams walk past every day because no system connects energy consumption to asset condition. OxMaint's energy-linked maintenance module connects every energy-consuming asset to its maintenance history, tracks consumption anomalies that signal equipment degradation, and generates the sustainability data that ESG reporting and carbon reduction targets demand.
Energy Management in Food and Beverage Plants: Cut Costs, Reduce Waste, Report Results
A maintenance-driven framework for energy optimization — connecting asset condition to energy consumption, identifying waste at the equipment level, and building the data layer that sustainability reporting requires.
Where Food Plants Waste Energy: The Equipment-Level Truth
Plant-level energy bills tell you what you spent. Equipment-level energy tracking tells you where you wasted it. The difference between these two perspectives is the difference between paying utility bills and managing energy as an operational cost that responds to maintenance intervention. Most food plants have 15–30% energy waste hidden inside equipment that looks like it is running normally but is consuming far more energy than it should. Here is where that waste concentrates. Ready to find your hidden energy losses? Start a free trial and book a demo to see how OxMaint connects energy data to asset condition.
The Maintenance-Energy Connection: Why Equipment Condition Drives Energy Cost
Energy waste and equipment degradation are not separate problems — they are the same problem measured two different ways. A motor drawing 18% more current than its nameplate rating is both an energy waste issue and a maintenance issue. A heat exchanger with fouled tubes is both an efficiency problem and a reliability risk. The plants that achieve the lowest energy costs are the ones that treat energy consumption as a maintenance KPI — not just a utility bill metric.
Every Dollar of Energy Waste Is a Maintenance Problem You Have Not Found Yet. OxMaint Finds Them All.
OxMaint connects energy consumption data to asset condition records, identifies the specific equipment driving your highest energy costs, and generates maintenance work orders that reduce energy waste at the source — not at the utility bill.
How OxMaint Turns Maintenance Data Into Energy Savings
Most energy management programmes fail because they measure consumption without connecting it to the equipment conditions that drive it. OxMaint bridges this gap by linking every energy-consuming asset to its maintenance history, PM schedule, and condition data — so energy anomalies trigger maintenance investigation, and maintenance activities track their energy impact. If your sustainability goals feel disconnected from your maintenance programme, start a free trial and book a demo to see energy-linked maintenance in action.
The ROI of Energy-Focused Maintenance
Energy savings from maintenance optimization are not theoretical projections — they are measurable reductions that show up on utility bills within 60–90 days of implementation. Here is the documented ROI from mid-size food plants that connected their maintenance and energy management programmes.
Frequently Asked Questions
How does OxMaint track energy consumption at the equipment level?
OxMaint integrates with sub-metering systems, IoT energy monitors, and building management systems to capture energy consumption data at the individual asset level. For plants without sub-metering, OxMaint uses nameplate ratings, operating hour tracking, and maintenance observation data to estimate equipment-level consumption and identify anomalies. The system correlates energy data with maintenance events — showing, for example, that a condenser cleaning PM reduced compressor energy consumption by 14% within 48 hours of completion.
Can OxMaint generate the data needed for ESG and sustainability reporting?
Yes. OxMaint aggregates energy consumption, carbon equivalents, and efficiency metrics across all tracked assets to generate the reports that ESG frameworks (GRI, CDP, SASB) and sustainability certifications (ISO 50001, ISO 14001) require. The system calculates energy intensity per unit of production, tracks year-over-year improvement trends, and documents the specific maintenance interventions that drove energy reductions — providing the evidence-based narrative that sustainability reports need, not just the numbers.
What is the typical payback period for energy-linked maintenance programmes?
Most food plants see measurable energy savings within 60–90 days of implementing energy-linked maintenance — particularly from low-cost, high-impact activities like steam trap repair, compressed air leak sealing, and condenser cleaning. The typical payback period for the complete programme is 4–8 months, with ongoing annual savings of 12–22% of total energy spend. The fastest wins come from identifying and repairing failed steam traps and compressed air leaks — both of which have repair costs that are a fraction of the annual waste they cause.
Does OxMaint support ISO 50001 energy management system requirements?
OxMaint provides the operational data layer that ISO 50001 Energy Management Systems require — including energy baseline documentation, significant energy use identification, energy performance indicator tracking, and documented evidence of energy improvement actions. While OxMaint is a CMMS platform rather than a dedicated EnMS, its energy-linked maintenance capabilities directly support the Plan-Do-Check-Act cycle that ISO 50001 requires, and its reporting outputs integrate with dedicated EnMS platforms for plants pursuing formal certification.
Your Utility Bills Are Telling You Where Equipment Is Failing. OxMaint Translates the Signal.
OxMaint connects energy consumption to asset condition, identifies the specific equipment driving waste, and turns maintenance data into the sustainability metrics your stakeholders demand — all from the work orders your team already creates.