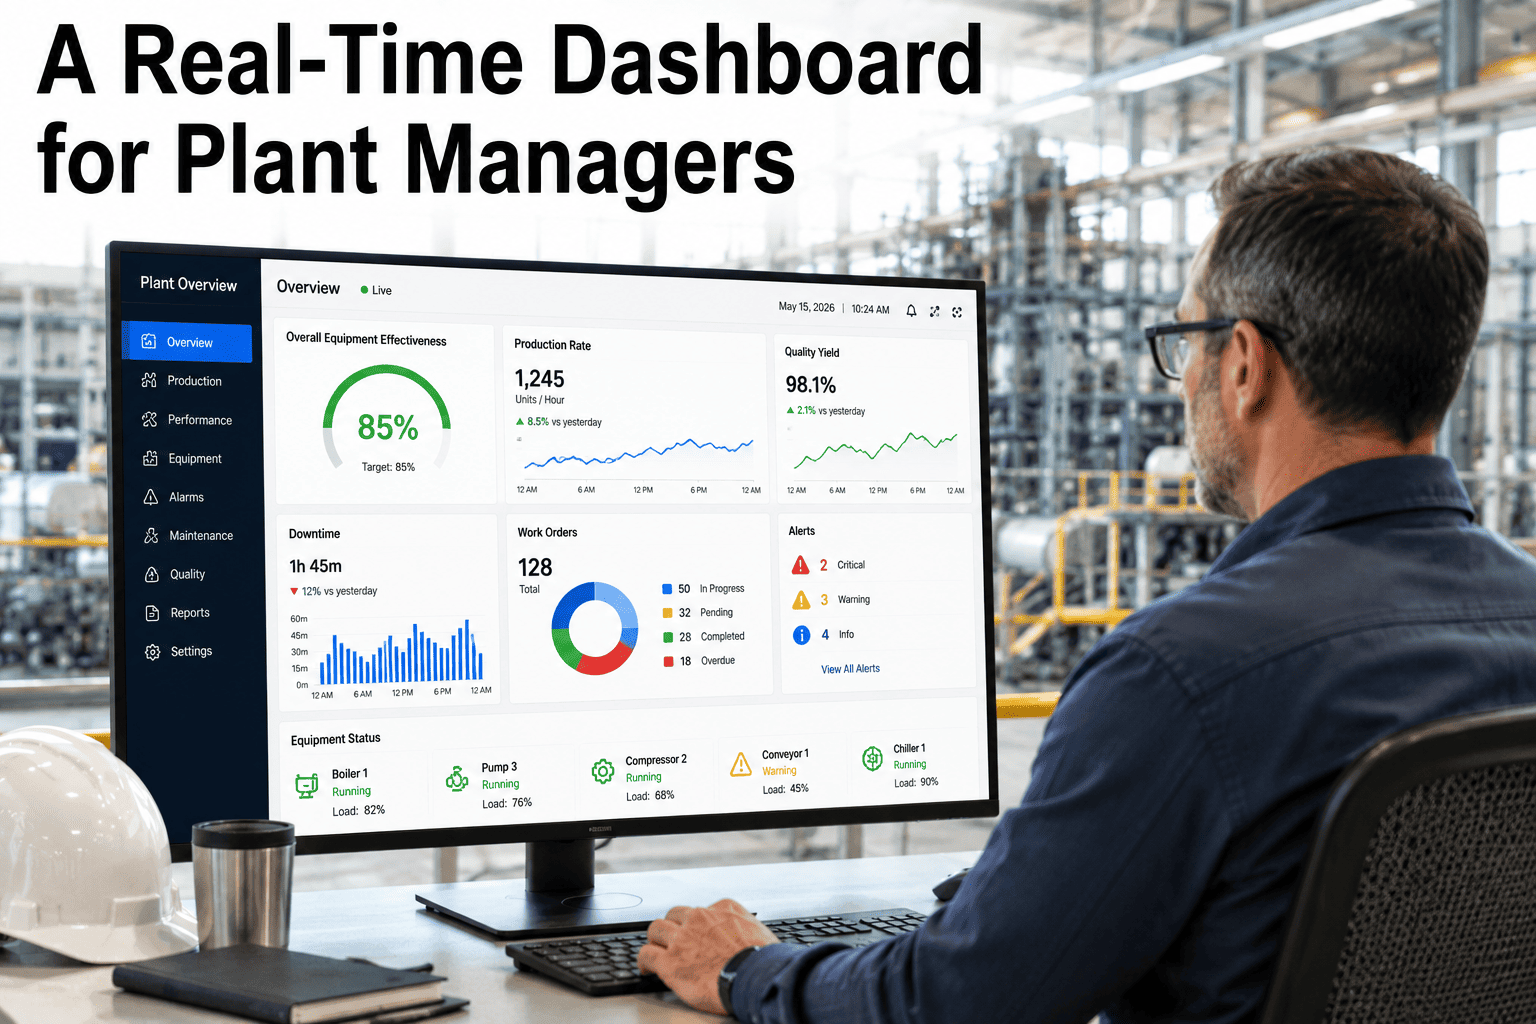
A real-time plant dashboard collapses dozens of disconnected data streams into a single operating picture that a plant manager can act on within minutes — not the next morning. For a mid-sized food plant running 150+ assets across two or three shifts, the gap between an incident and its visibility is often 4–8 hours when teams rely on paper logs, isolated CMMS exports, and clipboard rounds. This guide walks through KPI selection, CMMS-BMS-PLC integration, refresh cadence, and drill-down design so that uptime, OEE, and compliance status sit in one operational view. You can spin up a configured environment with your own assets by visiting Start Free Trial and connecting your first data source in under an hour.
Can your plant manager see every critical asset's health — right now, on one screen?
In most food plants the answer is no. Shift handovers, clipboard rounds, and siloed exports turn 4 hours of downtime into 8. A real-time dashboard ends that lag — pulling CMMS work orders, BMS alarms, and PLC telemetry into one operational view that a manager can act on before the next batch is at risk.
Three data streams, one operating picture
A plant manager's dashboard is only as trustworthy as the feeds behind it. Wire these three sources in the right order and the screen stops being a reporting tool — it becomes the plant's command console.
Machine-level telemetry
Cycle counts, motor current, vibration thresholds, line speed, and stoppage events streamed from fillers, sealers, and conveyors. This is the fastest signal — often refreshed every 5–15 seconds — and the one that catches mechanical drift before a batch fails a metal detector.
Environment & utilities
Cold-storage temperature, HVAC humidity, compressed-air pressure, and clean-room differential pressure. For food plants governed by HACCP and FSMA, a BMS feed that breaches a critical limit for more than 2 minutes should raise a visible red flag on the dashboard — not sit in a standalone alarm log.
Work orders & compliance
Open WOs, overdue PMs, MTTR, MTBF, and sanitizer-change logs. The CMMS feed ties telemetry to action — when a PLC vibration alert fires, the dashboard should show whether a work order already exists, who owns it, and the estimated completion window.
A 180-asset bakery operation spending $42K per shift in unplanned downtime
Before integration, the plant's filler line would lose 3–4 hours per week to bearing failures detected only when the line stopped. After wiring PLC vibration data and CMMS work-order status into a single dashboard, the maintenance lead caught a rising vibration trend on Filler 2 at 6:42 AM, scheduled a bearing swap during the 11:30 sanitation window, and avoided an estimated $11K in lost throughput. Across the first quarter, the plant cut unplanned filler downtime by 38% and reduced after-hours callouts by 22%.
The six metrics every plant manager screen needs
OEE is the headline number — but a dashboard that only shows OEE hides why it moves. These six tiles give a manager the full cause-and-effect chain from equipment health to compliance status.
Availability × Performance × Quality. World-class food lines run 85%+; most sit at 55–65%. Show it as a single percentage with a 7-day sparkline.
Target ≥95% for Tier-1 assets. Below 90% on any line for two consecutive shifts should trigger an automated review task in the CMMS.
Tracks how fast your team recovers. Benchmark against the previous quarter; rising MTTR usually signals a parts-availability or skills gap.
Live count with a breakdown by priority (P1 / P2 / P3). More than 8 P1s open at once on a single line is a red flag worth escalating.
Percentage of scheduled preventive maintenance completed on time. Below 95% correlates with a 2–3× spike in unplanned failures within 60 days.
Any number above zero demands immediate attention. Tie this tile directly to BMS temperature and pressure logs so a breach is visible in seconds.
From plant-level number to the failed bearing in four clicks
A dashboard that stops at the plant total is a reporting tool, not a command console. The drill-down path below is what lets a manager move from "OEE dropped 6 points" to "Filler 2, bearing housing C, vibration trending up since 5:50 AM" in under 30 seconds.
Plant overview
Whole-plant OEE, uptime, open WO count, and compliance status. A red tile on any line means the next click goes there.
Click target: the red OEE tile on Line 2Line-level view
Breakdown of availability, performance, and quality for that line, plus the asset list with current health status. Filler 2 shows amber.
Click target: Filler 2 asset cardAsset detail
Live PLC telemetry, last 24-hour trend, open and historical work orders, PM schedule, and the asset's criticality rating.
Click target: the rising vibration trend chartComponent & action
Vibration trace on bearing housing C, the threshold that triggered the alert, and a one-click "Create Work Order" button pre-filled with asset, symptom, and priority.
Result: WO created, technician assigned, ETA visibleHow fast is "real time" — and what is fast enough?
"Real time" is not one number. Each data source has a refresh rate that balances signal value against network and storage cost. Mismatch the cadence and you either drown in noise or miss the failure entirely.
| Data source | Ideal refresh | Acceptable lag | Why that rate |
|---|---|---|---|
| PLC — vibration, current, speed | 5–15 sec | ≤30 sec | Bearing failure signatures develop in minutes; slower than 30s misses the warning window. |
| BMS — temperature, pressure | 30–60 sec | ≤2 min | HACCP critical limits need a visible breach within 2 min to trigger corrective action logs. |
| CMMS — work order status | 1–5 min | ≤10 min | WO state changes are human-driven; sub-minute refresh adds noise without adding insight. |
| OEE rollup calculation | 1 min | ≤5 min | Calculated from PLC feeds; should update fast enough to reflect a line stop within one shift-minute. |
| Compliance / audit log | Event-driven | Instant | Each deviation, sign-off, or sanitizer change must hit the audit trail the moment it occurs — no buffering. |
Before the dashboard I'd find out about a filler failure from the shift supervisor's 6 AM call. Now I see the vibration trend climb on my phone at 5:50 — and the work order is already open before I reach the gate.
Stop finding out about failures from the morning call.
Connect your CMMS, BMS, and PLC feeds to a single real-time dashboard and give your plant manager the operating picture they've been missing.
Real-time dashboard questions, answered
How long does it take to stand up a real-time dashboard for a typical food plant?
A 100–200 asset plant with an existing CMMS and OPC UA–capable PLCs can be live in 2–4 weeks. Week one covers asset import and criticality ranking; week two wires PLC and BMS feeds; week three configures KPI tiles, thresholds, and drill-down paths; week four is shift-by-shift validation with the maintenance team. Plants starting from paper-based maintenance should budget 6–8 weeks to include a CMMS baseline first.
Do we need to replace our existing CMMS to use a real-time dashboard?
No. A well-built dashboard sits on top of your current CMMS through REST API or scheduled export connectors, pulling work-order status, PM compliance, and asset records without forcing a migration. If your CMMS lacks an API, most modern dashboards can read a nightly CSV export as a fallback — though real-time WO updates will lag by up to 24 hours. You can evaluate your current system's readiness with a Book a Demo session.
What refresh rate is genuinely needed for food plant equipment?
PLC telemetry should refresh every 5–15 seconds to catch bearing and motor-current trends before they become failures. BMS temperature and pressure data can run at 30–60 seconds — fast enough to flag a HACCP breach within the 2-minute corrective-action window. CMMS work-order status only needs 1–5 minute polling because state changes are human-driven. Pushing everything to sub-second refresh burns storage budget without improving decisions.
How does the dashboard support HACCP and FSMA compliance audits?
Every BMS threshold breach, corrective action, sanitizer change, and PM sign-off is written to an immutable event log the moment it occurs. During an audit, a manager can filter by date range, asset, or deviation type and export a timestamped report in under a minute. The same log feeds the "Open HACCP deviations" KPI tile, so compliance status is never more than a glance away on the main screen.
What does it cost — and what's the typical payback period?
For a 180-asset food plant, configuration and first-year subscription typically run $18K–$35K depending on connector count and user seats. Plants that capture even one avoided filler failure per quarter — worth $8K–$14K in lost throughput — see payback inside 6–9 months. You can provision a configured environment with your own asset list at Start Free Trial and validate the numbers against your downtime logs.
Your plant's operating picture, live in under a month.
Connect CMMS, BMS, and PLC feeds into one real-time dashboard your plant manager can actually act on. Configure it with your own assets today.
Free 14-day trial · No credit card