The most expensive maintenance problem in food manufacturing is not equipment failure — it is equipment that was designed in a way that makes maintenance slow, sanitation incomplete, and contamination inevitable. Studies show that 70% of a food production line's lifetime maintenance cost is determined by decisions made during the design phase — before the first product ever runs. A line designed for maintenance access reduces MTTR by 45%. A line designed for cleanability cuts CIP cycle time by 30%. A line designed with neither becomes a permanent drag on uptime, hygiene, and profitability. Start a free trial with Oxmaint and build maintenance-informed equipment specifications that reduce lifetime operating costs — or book a demo to see how CMMS data from existing lines informs better design decisions for new installations.
Line Design · Hygienic Engineering · Maintenance Access · CIP Optimization · Uptime by Design
Design the Maintenance Out.
Or Pay for It on
Every Shift Forever.
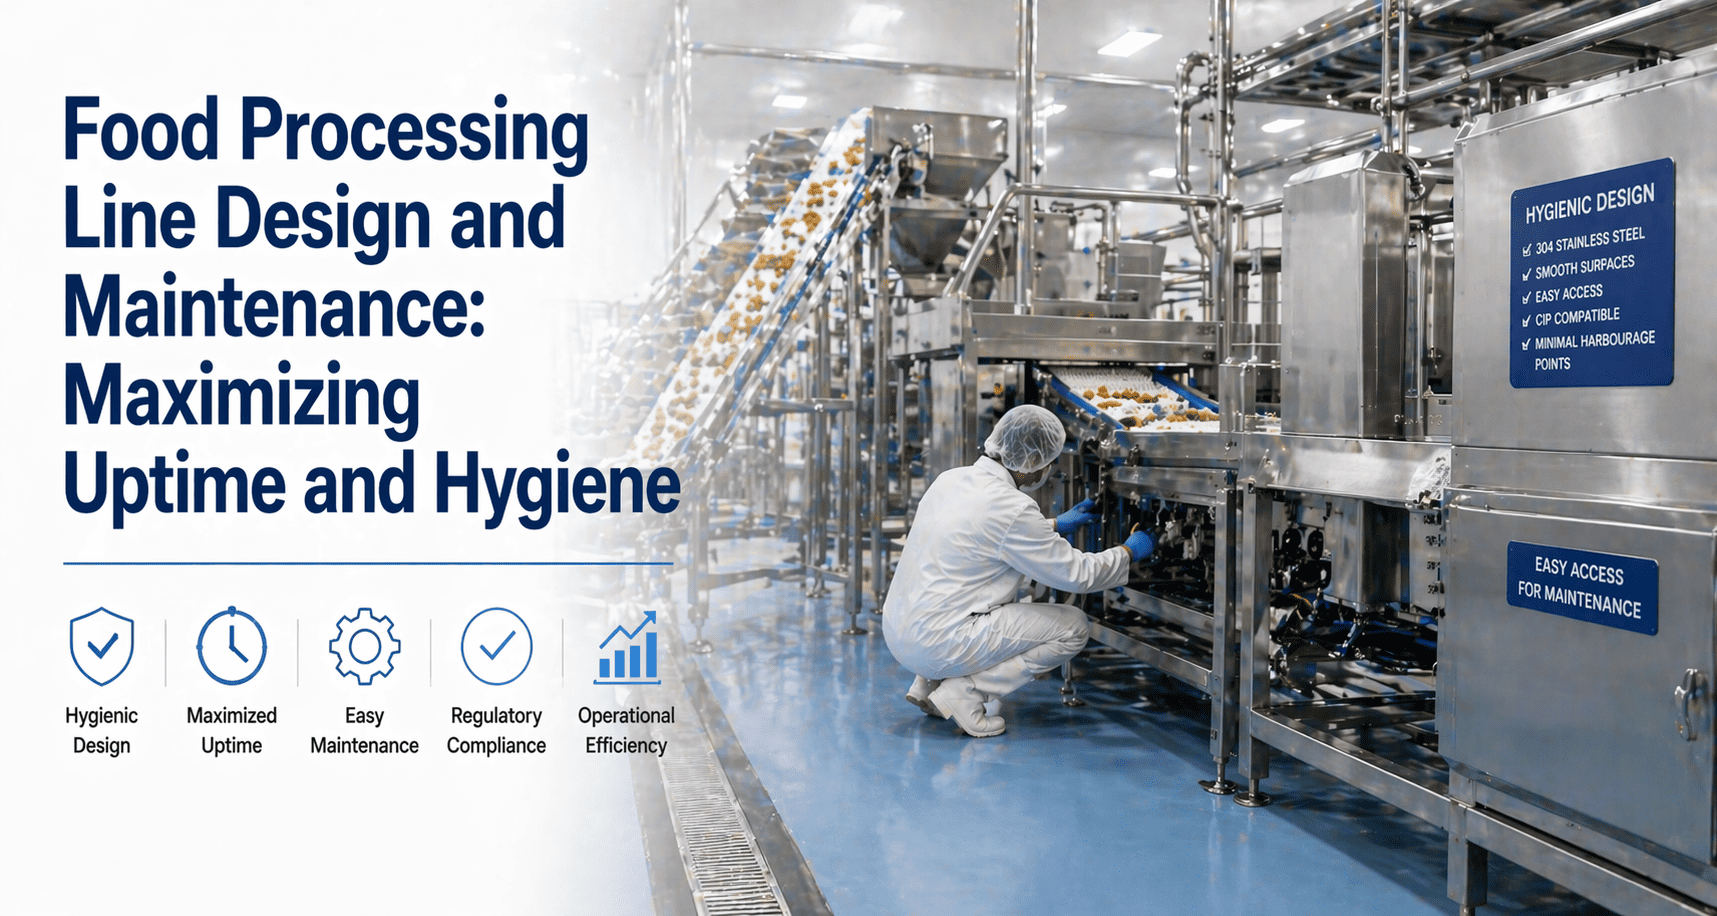
Food processing line design determines three things simultaneously: production throughput, sanitation effectiveness, and maintenance efficiency. A line that produces at high speed but requires 6 hours to clean and 4 hours to repair is not a high-performance line — it is a bottleneck with a good nameplate. This guide covers the design principles, layout strategies, and equipment selection criteria that optimize food processing lines for all three performance dimensions — not just output speed.
Oxmaint's asset lifecycle data — MTTR, failure frequency, CIP duration, and maintenance cost per asset — feeds directly into design specifications for new line installations and equipment replacements.
70%
Cost Set at Design
Of a food production line's lifetime maintenance cost is determined by design decisions made before the line is installed and commissioned
45%
MTTR Reduction
Lines designed with proper maintenance access — service clearances, quick-release panels, and component accessibility — reduce Mean Time To Repair by 45%
30%
CIP Time Savings
Hygienic equipment design with proper drainage slopes, self-draining geometry, and orbital welded joints cuts CIP cycle duration by 30%
92%
Achievable Uptime
Properly designed production lines achieve 92%+ mechanical availability versus 78-82% for poorly designed lines using identical maintenance resources
Design Principles
The Three Performance Dimensions of Food Processing Line Design
Most food processing line design discussions focus on throughput capacity. But throughput is meaningless without the other two dimensions: how fast can you clean it, and how fast can you fix it? A line that produces 1,200 units per minute but requires 8 hours of CIP and 4-hour average repair times delivers less net output than a line rated at 900 units per minute with 4-hour CIP and 1-hour average repairs. The three dimensions are inseparable — and design decisions that optimize one at the expense of the others create permanent operational penalties. Your CMMS data holds the evidence of where your current lines fail on these dimensions — start a free trial and quantify maintenance and sanitation losses per production line.
Target: 85%+ OEE
Equipment speed capability, changeover time, buffer capacity, and bottleneck management. But raw speed without reliability and cleanability delivers less annual output than moderate speed with high availability.
Target: 30% less CIP time
Self-draining geometry, orbital welded joints, minimum 3-degree drainage slopes, no horizontal surfaces, food-grade surface finishes (Ra 0.8 micrometers), and zero dead legs in piping. Design for clean means less time cleaning.
Target: 45% lower MTTR
Service clearances on all sides, quick-release panels, tool-free access to wear components, modular subassemblies for rapid swap-out, and standardized fasteners across the line. Design for maintenance means less time repairing.
Hygienic Design Standards
The Engineering Standards That Define Food-Safe Equipment Design
Hygienic equipment design is not subjective — it is governed by internationally recognized engineering standards that define material requirements, surface finishes, weld quality, drainage geometry, and cleanability validation methods. Equipment that meets these standards costs more upfront but delivers dramatically lower lifetime maintenance and sanitation costs. Equipment that does not meet them becomes a permanent contamination risk and a recurring audit finding. Know the standards before you specify equipment. Book a demo to see how Oxmaint tracks equipment specifications and compliance against hygienic design standards.
EHEDG
European Hygienic Engineering and Design Group
The international reference for hygienic equipment design. EHEDG guidelines cover equipment cleanability, materials, surface finishes, dead space elimination, and drainage requirements. EHEDG certification validates that equipment can be cleaned to microbiological standards using defined CIP protocols.
3-A SSI
3-A Sanitary Standards Inc.
The North American standard for sanitary equipment design. 3-A standards define material requirements (300-series stainless), surface finish specifications (Ra 0.8 micro-m for product contact), weld quality, and equipment construction methods for dairy and food processing.
GMP
Good Manufacturing Practice Requirements
FDA 21 CFR Part 110 and equivalent regulations define equipment construction and maintenance requirements for food manufacturing: smooth surfaces, no product traps, corrosion-resistant materials, and accessible for inspection and cleaning. GMP compliance is non-negotiable.
NSF/ANSI
NSF International Equipment Standards
NSF/ANSI standards cover food equipment materials, design, and fabrication. NSF certification validates that equipment meets public health and sanitation requirements. Major retailers and food service chains increasingly require NSF-certified equipment from suppliers.
Design Failures
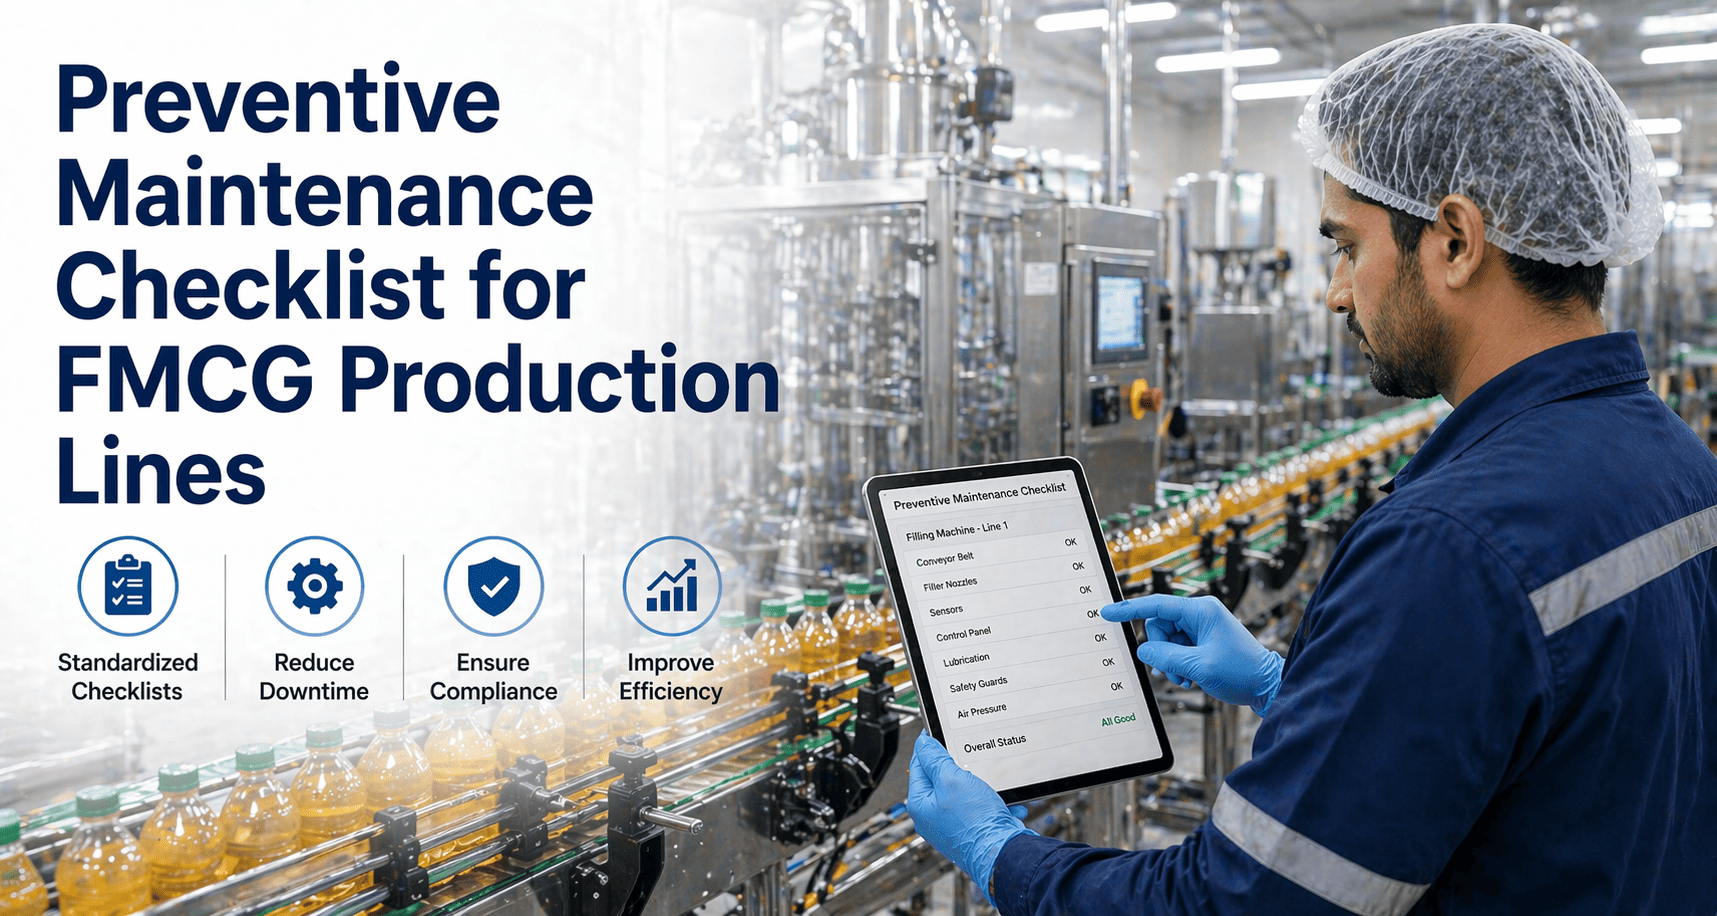
Equipment Design Decisions That Create Permanent Maintenance Problems
These six design failures show up repeatedly in food plants — and every one of them was locked in during the equipment specification and layout design phase. Once installed, these problems cannot be designed out — they can only be managed with more labor, longer downtime, and higher risk. The maintenance data in your CMMS already documents these problems — you just need to feed it back into the next equipment purchase decision. Start a free trial and mine your work order history for design-driven maintenance problems.
Access Failure
Insufficient Service Clearances
Equipment installed with 12 inches of clearance instead of 36 inches turns a 30-minute bearing replacement into a 3-hour partial disassembly project. 38% of food plant maintenance managers cite inadequate access space as their top equipment frustration.
Hygiene Failure
Non-Draining Equipment Geometry
Horizontal surfaces, internal ledges, and flat-bottom vessels that do not fully drain create standing water and product residue accumulation — the primary harborage sites for biofilm and pathogen colonization. CIP cannot clean what drainage cannot reach.
Reliability Failure
Non-Standardized Components
When every machine on the line uses different bearing sizes, seal types, motor frames, and fastener standards, spare parts inventory explodes, technician training multiplies, and MTTR increases. Component standardization reduces parts inventory by 30-40%.
Changeover Failure
Tool-Dependent Changeover Design
Changeover parts that require wrenches, allen keys, or specialized tools instead of tool-free quick-release mechanisms add 15-45 minutes to every product changeover. Over 250 changeovers per year, that is 60-180 hours of lost production — designed in permanently.
Layout Failure
No Maintenance Zones in Floor Plan
Production layouts that maximize floor space for equipment placement but leave no designated maintenance access corridors force technicians to work in cramped positions, create safety risks, and extend every repair task by 20-40%.
Material Failure
Wrong Surface Finish Specification
Product-contact surfaces with Ra above 0.8 micrometers have microscopic roughness that traps bacteria and resists CIP cleaning. Specifying the correct surface finish at purchase prevents a contamination risk that no amount of cleaning can overcome on rough surfaces.
Design Impact
Maintenance-Blind Design vs. Maintenance-Informed Design
| Design Decision |
Typical Approach (Production-Only Focus) |
Oxmaint Data-Informed Approach |
| Equipment Selection |
Based on speed rating and purchase price only |
Based on total cost of ownership including MTTR, parts cost, and CIP time data |
| Layout Design |
Maximize production floor density — squeeze in more equipment |
Include designated maintenance access zones — MTTR data proves the time savings |
| Component Specification |
Each OEM uses proprietary parts — inventory grows with every machine added |
Standardized bearing, seal, and motor specifications across entire line |
| Changeover Design |
Tool-dependent — 45-90 minutes per changeover accepted as normal |
Tool-free quick-release — changeover under 15 minutes with SMED principles |
| Cleanability |
CIP designed after equipment is installed — workarounds for poor drainage |
Self-draining geometry and EHEDG compliance specified at purchase — CIP time minimized |
| Future Maintenance Data |
No feedback loop — same design mistakes repeated on next line |
CMMS data feeds equipment specifications — each line is better than the last |
Oxmaint Solution
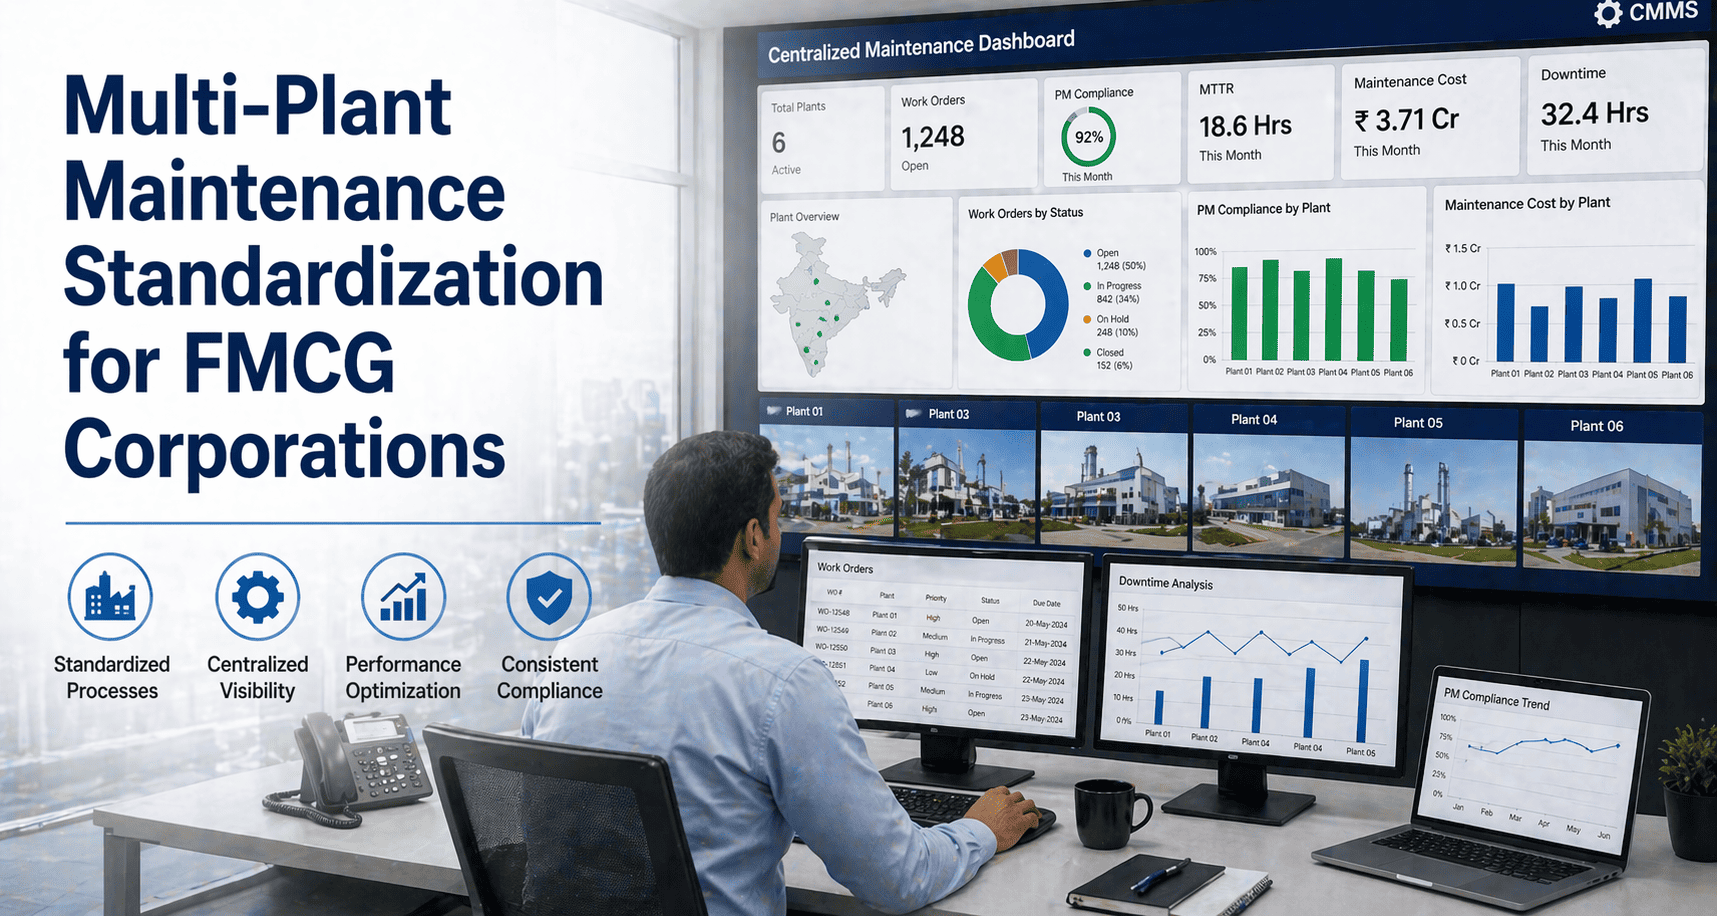
How Oxmaint Connects Operating Data to Better Design Decisions
Oxmaint does not design production lines. But it generates the maintenance performance data that makes design decisions smarter. Every work order, every repair time, every failure mode, every CIP duration — documented, analyzed, and available for the engineering team that specifies your next line or equipment replacement. The feedback loop between operations and engineering is where food plant maintenance excellence compounds. Book a demo to see how maintenance analytics inform capital equipment decisions.
Asset Analytics
Equipment Performance Scoring
Every asset carries a lifetime performance record: MTBF, MTTR, total maintenance cost, failure mode frequency, and parts consumption. When it is time to replace or replicate a line, this data tells engineering exactly which equipment performed and which did not.
Failure Analysis
Design-Driven Failure Identification
Work order root cause analysis categorizes failures by source: operator error, material defect, wear, or design limitation. When 40% of failures on a filler trace to "inadequate access for seal replacement," that is a design specification for the next purchase.
CIP Tracking
Sanitation Cycle Performance Data
Track CIP duration, chemical usage, water consumption, and post-CIP verification results per equipment type. Equipment that consistently requires extended CIP cycles or manual post-CIP intervention reveals cleanability design shortcomings quantitatively.
SMED Analytics
Changeover Time Optimization
Track changeover duration by line, product pair, and changeover type. Identify which changeover steps are taking longest and why. This data directly specifies the tool-free quick-release points needed in new equipment designs.
Parts Intelligence
Component Standardization Data
Analyze spare parts consumption across your equipment fleet. Identify where component standardization would reduce inventory complexity and technician training requirements. The data builds the standardization specification for new equipment procurements.
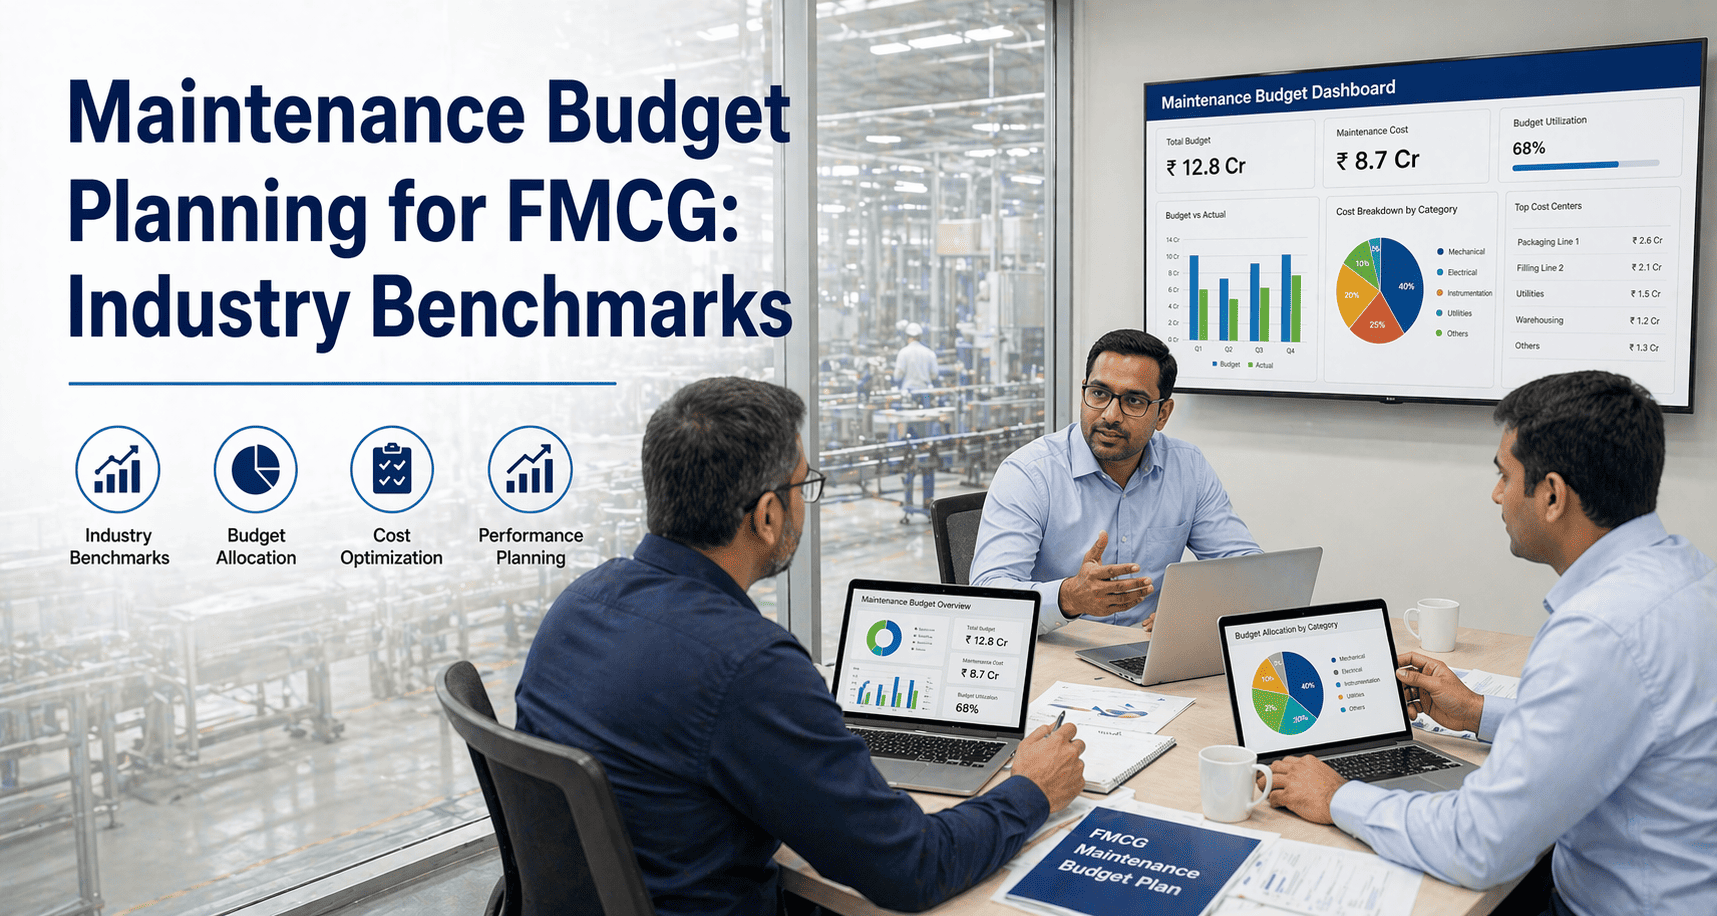
CapEx Integration
Total Cost of Ownership Modeling
Oxmaint's CapEx forecasting combines purchase price with projected maintenance cost, parts consumption, energy usage, and expected useful life — giving engineering and finance a TCO comparison that goes far beyond nameplate price.
Design ROI
The Financial Impact of Maintenance-Informed Line Design
45%
MTTR Reduction
Lines designed with proper service clearances, quick-release access panels, and modular subassemblies reduce Mean Time To Repair by 45% — recovering thousands of production hours annually
30%
CIP Time Savings
EHEDG-compliant equipment with self-draining geometry and orbital welded joints reduces CIP cycle duration by 30% — adding 1-2 hours of production time per sanitation cycle
$400K
Annual Savings Per Line
Combined savings from reduced MTTR, shorter changeovers, faster CIP, lower parts inventory, and higher OEE — quantified from CMMS data and achievable with design-phase decisions
92%
Achievable Availability
Well-designed lines achieve 92%+ mechanical availability compared to 78-82% for poorly designed lines — the difference of 500-700 additional production hours per year
Expert FAQ
Food Processing Line Design and Maintenance — Common Questions
How should maintenance teams be involved in new production line design and procurement?
Maintenance teams should be involved from the equipment specification stage — before RFQ documents are finalized. The maintenance manager and senior technicians bring critical knowledge about which equipment fails frequently, which designs are difficult to service, which parts are hard to source, and which CIP configurations work versus which ones create cleaning headaches. At minimum, maintenance should review and approve: service clearance dimensions in the layout, access panel specifications, component standardization requirements, CIP connection points, and spare parts availability commitments from OEMs. Oxmaint's asset performance data gives the maintenance team quantified evidence to back their design input.
Start a free trial and generate the equipment performance reports that inform better procurement decisions.
What is the minimum service clearance recommended for food processing equipment?
Industry best practice recommends 36 inches (900mm) minimum clearance on service sides of equipment, 24 inches (600mm) minimum on non-service sides, and 48 inches (1200mm) for equipment requiring overhead crane or hoist access for maintenance. Equipment installed against walls should have the service side facing the access aisle. Critical rotating equipment (motors, pumps, gearboxes) should have clearance for complete removal without moving adjacent equipment. These dimensions sound generous until you watch a technician try to replace a bearing in 12 inches of clearance — and you calculate the MTTR difference in production hours.
Book a demo to see how MTTR data by equipment location validates clearance investment.
How does CMMS data improve future equipment procurement decisions?
Your CMMS contains the operating truth about every piece of equipment in your plant — information that OEM sales teams will never provide voluntarily. Total cost of ownership (purchase price plus lifetime maintenance cost), mean time between failures, mean time to repair, most common failure modes, spare parts consumption rate, CIP cycle duration, and changeover time. When you evaluate a new equipment purchase, this data tells you whether Brand A's filler that costs 15% more has a 40% lower lifetime maintenance cost — and whether that makes it the cheaper option over 10 years.
Start free and begin building the equipment TCO database that transforms procurement.
What does EHEDG certification actually validate about food processing equipment?
EHEDG certification validates that a piece of equipment can be cleaned to defined microbiological standards using standardized CIP or COP protocols. The certification process involves physical cleanability testing — not just design review. Equipment is tested with a standardized soil, cleaned using a defined protocol, and then sampled for residual contamination. Equipment that passes meets the geometric, surface finish, and drainage requirements that enable effective automated cleaning. EHEDG certification costs more upfront but eliminates the extended CIP cycles, manual post-CIP scrubbing, and contamination risk that non-certified equipment creates permanently.
Book a demo to discuss hygienic design tracking in Oxmaint.
Line Design · Hygienic Engineering · CMMS Data · Maintenance Optimization · Free to Start
Your Next Production Line Should Be Your Best One. Use Maintenance Data to Make It So.
Oxmaint turns years of maintenance work order data into the equipment performance intelligence that engineers, procurement teams, and plant managers need to specify better production lines. MTTR by equipment type. Failure modes by design category. CIP duration by equipment configuration. Total cost of ownership by manufacturer. The data exists. Start using it.