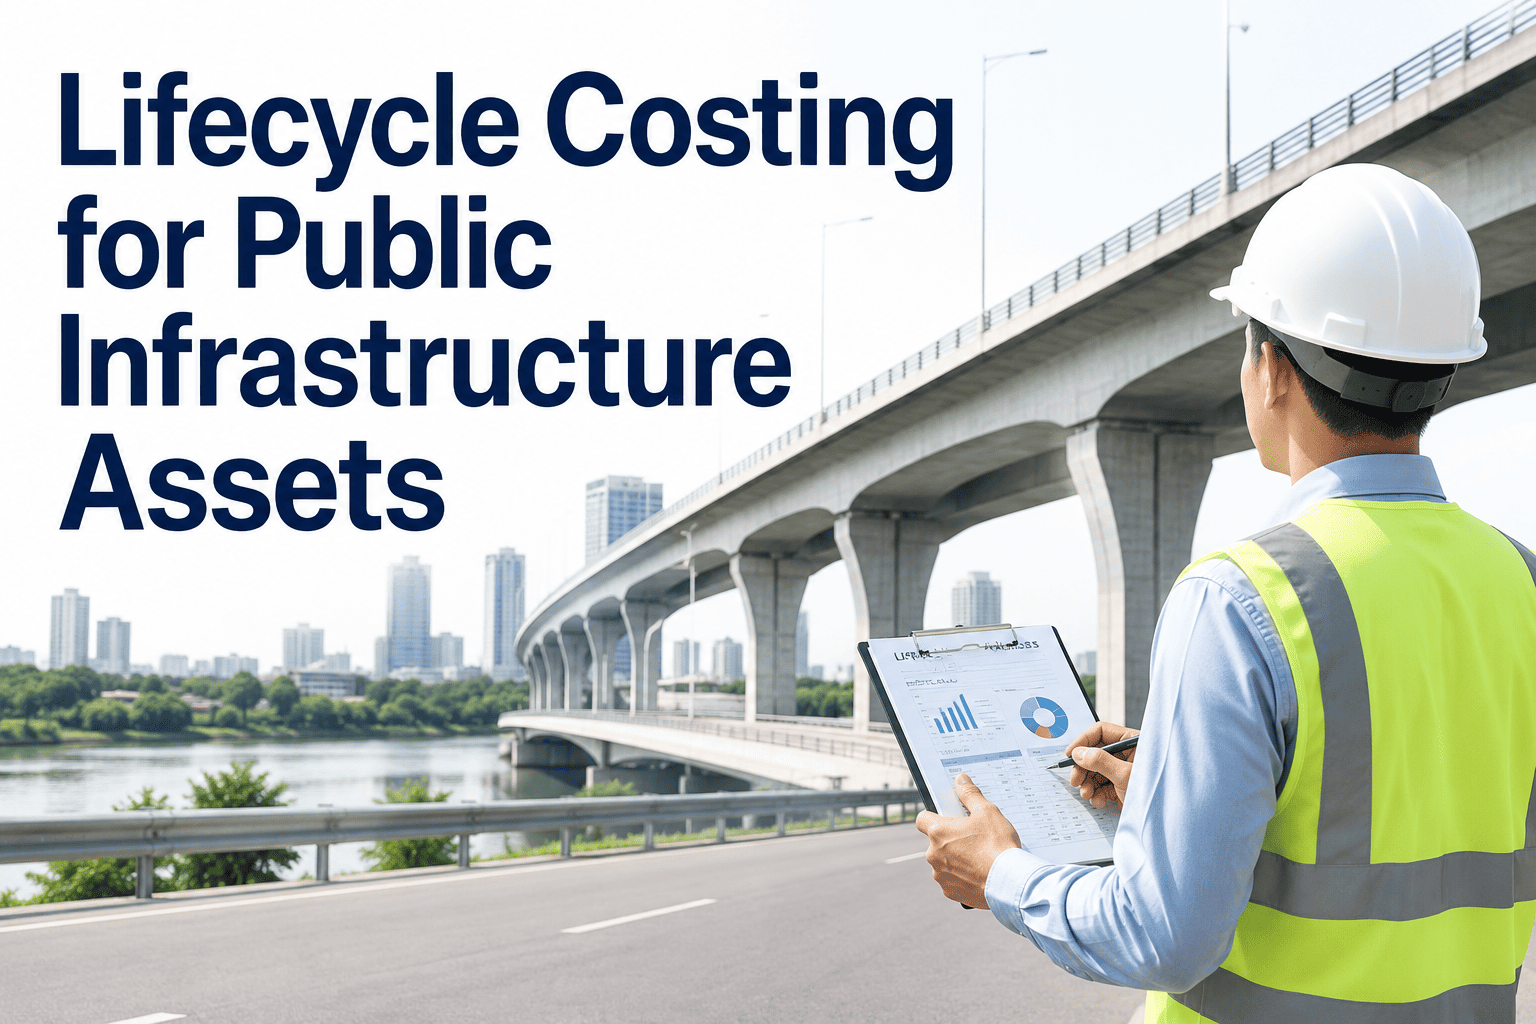
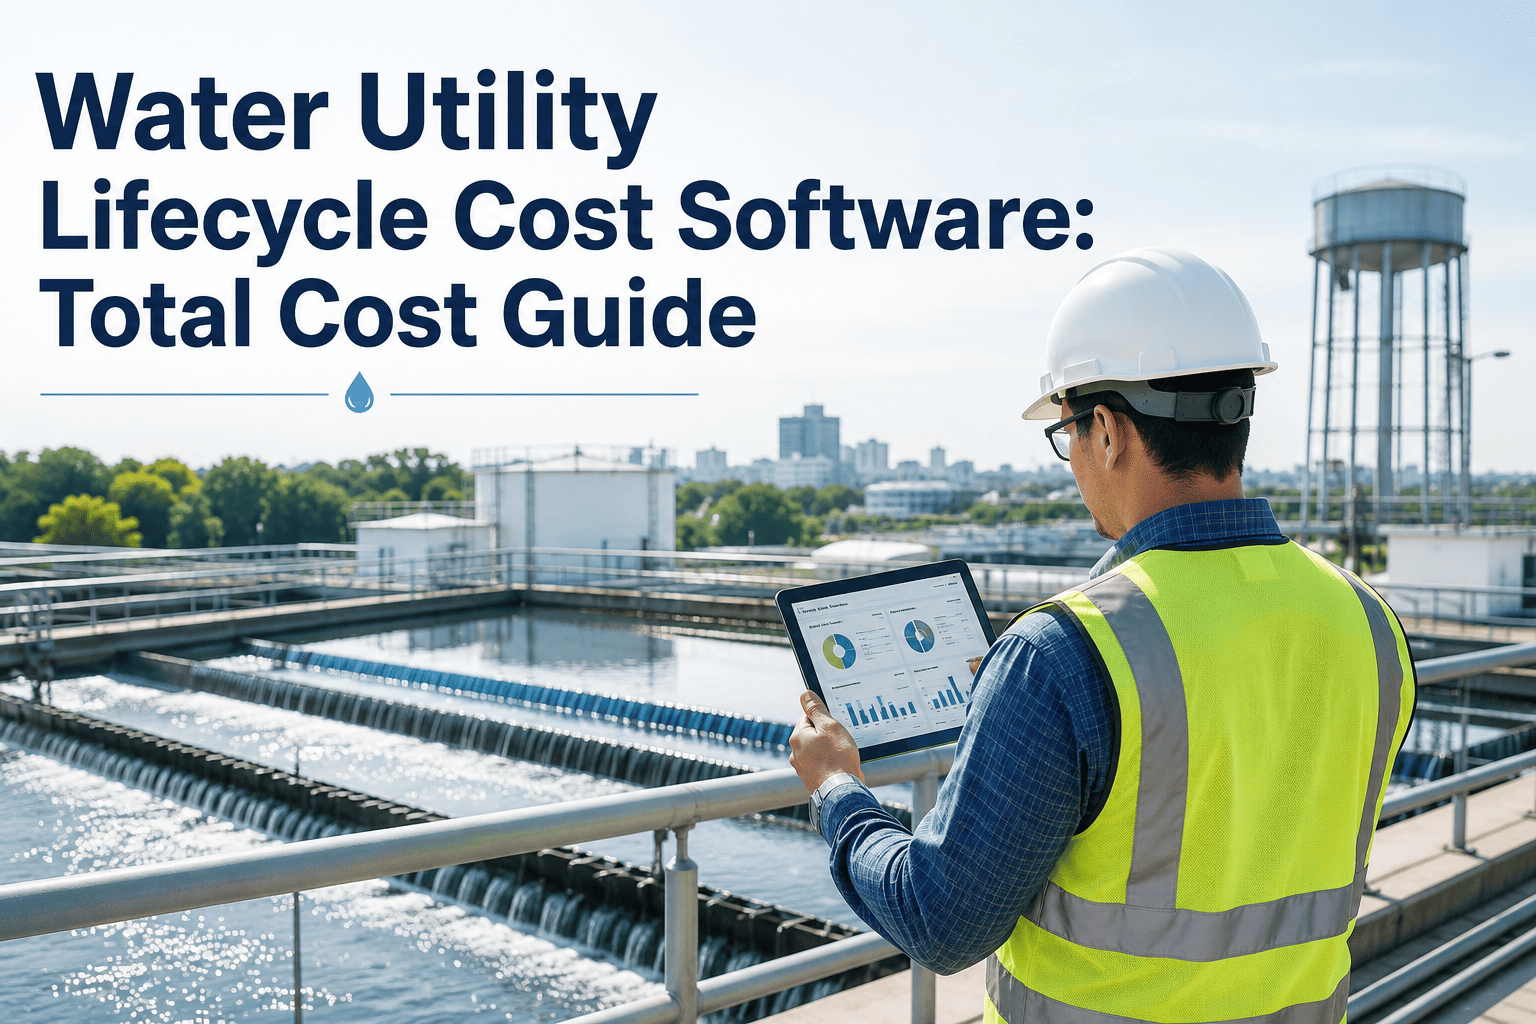
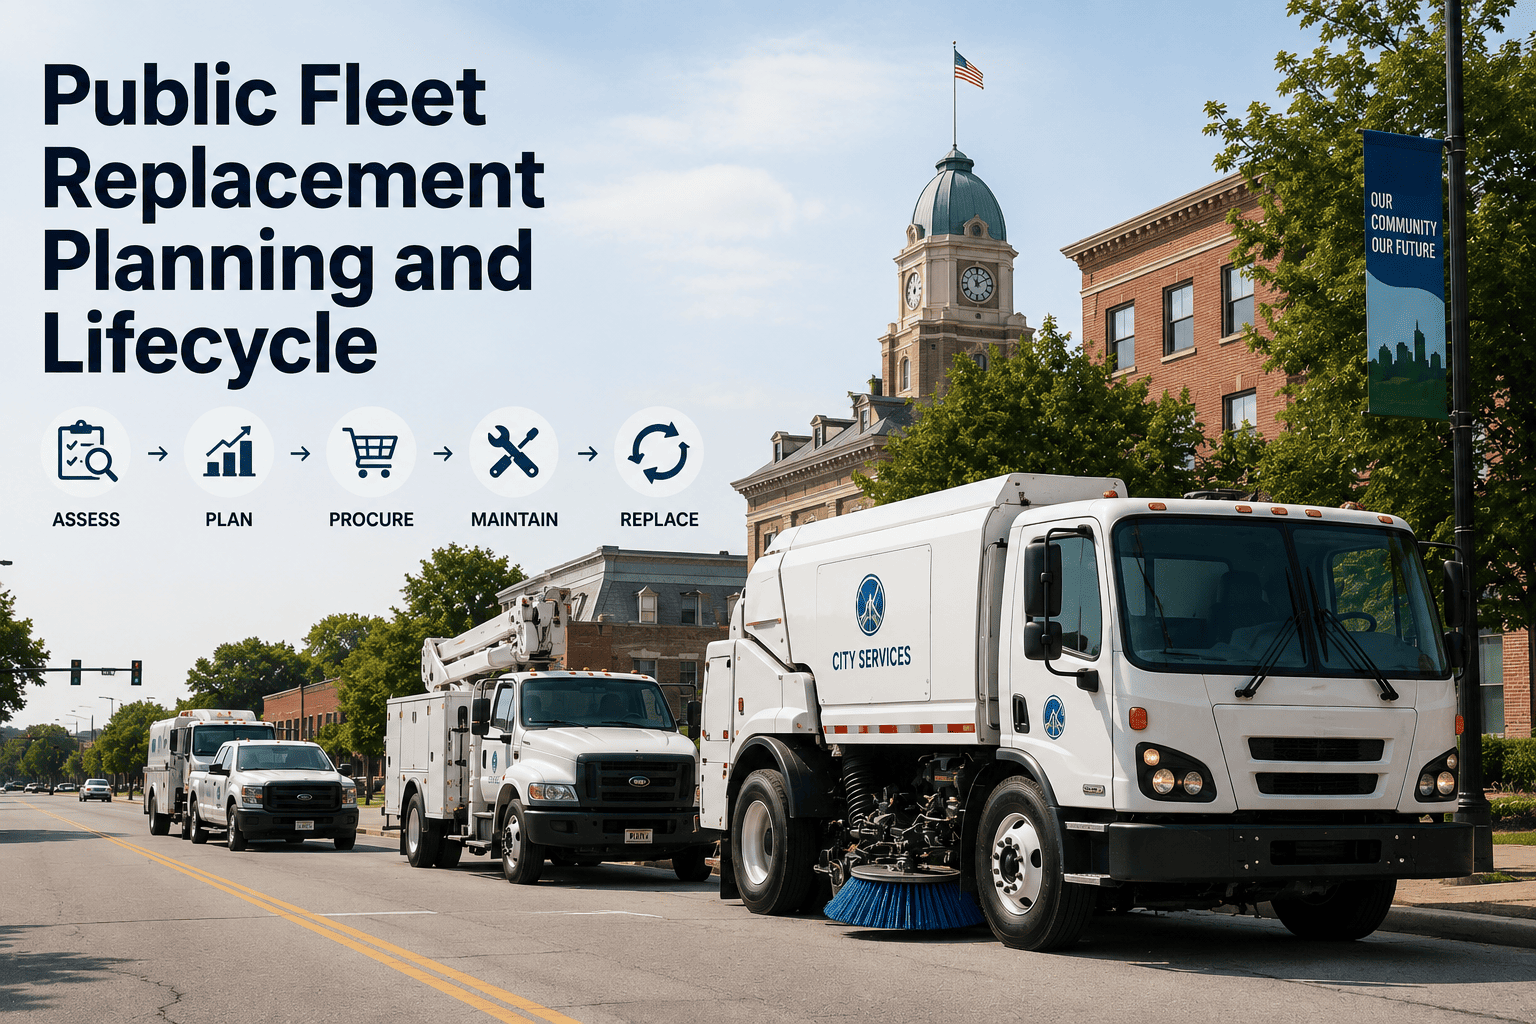
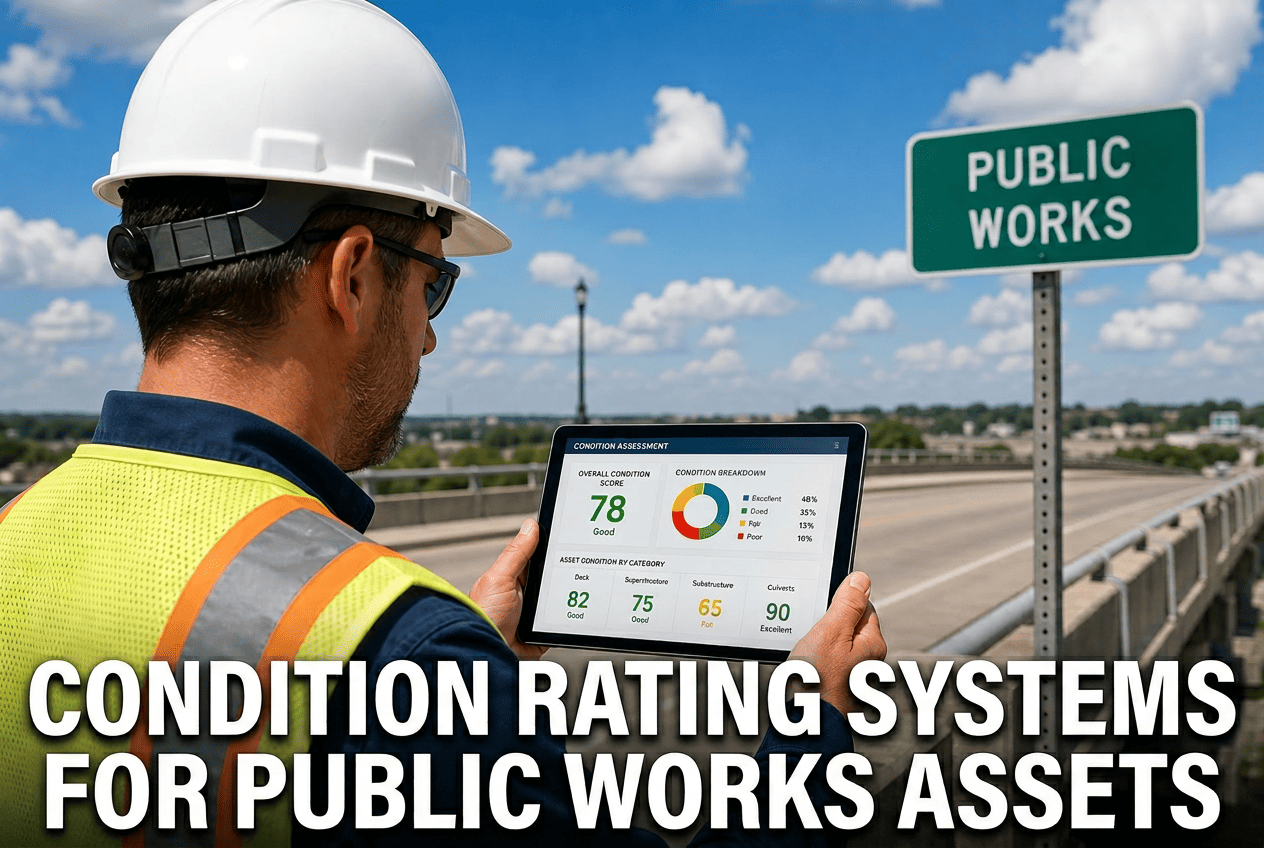
Two bids land on your desk for the same water pump station. Bid A is 1.2 million dollars. Bid B is 1.5 million. On paper, A wins and the meeting ends. But Bid A uses cheaper components that burn more energy, need rebuilds every seven years, and hit end of life a decade sooner. Over thirty years, A quietly costs the community far more than B ever would. This is the trap of lowest first cost, and it is how public budgets bleed money in slow motion. Lifecycle costing flips the lens: instead of asking what an asset costs to build, it asks what it costs to own, from the first shovel to final disposal. Start a free trial with Oxmaint to track lifecycle costs against every asset you own.
The Hidden Reality
Construction Cost Is Just the Tip of the Iceberg
20–30%
Visible: Construction / Acquisition
The number everyone argues about in the procurement meeting — and the smallest slice of what the asset will actually cost.
Waterline
70–80%
Hidden: Operations, Maintenance, Replacement & Disposal
Energy, repairs, staffing, spare parts, mid-life rehabilitation, and end-of-life removal — accumulating invisibly across 20 to 50 years, managed by different departments with no shared view.
For most long-lived public assets, operating and maintenance costs dwarf the build cost. Annual maintenance and modernization alone typically runs 2% to 20% of asset value every year for two to three decades. A one-time low bid that ignores this is not a saving — it is a deferral, and deferred cost accrues like debt, with interest.
The Four Cost Buckets
What Goes Into Total Cost of Ownership
CAPEX
Capital Expenditure
The one-time cost to design, purchase, and build the asset. Land, construction, equipment, and installation. Highly visible, easily compared, and routinely over-weighted.
OPEX
Operating & Maintenance
The recurring cost to run and maintain: energy, utilities, staffing, spares, insurance, and both routine and planned repairs. Usually the largest bucket over the full life.
RENEWAL
Replacement & Rehab
Periodic major overhauls and component replacement that keep the asset in service, timed to each component's replacement age and the manufacturer's guidance.
DISPOSAL
End of Life
The cost to decommission, remove, and dispose of the asset, offset by any salvage value recovered. Frequently forgotten until it lands in a late-stage budget.
Total cost of ownership is the sum of all four, discounted to today's dollars as net present value so a repair in year 25 can be compared fairly against a dollar spent today. That single number, not the sticker price, is what tells you which option is actually cheaper. Book a session to model total cost of ownership on your assets.
Cheap Now vs. Cheap Overall
The Same Asset, Two Very Different Bills
| Cost Component (30-Year View) |
Option A — Low Bid |
Option B — Lifecycle Choice |
| Construction / CAPEX |
Lower upfront |
Higher upfront |
| Annual energy & operations |
Higher every year |
Lower every year |
| Major rehab cycles |
More frequent |
Fewer, later |
| Useful life before replacement |
Shorter |
Longer |
| Total cost of ownership (NPV) |
Higher overall |
Lower overall |
This is not a hypothetical. A 2024 American Society of Civil Engineers study estimated U.S. agencies could save up to 1 trillion dollars over 30 years by applying formal lifecycle costing to major projects, and practitioners routinely uncover 10% to 40% total-life savings simply by evaluating costs over time rather than at the bid.
Make the Lifetime Cost Visible Before You Commit
Oxmaint captures acquisition, maintenance, energy, and replacement costs against every asset, then turns years of work-order data into the total-cost-of-ownership picture your budget decisions have been missing. Stop buying on sticker price alone.
The Method
Five Steps to a Lifecycle Cost Analysis
1
Set the analysis period
Define the study horizon, typically 20 to 50 years, long enough to capture at least one full replacement cycle for the asset class.
2
Map every cost bucket
List CAPEX, OPEX, renewal, and disposal costs for each option, drawn from an asset register and maintenance schedule, not a flat percentage of revenue.
3
Discount to present value
Apply a real discount rate to convert all future costs into today's dollars, producing a single comparable net present value per option.
4
Stress-test the assumptions
Run sensitivity checks on energy escalation, discount rate, and lifespan. Small variations compound over decades and can flip which option wins.
5
Compare and decide
Choose the option with the lowest total cost of ownership consistent with required function and service level, and document the rationale for audit.
Why It Pays
What Lifecycle Costing Delivers for Public Agencies
Lower Lifetime Spend
Choosing on total cost of ownership routinely uncovers 10% to 40% in whole-life savings that lowest-bid decisions leave on the table.
Better Timed Renewals
Knowing each component's cost trajectory shows exactly when replacement becomes cheaper than another round of repairs.
Defensible Funding Cases
An NPV-backed analysis gives council and funders an audit-ready rationale for why the higher upfront option is the responsible one.
No Surprise Liabilities
Modeling disposal and rehab upfront means end-of-life and mid-life costs stop ambushing budgets a decade after the ribbon-cutting.
Frequently Asked Questions
Lifecycle Costing: Common Questions
Is lifecycle cost the same as total cost of ownership?
They are used interchangeably. Both capture all costs across an asset's life — acquisition, operation, maintenance, replacement, and disposal — rather than just the purchase price.
Track total cost of ownership in Oxmaint.
Why discount future costs to present value?
A dollar spent in year 25 is not worth a dollar today. Discounting with a real rate converts all future costs into today's dollars so options with different timing can be compared on one fair number.
What analysis period should we use?
Typically 20 to 50 years, chosen to cover at least one full replacement cycle for the asset. Pavements, pipes, and buildings each warrant different horizons based on their useful life.
Where does the cost data come from?
From your asset register and maintenance history, not a flat percentage of revenue. Every work order, energy bill, and repair captured against an asset builds the dataset lifecycle costing needs.
Book a session to structure your cost data.
Does the lowest lifecycle cost always win?
You pick the lowest total cost of ownership that still meets required function, service level, and safety. Lifecycle costing informs the trade-off; it does not override performance or regulatory needs.
Stop Paying the Iceberg Bill You Never Saw Coming
Oxmaint turns every inspection, repair, and energy record into a living total-cost-of-ownership model, so every capital decision is made on lifetime cost, not sticker price. See below the waterline before you sign.