A water main that costs $180 per foot to install can cost four times that amount to operate, repair, and eventually replace over its service life — and almost no utility budgets for that reality up front. Lifecycle cost is the practice of tracking every dollar an asset consumes from design through disposal, not just the number on the purchase order. Utilities that only track acquisition cost end up defending capital requests with guesswork, while utilities that track full lifecycle cost walk into a rate case with a number nobody can argue with. Buried infrastructure is where this gap hurts most, since operations and maintenance spend on pipes, pumps, and tanks can run several times higher than what it cost to build them. See how utilities are closing that gap with a short walkthrough of Oxmaint's lifecycle cost tracking.
Water Utility Lifecycle Cost Software: See the Total Cost Behind Every Pipe, Pump, and Tank
Most capital planning starts and ends with acquisition cost — what it cost to buy and install an asset. But acquisition is usually the smallest line item over an asset's life. Operations, maintenance, rehabilitation, and eventual replacement dwarf the original purchase price, and a utility that cannot show that full picture struggles to defend rate increases or prioritize its capital improvement plan.
Every Water Asset Moves Through the Same Five Cost Stages
A pipe, a pump, a tank, or a meter all pass through the same lifecycle regardless of asset type. Lifecycle cost tracking means capturing spend at every one of these stages against the specific asset, not lumping it into a general operating budget where it disappears.
Acquisition Is the Smallest Piece of the Total Cost Picture
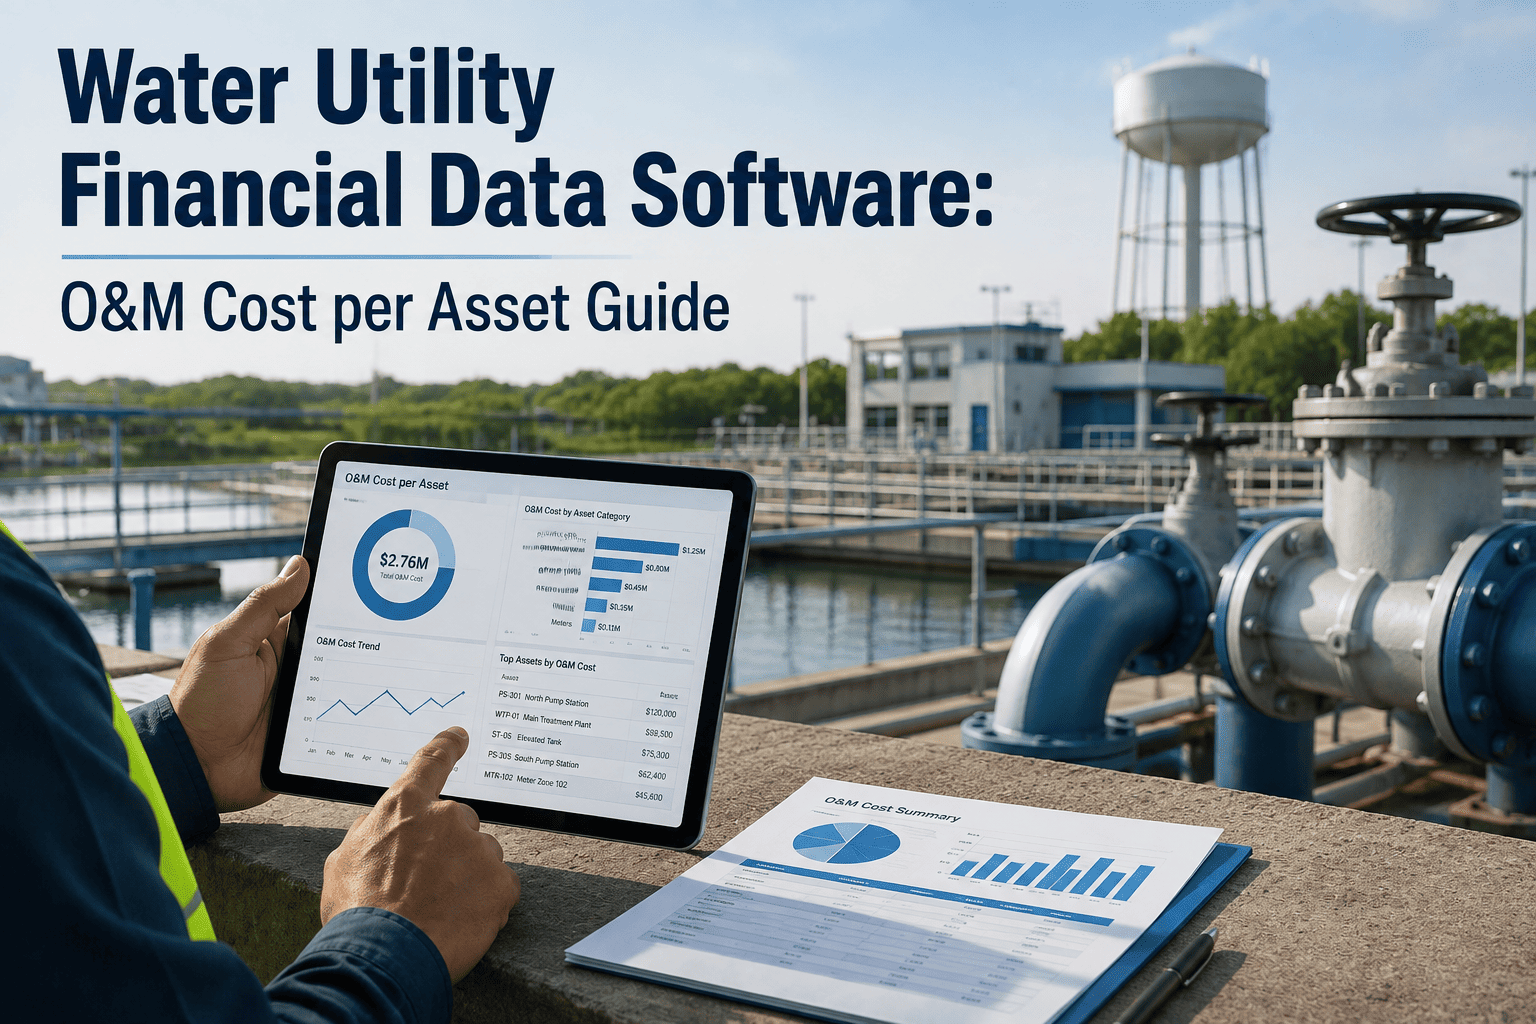
For a typical buried water asset, the purchase and installation cost is only a fraction of what the asset consumes over its service life. Operations and maintenance — the stage utilities track the least precisely — is usually the largest cost driver by a wide margin.
Illustrative lifecycle cost split for a typical buried water asset over a multi-decade service life. Your own ratio will vary by asset class and material, which is exactly why it needs to be tracked per asset rather than assumed.
Lifecycle Cost Behaves Differently for Every Asset Type
A pump station and a buried pipe segment reach end of life through completely different cost patterns. Tracking lifecycle cost by asset class shows where capital dollars actually move the needle.
| Asset Class | Typical Service Life | Dominant Cost Stage | Main Financial Risk |
|---|---|---|---|
| Buried distribution pipe | 50 – 100 years | Operations & maintenance | Main breaks and emergency excavation costs |
| Pump stations and motors | 15 – 25 years | Energy and preventive maintenance | Unplanned motor failure and energy inefficiency |
| Storage tanks | 30 – 50 years | Rehabilitation cycles | Deferred recoating and structural inspection |
| Water meters and AMI | 15 – 20 years | Acquisition and field service | Choosing lowest purchase price over lowest lifecycle cost |
| Treatment plant equipment | 10 – 30 years | Operations & maintenance | Reactive repair replacing scheduled preventive work |
Build a Capital Plan Your Board and Ratepayers Cannot Argue With
A capital request built on verified O&M spend, repair frequency, and full lifecycle cost history is far harder to challenge than one built on a purchase price alone. Oxmaint ties every dollar spent on an asset back to its full lifecycle record automatically.
What Oxmaint Tracks Against Every Water Asset
Four Utilities, Four Different Lifecycle Cost Blind Spots
Lifecycle cost problems show up differently depending on utility size and asset mix. Here is how the same tracking approach solves each one.
Small utilities are increasingly expected to show a formal asset management program with lifecycle costing behind it, but often lack staff to build one manually. Automated lifecycle tracking gives a small team a 20-year capital replacement plan without a dedicated financial analyst.
Treatment plant equipment often runs reactive until failure because preventive schedules compete with day-to-day operations. Tracking the reactive-to-preventive spend ratio per asset surfaces which equipment is quietly draining the O&M budget before it becomes an emergency.
A rate increase request built on verified lifecycle cost history is far more defensible than one built on a general inflation estimate. Full asset-level records give the finance team a source of truth that survives regulatory review.
The lowest purchase price does not always mean the lowest lifecycle cost — a cheaper meter or pump can carry higher failure, service, and replacement costs over time. Comparing vendors on projected lifecycle cost instead of unit price changes which bid actually wins.
Find Out Which of Your Assets Are Quietly Costing More Than They Should
Most utilities are surprised by which asset class is actually driving their O&M budget once lifecycle cost is tracked asset by asset instead of estimated at the fund level.
What Changes When Lifecycle Cost Is Tracked Per Asset
Water Utility Lifecycle Cost — Frequently Asked Questions
What is included in water asset lifecycle cost?+
Why does O&M cost more than the original construction for buried assets?+
How does lifecycle cost tracking help with a rate case?+
Can a small utility with limited staff track lifecycle cost without a dedicated analyst?+
How quickly can a utility see its true lifecycle cost picture?+
We always knew our pump stations were expensive to run, but we had no way to prove it to the board with real numbers. Once we tracked O&M spend against each asset, one pump station alone accounted for nearly a third of our total maintenance budget. That single number got our replacement request approved on the first vote.
— Utilities Director, Regional Water Authority
Stop Budgeting Off Purchase Price When O&M Is Where the Real Cost Lives
Oxmaint ties acquisition, O&M, rehabilitation, and replacement cost to every water and wastewater asset automatically, so your capital plan and your rate case are built on the same defensible number.