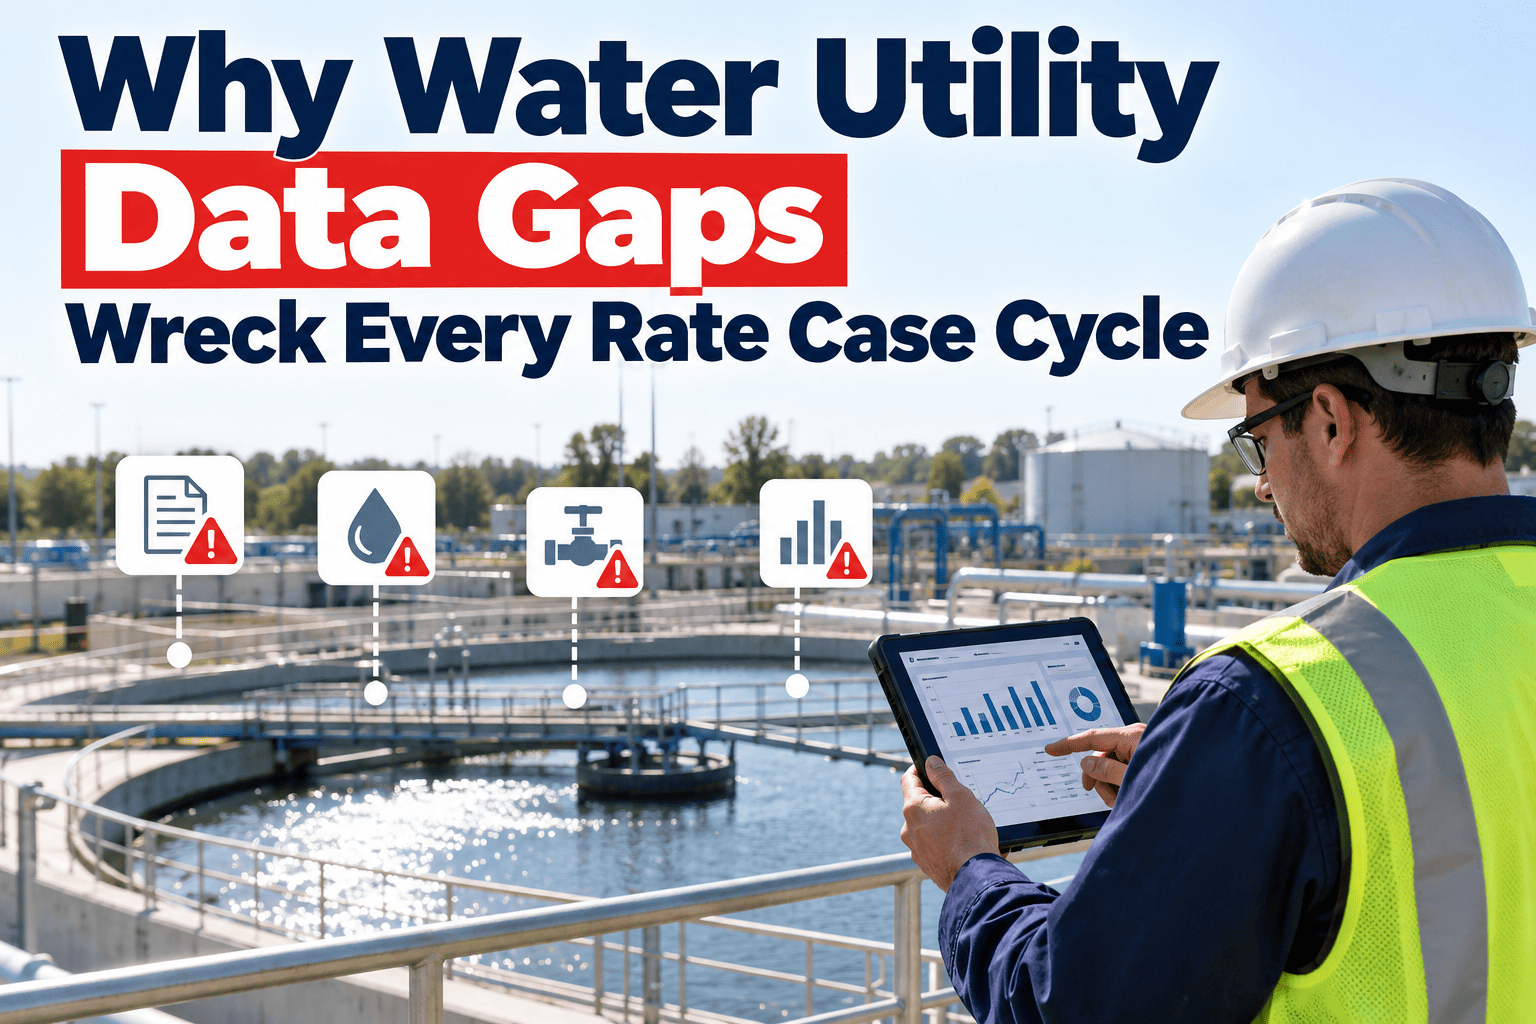
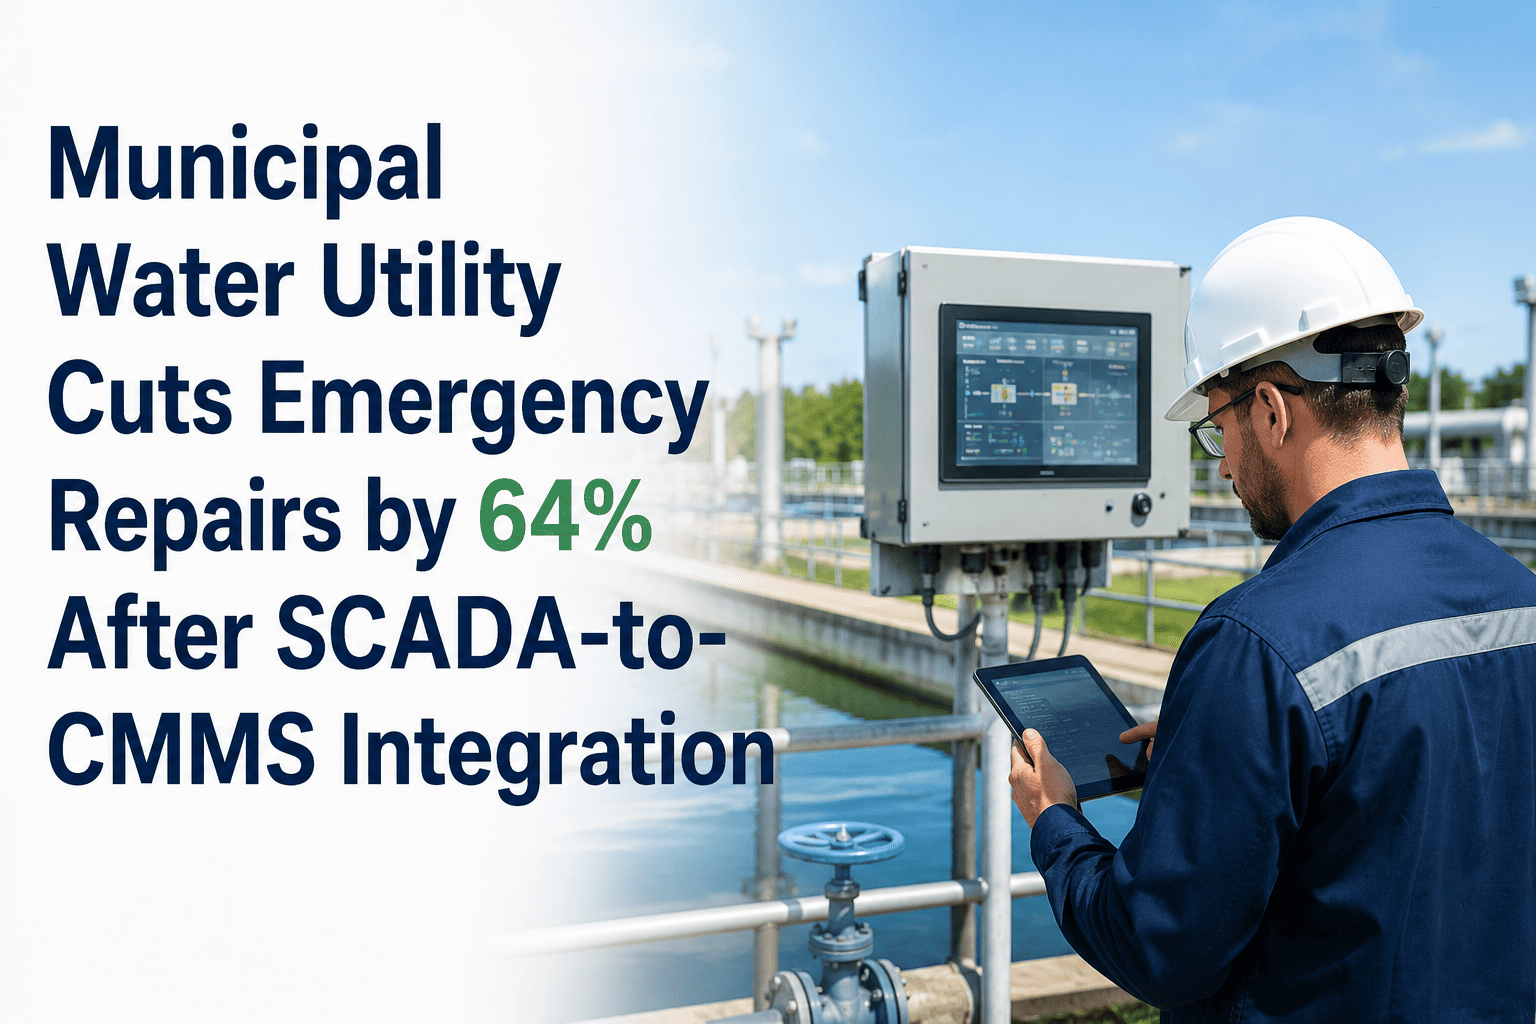
US municipal water utilities lose an estimated $2.6 billion annually to unplanned pump failures, aging distribution infrastructure, and reactive maintenance cycles that cost 3 to 5 times more than planned interventions. When a mid-sized municipal water authority managing 14 pump stations, two water treatment plants, and 380 miles of distribution main found its emergency repair ratio climbing to 51% of total maintenance spend, leadership faced a choice between capital replacement and operational reform. Book a demo to see how Oxmaint delivers predictive pump monitoring and SCADA-integrated compliance documentation for municipal water operations.
Case Summary
A municipal water authority serving 87,000 residents deployed Oxmaint with SCADA integration across 14 lift stations and two water treatment plants to shift from a reactive maintenance model to predictive pump monitoring and automated compliance scheduling. Within 12 months, equipment downtime fell 40%, EPA Safe Drinking Water Act compliance violations dropped 70%, emergency repair spend declined from 51% to 22% of total maintenance budget, and the authority passed its first State Revolving Fund inspection with zero findings — unlocking $3.8M in low-interest infrastructure financing.
40%
reduction in total equipment downtime across pump stations and treatment plant assets at 12 months
70%
drop in EPA Safe Drinking Water Act compliance violations from baseline year to post-deployment year
$1.4M
in taxpayer-funded emergency repair costs avoided in the first 12 months of operation
8 wks
from deployment start to live SCADA-integrated predictive monitoring across all 14 pump stations
Background: A Water Authority Operating at Reactive Maintenance Limits
The authority's maintenance program had operated without a structured CMMS for over a decade. PM scheduling was managed through paper logbooks at each pump station and a shared spreadsheet updated by the maintenance supervisor. Inspection records for Safe Drinking Water Act compliance were captured on paper forms and filed in binders at each facility. When state environmental regulators requested documentation of the authority's chlorine residual monitoring and backflow prevention inspection program during a routine compliance review, the compliance officer required 11 days to compile the requested records from 14 separate site files. Book a demo to see how Oxmaint structures a defensible CIP budget justification from real asset condition and maintenance cost data.
01
51% Emergency Repair Ratio Draining Taxpayer Funds
Over half the $4.2M annual budget went to reactive repairs at 3–5x planned cost. Unplanned pump failures averaged $87,000 per event — with no structured PM program to reverse the trend.
02
No SCADA-to-Work-Order Integration at Lift Stations
SCADA alarms at 9 of 14 stations were monitored but never converted to work orders. Alarm-to-response averaged 4.2 hours. Four pump failures that year had generated recurring alarms for weeks before failing.
03
Paper-Based Compliance Records Creating Regulatory Risk
Paper records across 14 sites required 11 staff-days to compile for state review. Three EPA documentation findings in the prior year resulted in a formal notice of violation and $18,500 in penalties.
04
Disconnected CIP Justification With No Asset Condition Data
CIP requests were built on age estimates, not condition data. City council cut two consecutive submissions for lack of evidence — blocking the $6.8M pump replacement program the authority needed.
Why Oxmaint Was Selected Over Competing CMMS Platforms
The authority evaluated four CMMS platforms over a 90-day procurement process. The evaluation committee included the Director of Public Works, the Water Operations Manager, the Compliance Officer, and the IT Director. The three primary selection criteria were: native SCADA alarm-to-work-order conversion without custom middleware, EPA and Safe Drinking Water Act compliance documentation built into the PM workflow rather than as a separate module, and deployment timeline short enough to produce compliance documentation improvements before the next state regulatory review cycle.
Native SCADA Alarm-to-Work-Order Conversion
Connects to existing pump station SCADA via OPC-UA and Modbus. Alarm thresholds map directly to PM work order triggers — no custom middleware, no configuration sprints after deployment.
EPA Compliance Documentation in PM Workflow
Safe Drinking Water Act templates, chlorine residual logs, and backflow prevention records are embedded in the PM workflow. Every completed task auto-generates a timestamped, operator-attributed compliance record.
Asset Condition Registry With RUL Engine
Full FCI scoring and Remaining Useful Life calculation for pumps, valves, clarifiers, and distribution mains — producing condition-based CIP evidence that city councils approve, not age-estimate guesswork.
8-Week Deployment Before Next Compliance Review
With a state review 4 months out, all 14 pump stations and both treatment plants were deployed in 8 weeks via mobile QR scanning — no lengthy enterprise IT implementation required.
Implementation: Eight Weeks Across 14 Pump Stations and Two Treatment Plants
Deployment was structured in four phases, prioritizing SCADA integration and compliance documentation capability first. The authority's operations were unionized, and the implementation team followed Oxmaint's phased rollout protocol — introducing mobile field tools to crews in training sessions before go-live rather than changing work assignment procedures unilaterally. All PM assignments and work order closures continued through existing supervisor-crew reporting protocols during the transition period.
Week 1–2
Asset Registry and SCADA Integration
Assets Registered
1,247
Pumps, motors, valves, chemical feed systems, HVAC, and electrical across all 16 facilities via mobile QR scanning
SCADA Connections
9 stations live
OPC-UA connection to existing SCADA hardware at 9 of 14 pump stations — alarm thresholds mapped to PM triggers
Historical Work Order Import
24 months
Two years of paper-based maintenance logs digitized and imported to establish MTBF baselines per pump asset
Week 3–4
Compliance Templates and PM Schedule Activation
Compliance Templates
62 configured
Safe Drinking Water Act, EPA, OSHA confined space, and backflow prevention inspection templates per facility type
PM Tasks Activated
218 per cycle
Full PM schedule deployed across daily, weekly, monthly, and quarterly tiers for all pump station and treatment plant assets
Crew Training
1.5 days per crew
Mobile field app training for all 23 technicians across three shifts — GPS check-in and QR work order closure procedures
Week 5–8
Predictive Monitoring Configuration and CIP Dashboard
Predictive Thresholds
74 pump assets
Motor amperage, vibration, and temperature thresholds configured for all high-criticality pump assets with auto-work-order generation
RUL Scoring Live
All major assets
Remaining Useful Life calculations active for pumps, motors, clarifiers, and filter systems — FCI scores generated per facility
CIP Dashboard
5-year forecast live
Capital improvement plan forecasting dashboard populated from asset condition data — ready for the upcoming city council budget cycle
Month 4–12
State Regulatory Review and 12-Month Operational Results
Regulatory Review Outcome
Zero findings
First clean state compliance review in 4 years — all Safe Drinking Water Act documentation produced directly from Oxmaint in under 2 hours
SRF Financing Unlocked
$3.8M approved
State Revolving Fund low-interest infrastructure financing approved following clean inspection — asset condition documentation from Oxmaint supported the application
Emergency Repair Ratio
51% to 22%
Emergency repair share of total maintenance budget reduced from 51% to 22% at 12 months — $1.4M in taxpayer savings redirected to planned capital projects
EPA, Safe Drinking Water Act, and AWWA Standards — One Platform Across Every Framework.
Oxmaint generates compliant inspection documentation for Safe Drinking Water Act, EPA Clean Water Act, OSHA confined space, and AWWA standards directly from the same dashboard your maintenance crew uses for daily PM scheduling and work order management. No post-processing. No paper filing. No 11-day compliance record scrambles before a state review.
Platform Capabilities Deployed Across This Water Authority
SCADA Alarm-to-Work-Order Conversion
OPC-UA and Modbus integration converts pump station alarms into PM work orders automatically. Alarm-to-response reduced from 4.2 hours to 38 minutes. Four assets flagged for predictive intervention before failure in the first 6 months.
Predictive Pump Monitoring
Amperage deviation, vibration trending, and temperature thresholds monitored across 74 high-criticality pump assets. RUL updates from live SCADA data. PM work orders auto-generated when condition thresholds breach — before failure.
EPA Compliance Documentation Automation
Inspection templates, chlorine logs, and OSHA confined space records embedded in the PM workflow. Every task generates a GPS-located, timestamped compliance record. State review completed in 2 hours vs prior 11-day preparation.
Asset Condition Registry and FCI Scoring
Full FCI scoring across both treatment plants and 14 pump stations. Scores update from inspection outcomes and work order history. Treatment Plant A improved from FCI 0.31 (poor) to 0.17 (fair) in 12 months.
Capital Improvement Plan Forecasting Dashboard
Rolling 5-year CIP forecast from asset condition data and RUL projections. City council approved a $2.1M pump replacement line item based on Oxmaint FCI data — after cutting two prior age-estimate submissions.
Mobile Field App With GPS Check-In
Technicians close work orders and log compliance records from mobile devices with GPS check-in on every task. Paper logbooks at all 14 pump stations were fully eliminated within 6 weeks of deployment.
Operational KPI Performance at 12 Months
PUMP STATION AVAILABILITY
94.2%
Fleet availability for emergency response vehicles and water delivery pumps must exceed 92%. At 94.2%, the authority exceeds industry benchmark for the first time in 6 years.
PM COMPLIANCE RATE
91%
PM compliance rate measures scheduled preventive maintenance tasks completed on time. Best practice for water utilities is 92% or above. At 91%, the authority is 1 point below target — up from 54% at baseline.
UNPLANNED OUTAGE EVENTS
7
Unplanned pump station outage events per year. Reduced from 24 at baseline to 7 at 12 months post-deployment — a 71% reduction driven by SCADA-triggered predictive intervention before failure.
EPA INSPECTION PASS RATE
100%
EPA and state Safe Drinking Water Act inspection pass rate. First clean inspection in 4 years — zero findings at state regulatory review. Prior year had 3 documentation findings resulting in $18,500 in penalties.
WATER LOSS RATE
8.4%
Non-revenue water loss as a percentage of total production. Reduced from 12.1% at baseline. Distribution main valve inspection tracking and leak work order data contributed to identifying two chronic loss points that were proactively repaired.
AVG RESPONSE TIME TO FAULT
38 min
Average time from SCADA alarm trigger to technician work order response. Reduced from 4.2 hours at baseline to 38 minutes at 12 months through automated SCADA-to-work-order conversion and mobile dispatch to field crews.
Operational Improvement Results at 12 Months
Unplanned Pump Outage Reduction
71%
EPA Compliance Violation Reduction
70%
PM Work Order Completion Rate
91%
Emergency Repair Ratio Reduction (51% to 22%)
57%
Regulatory Compliance Record Preparation Time Savings
85%
Total Equipment Downtime Reduction
40%
Results at 12 Months: Key Outcomes for Taxpayers and Elected Officials
Equipment Downtime
40% Reduction
Equipment downtime across pump stations and treatment plants reduced 40% at 12 months. Unplanned outage events dropped from 24 per year to 7 through SCADA-triggered predictive intervention.
Taxpayer Savings
$1.4M Saved
Emergency repair spend fell from 51% to 22% of the $4.2M maintenance budget. $1.4M in taxpayer-funded repair costs avoided — redirected directly to the CIP pump replacement program.
Compliance Violations
70% Drop
EPA Safe Drinking Water Act violations down 70% from baseline. First clean state regulatory review in 4 years — all documentation pulled from Oxmaint in under 2 hours. Prior $18,500 in penalties eliminated.
Federal Financing Unlocked
$3.8M SRF
State Revolving Fund infrastructure financing approved following the clean compliance inspection. Asset condition documentation and FCI scoring from Oxmaint supported the SRF application directly — providing the evidence base regulators required for funding approval.
CIP Approval
$2.1M Approved
City council approved a $2.1M pump replacement capital line item based on Oxmaint-generated FCI and RUL data — after cutting two consecutive prior CIP submissions built on age estimates. Evidence-based capital justification changed the outcome.
Response Time
4.2 hrs to 38 min
SCADA alarm-to-technician-response time reduced from 4.2 hours to 38 minutes through automated work order generation and mobile dispatch. Citizen water service complaints decreased 44% in the 12 months following deployment.
Asset Lifecycle and Intervention Cost Table
| Asset Category |
Condition Rating |
Intervention Type |
Cost Now vs Cost if Deferred 5 Years |
| High-service pump (treatment plant) |
Fair — FCI 0.18, RUL 6 years |
Planned overhaul — impeller, seal, bearing replacement |
$28,000 planned overhaul now vs $95,000 emergency replacement with bypass in 3 to 4 years at current degradation rate |
| Lift station submersible pump |
Poor — FCI 0.34, RUL 2 years |
Scheduled replacement — next capital cycle |
$42,000 scheduled replacement vs $140,000 to $180,000 emergency replacement including bypass pump rental, overtime, and bypass permit |
| Chemical feed system (chlorination) |
Fair — FCI 0.22, annual PM current |
Preventive maintenance — annual calibration and component replacement |
$4,800 annual PM vs compliance violation risk — Safe Drinking Water Act failure penalty ranges from $5,000 to $25,000 per violation event |
| Distribution main valve (12-inch) |
Unknown — last operated 8 years ago |
Condition assessment and exercise program |
$1,200 condition assessment now vs $85,000 to $220,000 water main isolation failure during emergency repair if valve is non-operable |
| Blower (aeration basin) |
Good — FCI 0.08, PM compliant |
Predictive monitoring — continue current PM cycle with vibration trending |
$3,600 annual PM with vibration monitoring vs $62,000 emergency blower failure including treatment bypass and EPA notification requirements |
Frequently Asked Questions
QHow does Oxmaint integrate with an existing SCADA system at a pump station without replacing the SCADA hardware?
QWhat documentation does Oxmaint produce for EPA Safe Drinking Water Act compliance inspections?
QHow long does deployment take for a water utility with multiple pump stations and treatment plants across different sites?
Deployment for a water utility of this scale — 14 pump stations and 2 treatment plants — took 8 weeks from start to full operational status, including SCADA integration and EPA compliance template configuration. Asset registration uses mobile QR scanning, which eliminates the manual data entry phase that extends enterprise system deployments. Most water utilities of comparable scale are fully operational within 6 to 10 weeks.
QAs a Water Authority Director presenting to city council, how do I justify the CMMS investment when the capital budget is already under pressure?
The financial case is straightforward: a water utility spending 51% of its maintenance budget on reactive repairs is spending 3 to 5 times more per repair event than planned maintenance costs. Shifting that ratio by even 15 percentage points on a $4.2M maintenance budget produces over $1M in annual savings — exceeding the CMMS cost in year one. Oxmaint's CIP forecasting dashboard also produces the evidence-based condition data that council members require before approving capital line items.
Book a demo to build a budget-cycle ROI model specific to your utility's current maintenance spend profile.
QDoes the same Oxmaint platform work across public works, parks, and fleet departments in addition to water utilities?
Yes. Oxmaint is built for multi-department government operations — water, public works, parks, fleet, and facilities can all operate from the same platform with role-based access controls for each department. Asset hierarchies mirror government org structures, and departmental KPI dashboards are independent while consolidating at the city or county portfolio level. This is a meaningful operational advantage for water main breaks that affect public works and parks simultaneously.
QCan Oxmaint produce the asset condition documentation required for a State Revolving Fund infrastructure financing application?
Yes. State Revolving Fund applications require documented asset condition assessments and evidence of structured maintenance programs as eligibility criteria. Oxmaint's FCI scoring, RUL projections, and PM compliance history reports satisfy the asset documentation requirements for SRF applications in most states. The water authority in this case study had its $3.8M SRF application approved following the first clean regulatory inspection after deployment.
Book a demo to review SRF documentation output formats for your state program.
Continue Reading
Eliminate Reactive Pump Failures and Compliance Documentation Gaps at Your Water Utility
Oxmaint connects to your existing SCADA systems, automates EPA Safe Drinking Water Act compliance documentation, and produces the asset condition evidence your city council needs to approve capital improvement plan funding — all from a single platform your maintenance team is using for daily PM scheduling within 8 weeks of deployment.
SCADA-to-Work-Order Integration
EPA Compliance Documentation
Pump Station PM Scheduling
Audit Trail Reporting