Every dollar in a municipal fleet budget is also a public dollar, and public dollars get audited, questioned, and voted on. A repair invoice that never gets tied back to a specific vehicle is much harder to defend at budget season than a cost-per-mile figure a council member can compare year over year. Vehicles ten years or older typically cost around 35 percent more per mile to run than newer assets, yet many fleets still cannot say which units are actually driving that number up. Tracking maintenance cost at the individual vehicle level, not just the department total, turns a defensive budget meeting into a data-backed one. See how that tracking works with a free trial or a quick demo.
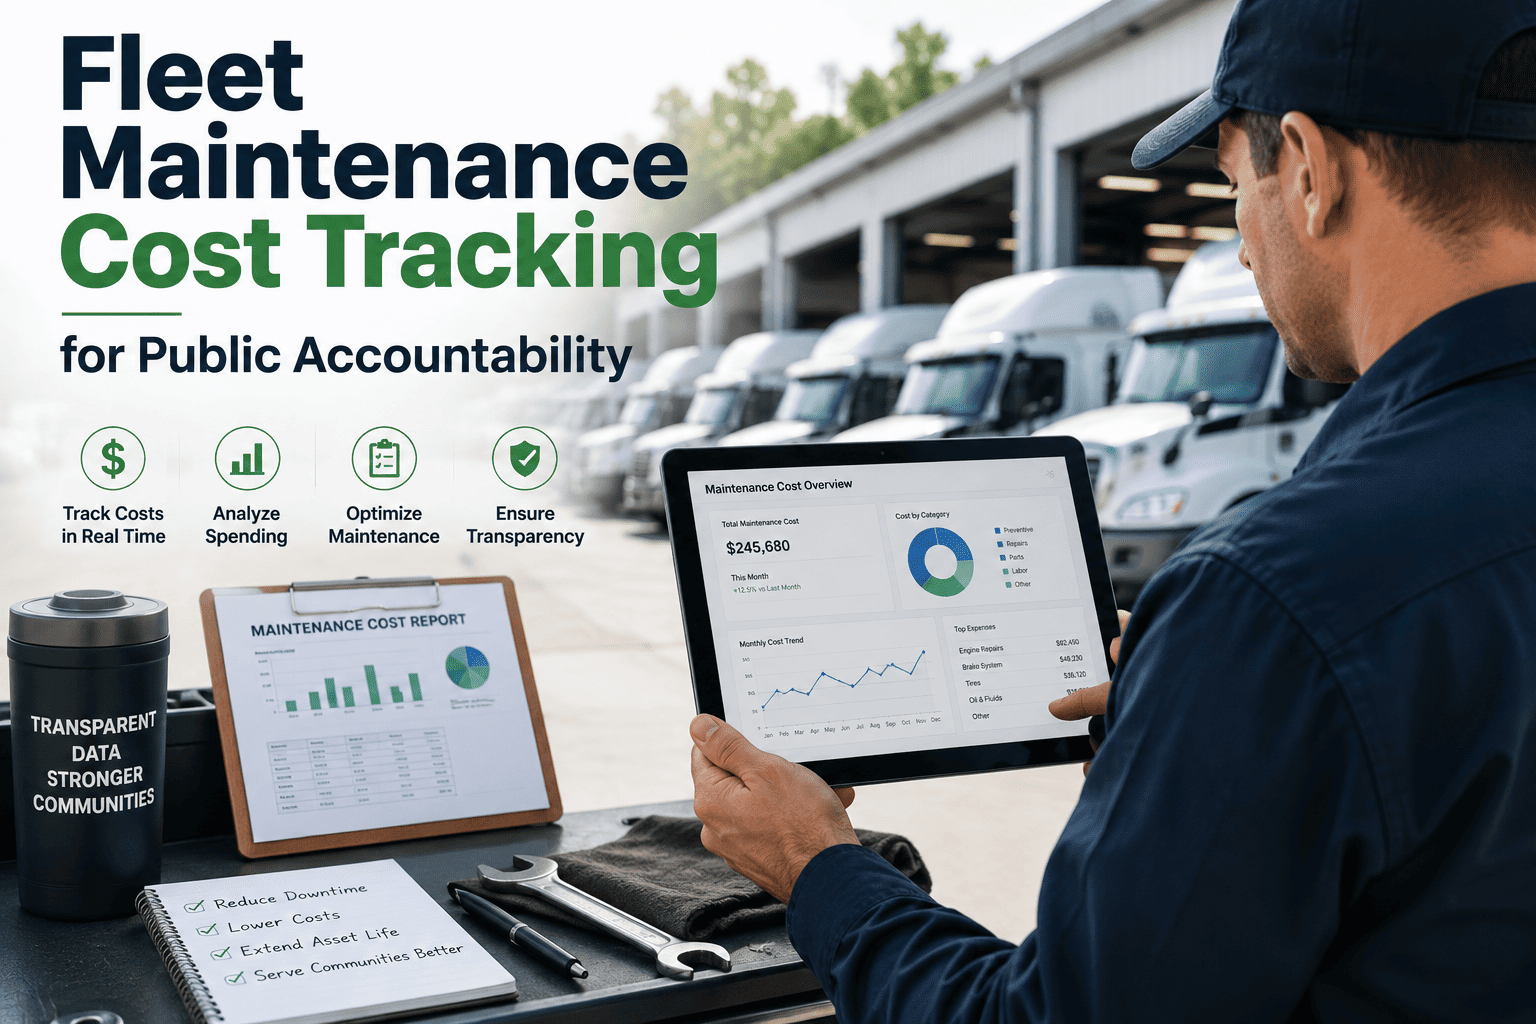
Fleet Maintenance Cost Tracking for Public Accountability
A fleet budget nobody can break down by vehicle is a budget nobody can defend. Here is what public fleet managers track to turn spending into a case, not just a number.
The Question Every Fleet Budget Defense Comes Down To
A council member or finance director does not respond well to a general complaint about an aging vehicle. They respond to a number they can compare against last year's number. Cost tracking is what turns one into the other.
This vehicle keeps breaking down. We think it needs to be replaced soon.
Unit 14 cost $6,200 in repairs this year, 31 percent of its current value, and its cost per mile is now double the fleet average.
Give Every Vehicle Its Own Cost Record
Oxmaint ties every work order, part, and labor hour back to a single vehicle, then rolls it into cost per mile and total cost of ownership automatically. Finance departments export the same numbers straight into budget and council reports without rebuilding a spreadsheet each quarter.
Metrics That Build a Fleet Budget Case
Total department spend tells finance almost nothing about which vehicles are worth keeping. These four metrics, tracked per vehicle, are what actually support a budget or replacement decision.
Total fixed and variable cost divided by miles driven, the single number that lets a pickup truck be compared fairly against a dump truck.
Purchase price, fuel, maintenance, insurance, and depreciation combined over the vehicle's life, the number a replacement decision should rest on.
Annual maintenance spend measured against the vehicle's current value, the ratio that turns a repair-or-replace debate into arithmetic.
What an out-of-service vehicle costs in delayed work orders, overtime, or rental coverage, a cost that never shows up on a repair invoice.
How the Two Approaches Actually Compare
Most public fleets are not choosing to track costs this way, it is the default once invoices, fuel cards, and work orders each live in a different system.
| Question | Scattered Spreadsheets | Centralized Cost Tracking |
|---|---|---|
| Which vehicle costs the most to run? | Requires pulling invoices from several files | A ranked cost-per-vehicle report, always current |
| How do you defend a replacement request? | A supervisor's opinion and a repair history | Repair cost measured as a percentage of value |
| How is fuel cost tied to the vehicle? | A separate system reconciled by hand monthly | Logged against the vehicle and route automatically |
| What can an auditor actually see? | Whatever can be assembled before the deadline | An exportable, vehicle-level report on demand |
| How fast can finance answer a council question? | Days, while data is gathered department by department | Minutes, from one live dashboard |
Where Maintenance Cost Turns Into a Replacement Case
Fleet teams commonly weigh a vehicle's annual maintenance spend against its current value to decide whether it still belongs in service. It is a rule of thumb, not a mandate, but it gives a budget conversation a starting line instead of a guess.
Ratio shown is annual maintenance and repair spend divided by the vehicle's current market value.
Frequently Asked Questions
What is cost per mile and why does it matter for public fleets?+
How much more does an aging vehicle actually cost to maintain?+
What threshold do fleets use to justify replacement over repair?+
How does per-vehicle cost tracking support budget transparency?+
How does Oxmaint help track fleet maintenance costs?+
Make Every Fleet Dollar Easy to Defend
Cost per vehicle, not cost per department, is what holds up in a budget hearing. See your own fleet's numbers laid out that way in the first 30 days.