Most public works directors cannot answer a city council question about their emergency repair ratio, average work order close time, or cost per square foot of maintained facility — because the data is locked in paper logs, disconnected spreadsheets, and unstructured email chains. Without tracked KPIs, capital budget justifications are built on estimates, accountability reviews fail, and deferred maintenance compounds at 7% annually with no defensible evidence to stop it. Book a demo to see how Oxmaint delivers a live government maintenance KPI dashboard with public accountability reporting built in.
Quick Answer
Government maintenance KPIs are the quantified operational metrics — PM completion rate, emergency repair ratio, work order response time, cost per facility square foot, and deferred maintenance backlog — that enable public agencies to demonstrate stewardship of taxpayer assets, defend capital budget requests, and satisfy accreditation, OSHA, and federal grant audit requirements. A structured CMMS tracks and reports these metrics automatically, eliminating manual data assembly before every council presentation or inspector general review.
The 8 KPIs Every Government Maintenance Program Must Track
Public sector maintenance leadership is accountable to elected officials, auditors, and citizens. These eight metrics form the defensible evidence base for operational decisions and capital requests — and every one is tracked automatically in Oxmaint. Book a demo to see your agency's KPI dashboard configured.
01
PM Completion Rate
Industry avg: 61% · Target: 92%+
The percentage of scheduled preventive maintenance work orders completed on time. Below 80% signals reactive maintenance spiral. Required evidence for EPA, FHWA, and HUD grant compliance audits.
02
Emergency Repair Ratio
Industry avg: 38–44% · Target: Under 20%
Emergency repairs cost 3–5x more than planned interventions. A $400K maintenance budget at 40% emergency ratio wastes $160K+ annually in avoidable premium costs that a structured PM program eliminates.
03
Work Order Response Time
Typical without CMMS: 14–22 days · Target: Under 5 days
Average days from citizen or staff request submission to verified work order close-out. Directly measured in accreditation self-studies, inspector general reviews, and public records requests from elected officials.
04
Deferred Maintenance Backlog
Federal average: $130B+ across GSA portfolio · Compounds 7% annually
Total dollar value of needed but unfunded repairs. A $100K repair deferred 10 years becomes $600K+ in eventual reconstruction cost. Without this metric, capital budget requests fail city council review.
05
Facility Condition Index (FCI)
Good: Below 0.10 · Fair: 0.10–0.30 · Poor: Above 0.30
FCI = Deferred Maintenance Cost ÷ Current Replacement Value. The universally recognized asset condition rating for APPA, GSA, and federal grant reporting. Capital requests backed by FCI data achieve 88% approval vs. 47% for estimates.
06
Maintenance Cost per Square Foot
Municipal benchmark: $3.50–$6.80/sq ft annually
Total maintenance spend divided by maintained gross square footage. Enables direct peer comparison for budget justification and identifies buildings with disproportionate costs warranting lifecycle replacement decisions.
07
Inspection Compliance Currency
OSHA, EPA, FHWA require 100% · Typical without CMMS: 61–74%
Percentage of regulatory inspection intervals completed on time — bridge inspections per NBIS, elevator certifications, generator load tests, HVAC inspections. Missed intervals create compliance findings and grant ineligibility.
08
Citizen Service Satisfaction Rate
Municipal target: 85%+ rated resolved within SLA
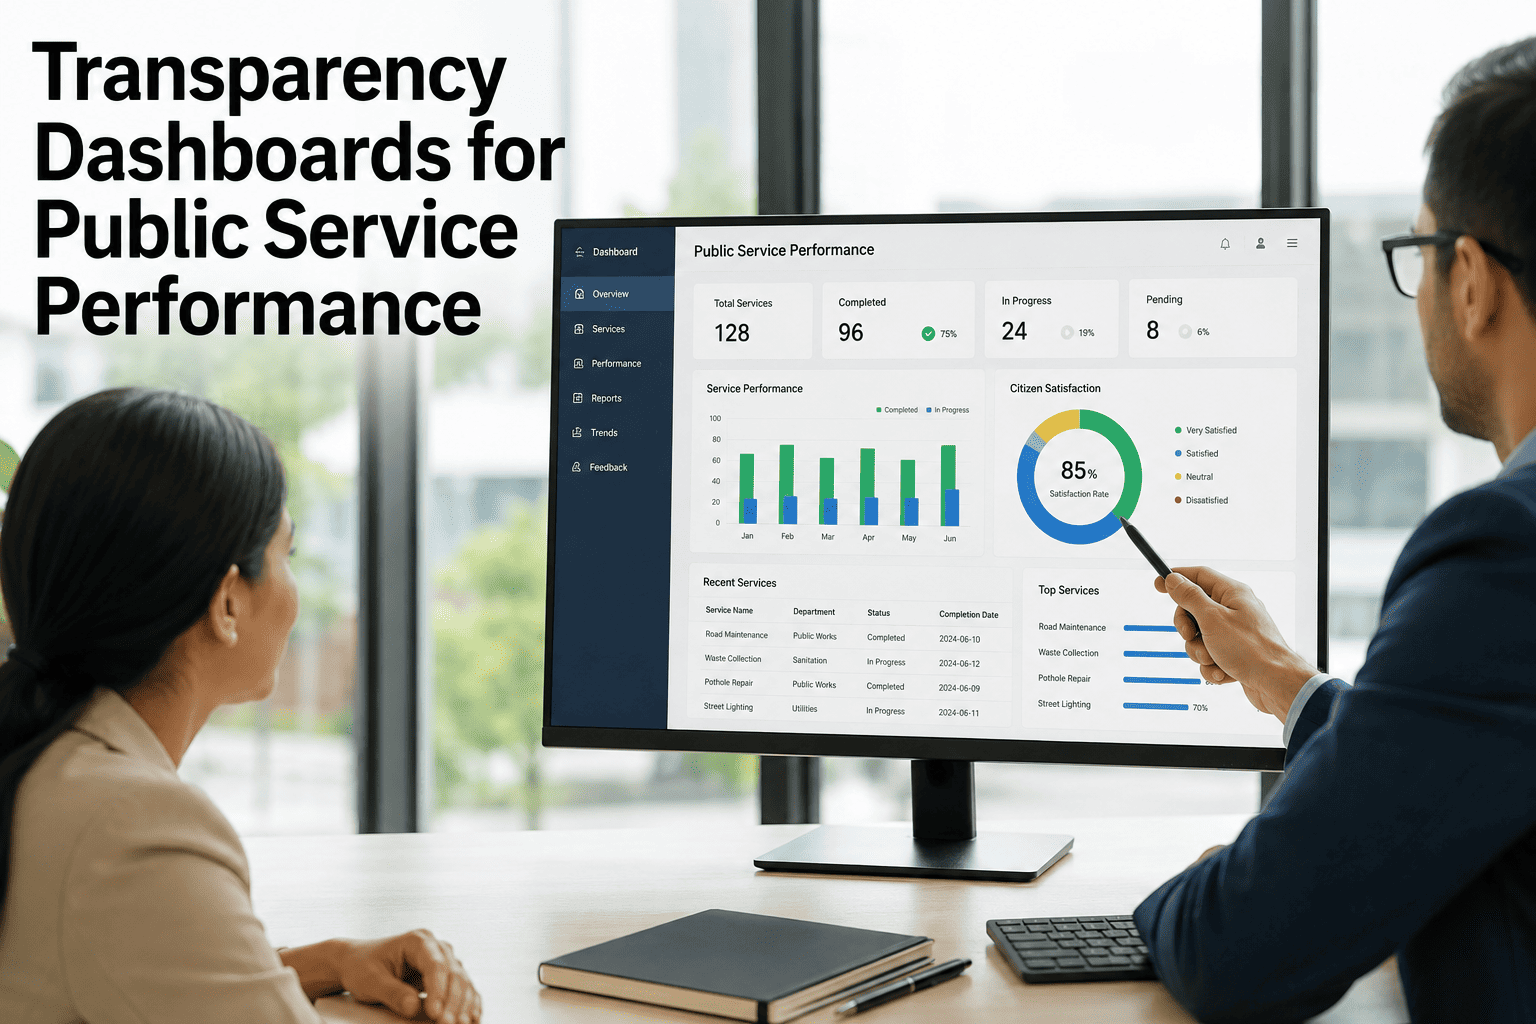
Percentage of citizen-reported maintenance requests closed within published SLA. Directly cited in public trust surveys, mayoral accountability reports, and 311 service delivery reviews visible to elected officials and media.
Live KPI Dashboard — Configured for Your Agency in Under 3 Weeks
Every one of these eight metrics tracked automatically from work order data — no manual reporting, no spreadsheet assembly before council presentations. Book a demo to see your agency's dashboard.
Why Government Agencies Fail Without Tracked KPIs
Untracked maintenance operations produce politically and financially costly outcomes — not from incompetence, but from the absence of defensible operational data at the moment accountability is demanded.
01
Capital Budget Requests Rejected
Without FCI scores and deferred maintenance backlog data, CIP requests appear as opinion rather than evidence. Agencies managing over $50M in assets on spreadsheets report 47% capital request approval rates versus 88% for data-backed submissions reviewed by city councils and boards of supervisors.
02
Inspector General and Audit Exposure
Federal and state auditors require documented PM completion rates, inspection currency, and work order close times. Agencies unable to produce these records within 72 hours of an audit notice face findings, funding suspension, and OSHA citations averaging $15,625 per violation.
03
Emergency Repair Cost Overruns
Without a tracked emergency repair ratio, budget overruns have no operational explanation that council members can act on. A public works department operating at 40% emergency ratio on a $3M budget is paying $480K+ annually in premium labor and contractor rates that PM investment would eliminate.
04
Federal Grant Documentation Gaps
Bipartisan Infrastructure Law, FHWA, EPA, and HUD grant programs require PM compliance rates, inspection records, and maintenance history as conditions of eligibility. Agencies without documented KPI evidence are ineligible for grant cycles averaging $400K–$2M per award — funding losses that dwarf the cost of a structured CMMS.
How Oxmaint Delivers Government KPI Tracking
01
Live KPI Dashboard with Role-Based Views
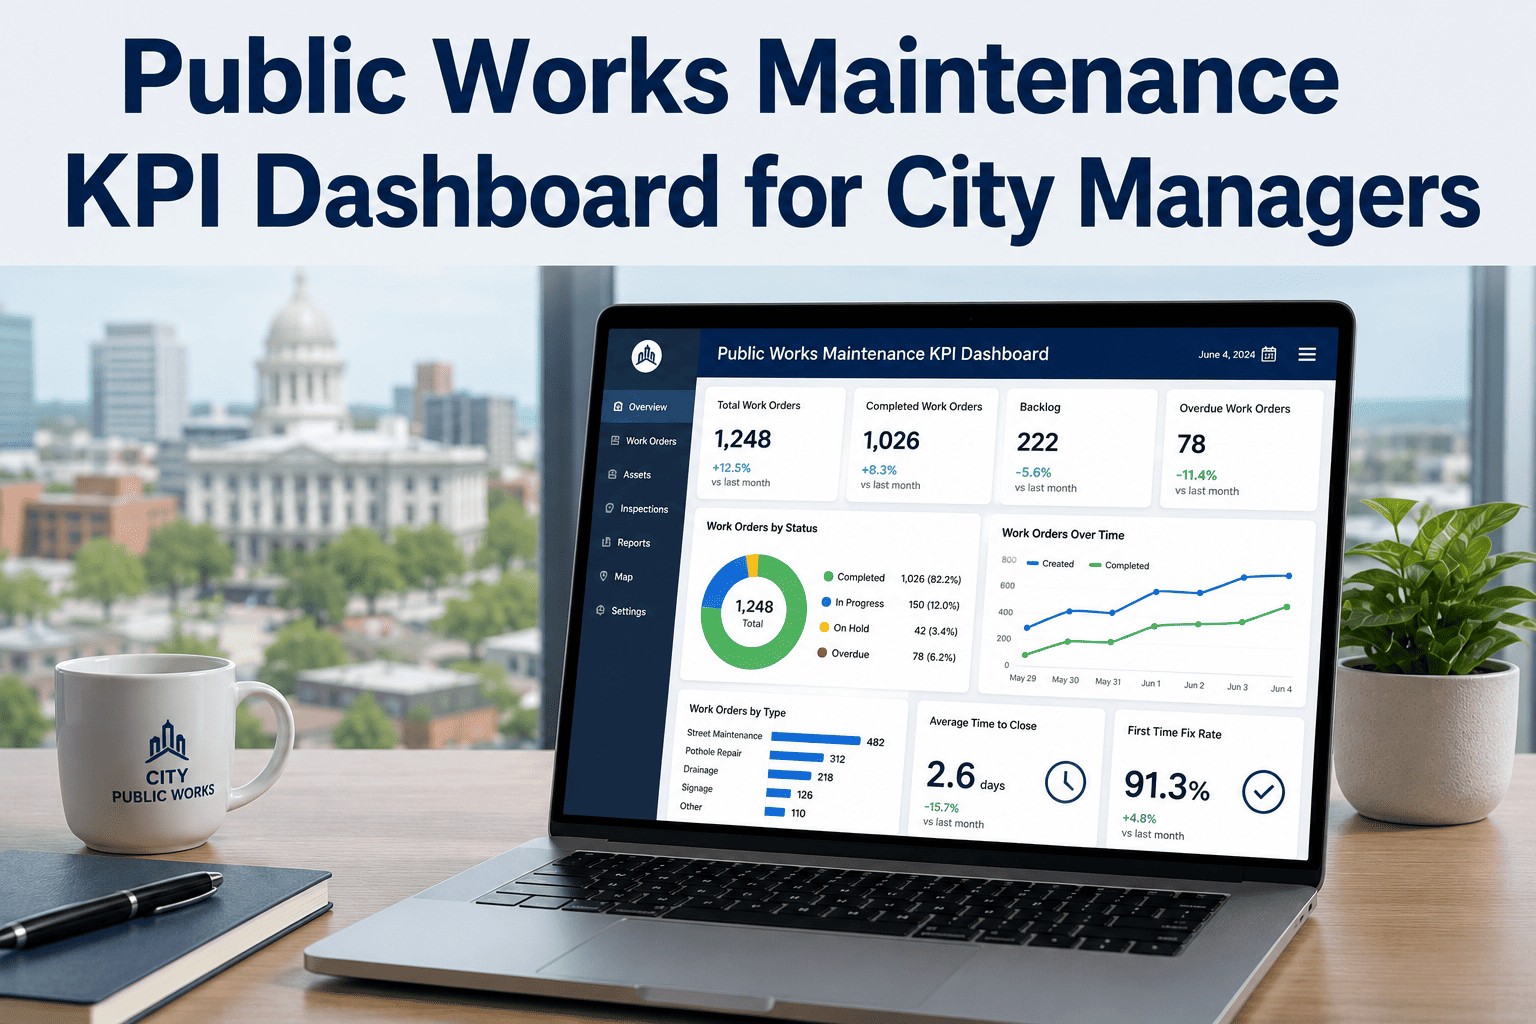
Oxmaint's KPI Dashboard tracks all eight critical metrics in real time — PM completion rate, emergency repair ratio, work order response time, FCI by facility, deferred maintenance backlog, cost per square foot, inspection compliance currency, and citizen satisfaction rate. Directors see the cross-department summary; technicians see their own queue. Council-ready reports export in under four hours with no manual data assembly.
02
Public Accountability Reporting Module
Oxmaint's Public Accountability Reports generate formatted performance summaries for city council presentations, annual reports, accreditation submissions, and public records requests — with PM compliance trend lines, emergency repair ratio trajectory, and work order response time distributions. Every report is timestamped, technician-attributed, and photo-evidenced for audit-ready documentation.
03
Benchmark Analytics Against Peer Agencies
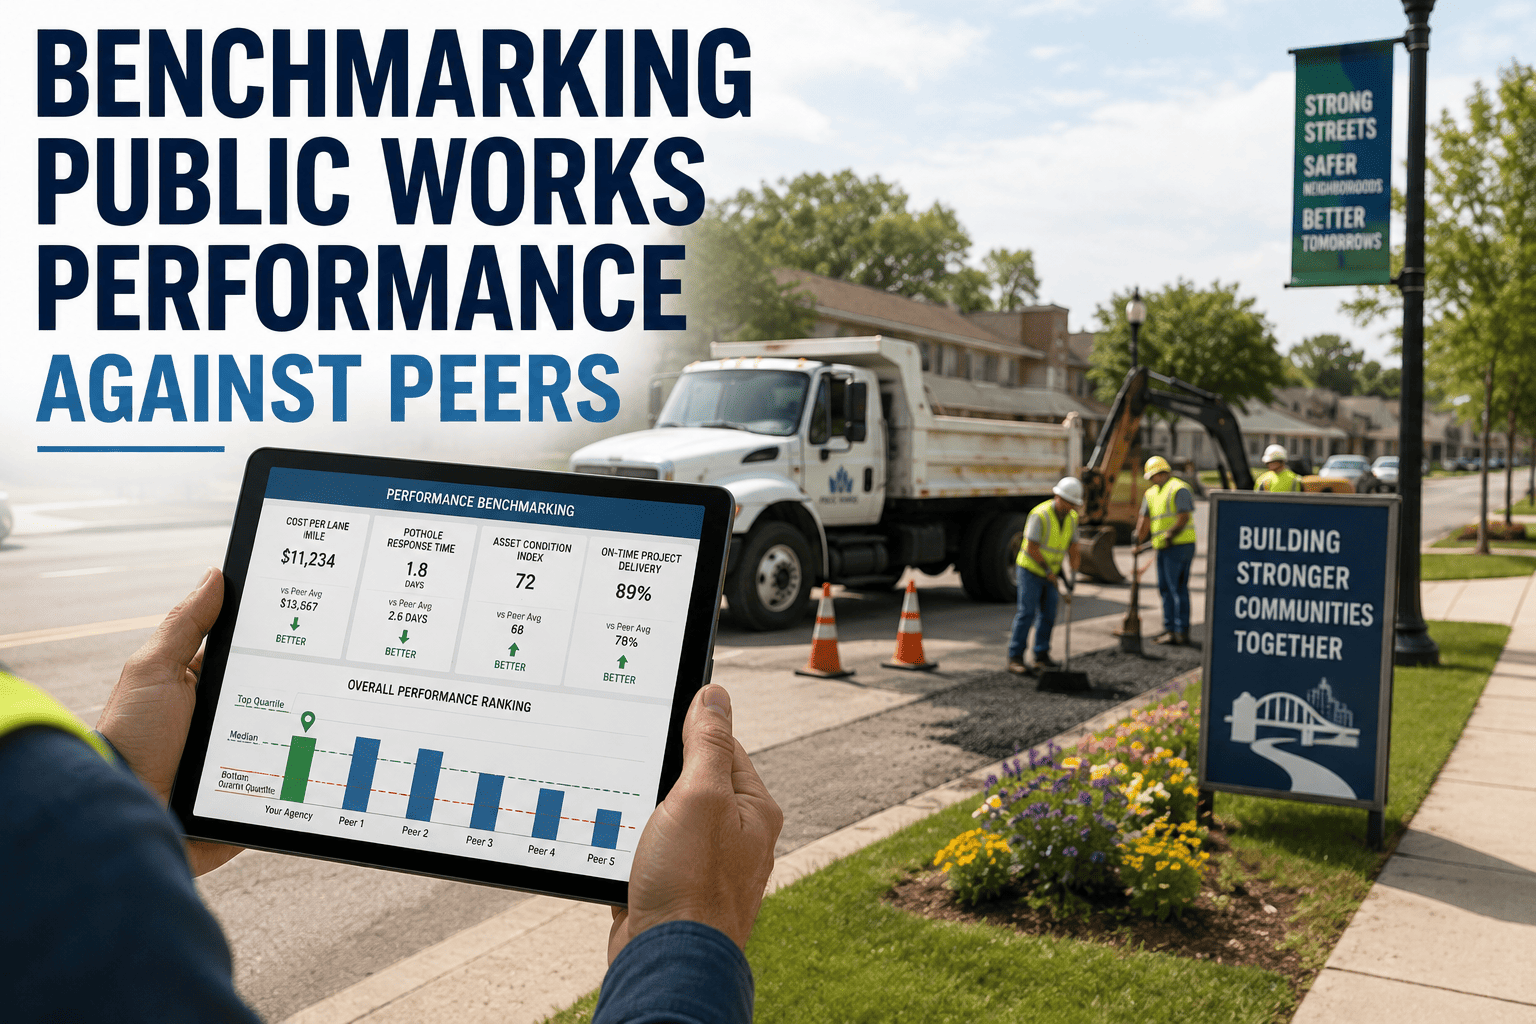
Oxmaint's Benchmark Analytics module positions your agency's KPIs against sector benchmarks — APPA standards for facility condition, APWA norms for public works PM compliance, and AWWA benchmarks for water utilities. Directors use these comparisons to justify staffing requests, capital investments, and technology procurement to budget authorities who require external validation of operational performance claims.
04
Automated Federal Grant Evidence Packages
Every completed work order and inspection record in Oxmaint contributes automatically to the PM compliance rate, inspection currency, and maintenance history evidence required for BIL, FHWA, EPA, and HUD grant applications. Grant documentation packages export in formats accepted by federal program officers — without any additional staff time for record compilation.
Platform Features for Government KPI Management
Live KPI Dashboard
All eight accountability metrics tracked in real time — updated from work order completion data without manual entry. Directors get current status before every council meeting with zero preparation time.
Public Accountability Reports
Formatted performance summaries for council presentations, annual reports, and public records requests — with trend lines and benchmarks. Export-ready in under four hours with full audit trail per work order.
Benchmark Analytics
KPI comparison against APPA, APWA, and AWWA sector standards — giving directors the peer-validated data needed to justify staffing, capital, and technology requests to budget authorities.
Emergency vs. Planned Ratio Tracker
Automatic categorization of every work order as planned or reactive — with rolling ratio trend over 12 months. Gives directors the operational evidence needed to justify PM investment to budget committees before the next cycle.
Federal Grant Evidence Packages
PM compliance rates, inspection records, and maintenance history exported in formats accepted by BIL, FHWA, EPA, and HUD program officers — protecting $400K–$2M in annual federal funding eligibility.
Deferred Maintenance Backlog Tracker
Real-time backlog dollar value by facility, department, and asset type — with 7% annual compounding projection to show council the true cost of inaction. FCI per building calculated automatically from work order data.
Government KPI Benchmarks — Current vs. Target
Emergency Repair Ratio
41%
Work Order Close Time
18 days
Inspection Compliance Rate
67%
FCI Score (Avg, Portfolio)
0.27
Citizen Request SLA Rate
54%
Outcomes — Oxmaint-Deployed Government Agencies
Reduction in Emergency Repair Ratio68%
Work Order Close Time Improvement74%
Capital Request Approval Rate88%
Federal Grant Audit Pass Rate100%
Citizen Request SLA Compliance Improvement81%
KPI Program Investment vs. Return
| KPI Program Element |
Annual Investment |
Annual Return / Avoidance |
Payback Period |
| Live KPI Dashboard |
$6,000 per agency |
$180,000+ in avoided emergency repair premium costs (20-point ratio shift) |
Under 2 weeks |
| Public Accountability Reports |
$4,000 per agency |
Council approval of capital requests averaging $400,000 per cycle |
First council presentation |
| Benchmark Analytics Module |
$5,000 per agency |
Staffing and technology budget requests approved with peer validation |
First budget cycle |
| Federal Grant Evidence Package |
$5,000 per agency |
Federal grant eligibility preserved — BIL and EPA awards averaging $750,000 |
First grant cycle |
| Full Oxmaint KPI Platform |
$18,000 per year |
$180,000+ in combined avoidance across repairs, grants, and capital outcomes |
Under 4 weeks |
Oxmaint delivers every government maintenance KPI automatically — PM completion rate, emergency repair ratio, FCI per facility, work order response time, and federal grant evidence — from a single platform with no manual reporting.
Frequently Asked Questions
QWhich KPIs do federal auditors and inspector general reviews most commonly request from government maintenance programs?
Federal reviews most frequently request PM completion rate, inspection compliance currency, emergency repair ratio, and deferred maintenance backlog by facility. Agencies unable to produce these within 72 hours face audit findings averaging $15,625 per violation.
Book a demo to see Oxmaint's audit export module.
QHow do tracked maintenance KPIs improve capital budget approval rates?
FCI-backed capital requests achieve 88% approval rates versus 47% for estimate-based submissions. Council members and budget directors require documented condition evidence — not anecdotal assessments — to authorize taxpayer-funded infrastructure investments.
Book a demo to see Oxmaint's FCI and CIP reporting tools.
QHow quickly can a government agency establish baseline KPIs in Oxmaint?
Most agencies complete asset registry setup, PM schedule configuration, and first dashboard population within two to three weeks. Baseline KPI data is visible from the first work order closed — no historical data import required to begin tracking.
Book a demo to review the deployment timeline for your agency.
QCan Oxmaint produce KPI reports formatted for specific grant programs like BIL or EPA funding?
Yes. Oxmaint's grant evidence packages export PM compliance rates, inspection records, and maintenance history in formats accepted by BIL, FHWA, EPA, and HUD program officers — protecting eligibility for grants averaging $400K–$2M per award cycle.
Book a demo to see the grant documentation export module.
QHow does Oxmaint handle KPI reporting across multiple departments with different asset types?
Role-based access gives each department — public works, water, fleet, parks — its own KPI view, while the director receives a unified cross-department dashboard with consolidated metrics for council and administrative reporting.
Book a demo to see multi-department KPI configuration.
QWhat benchmark data does Oxmaint use for government KPI comparison?
Oxmaint's Benchmark Analytics module uses APPA facility condition standards, APWA public works PM benchmarks, AWWA water utility norms, and APWA fleet management baselines — giving directors peer-validated comparisons to justify operational decisions to elected officials and budget authorities.
Book a demo to see the benchmark analytics module.
Continue Reading
Replace Manual Reporting with a Live Government KPI Dashboard — Starting This Week
Oxmaint tracks PM completion rate, emergency repair ratio, FCI per facility, work order response time, and federal grant evidence automatically — giving your agency the accountability data elected officials and auditors require, without manual assembly before every presentation.
KPI Dashboard
Public Accountability Reports
Benchmark Analytics
Federal Grant Evidence Packages