Fleet Vehicles Inspection Causes, Symptoms & Fix

By Taylor on January 21, 2026

fleet-vehicle-inspection

For municipal transit agencies and public works departments, fleet readiness is the ultimate KPI. Yet, a mid-sized city managing 250 vehicles—from police cruisers to refuse trucks—faced a crisis: 18% of their fleet was offline daily due to unscheduled repairs. This "break-fix" cycle cost taxpayers $1.2M annually in overtime and rental fees. Digital fleet inspections transformed their operations from reactive chaos to predictive precision.This "break-fix" cycle didn't just frustrate staff; it cost taxpayers $1.2M annually in overtime (for mechanics), emergency rental fees, and shortened vehicle lifespans. The root cause wasn't the vehicles themselves—it was a broken inspection process.

Case Study

Fleet Vehicles Inspection: Causes, Symptoms & Fixes for Public Agencies

How a municipal fleet reduced breakdown rates by 65% and extended vehicle life by 2.4 years using digital inspections and CMMS
65%
Breakdown Reduction
$420K
Annual Savings
100%
DOT Compliance
12mo
ROI Payback

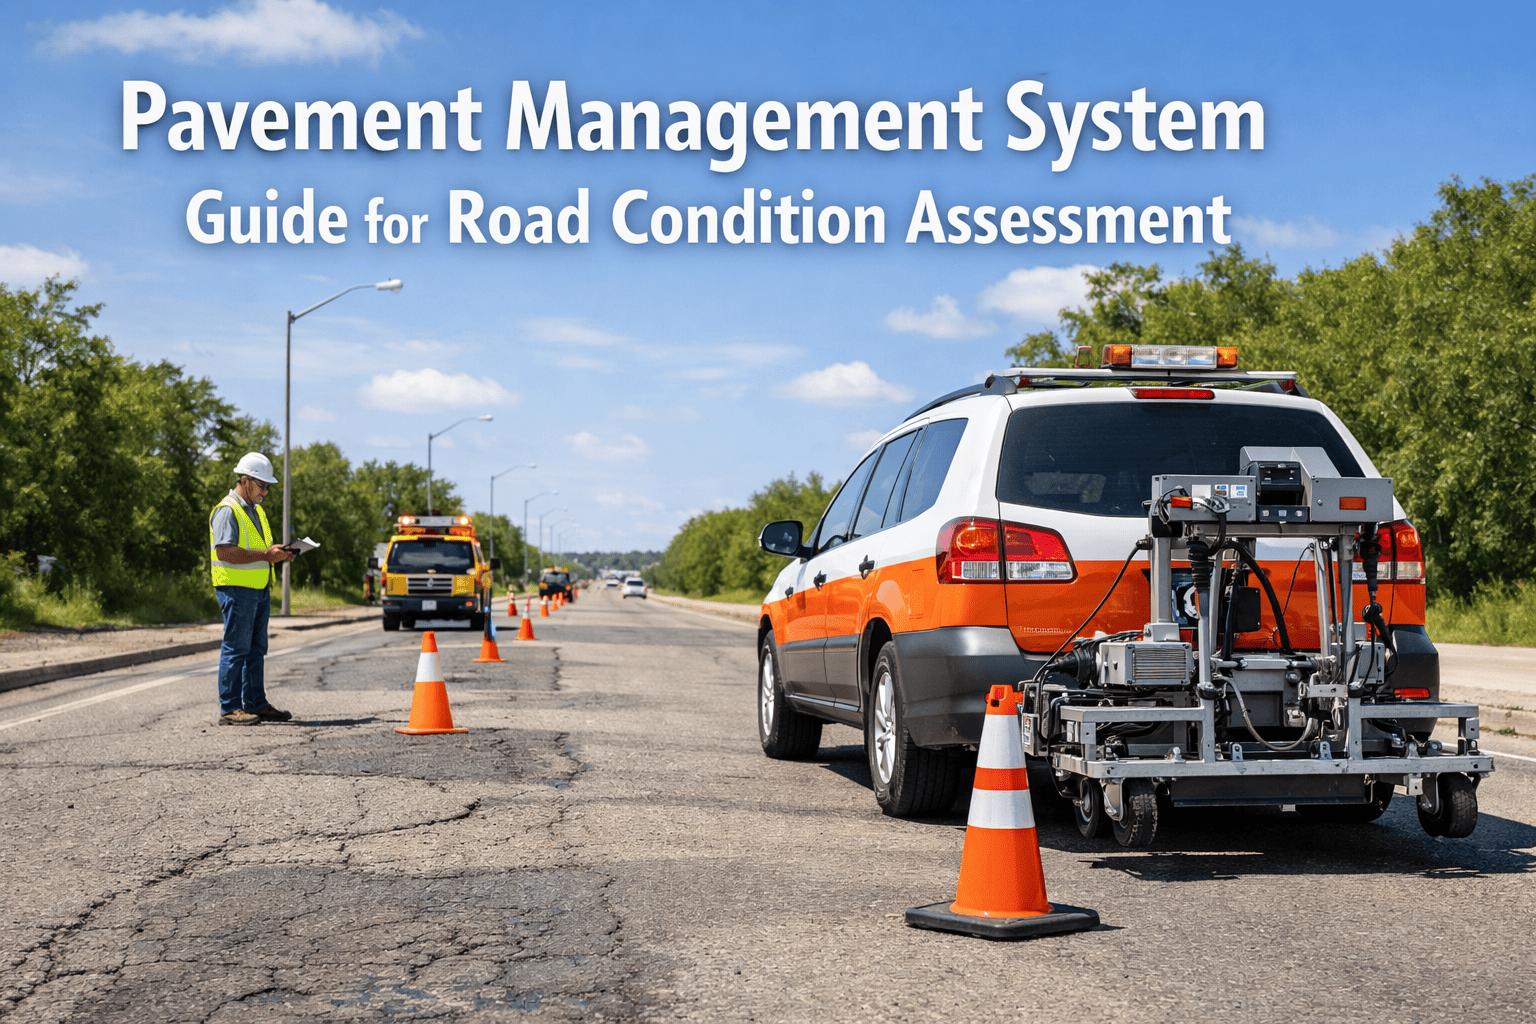
The Challenge: The High Cost of Invisible Wear

Fleet vehicles degrade silently. A small oil leak today becomes a seized engine next month. Without rigorous, documented inspections, these minor symptoms go unnoticed until they cause a roadside failure. For public agencies, this means missed trash pickups, delayed police response, and idle work crews.

The "Pencil-Whipping" Problem
45%
of paper inspection forms were completed without actually checking the vehicle
3 Days
average lag time between identifying a defect on paper and creating a work order
Zero
accountability or proof of inspection (no photos, no timestamps)
Root Causes: Drivers viewed paper forms as bureaucratic hurdles. Forms were often lost or illegible. No feedback loop meant drivers felt their reports were ignored, leading to apathy.
Diagnostic Blind Spots
22%
of "Check Engine" lights ignored until performance degradation occurred
$180K
spent annually on catastrophic repairs that were preventable (blown engines, transmission failures)
No Data
on repetitive failure modes (e.g., specific brake pads wearing out too fast)
Root Causes: Lack of integration between driver observations and mechanic diagnostics. "Noise" from minor issues obscured critical warning signs. No historical data to identify lemon vehicles or bad parts.
Total Operational Impact
Fleet Availability:
82%
Target was 95%
Emergency Repair Spend:
$1.2M
3x higher than planned PM budget

The Solution: Digital Inspection & Predictive CMMS

The agency implemented Oxmaint to digitize the entire inspection workflow. By moving from paper to mobile apps, they closed the gap between detection and repair. See how digital inspections work in a live demo.

1
Mobile DVIR (Driver Vehicle Inspection Report)
What: Drivers use smartphones to complete pre-trip and post-trip inspections.
Features: Mandatory photo uploads for defects. Pass/Fail checklists tailored to vehicle type (heavy truck vs. sedan). GPS geofencing ensures inspection happens at the vehicle.
Outcome: 100% inspection compliance. "Pencil-whipping" eliminated. Defects reported instantly to the shop.
2
Automated Workflows
What: Failed inspection items automatically trigger work orders in the CMMS.
Logic: "Critical" failures (brakes, tires, lights) mark vehicle as "Out of Service" instantly. "Non-critical" (AC, radio) are scheduled for next PM.
Outcome: Eliminated the 3-day lag. Safety issues addressed immediately. Zero unsafe vehicles on the road.
3
Symptom-Based Diagnostics
What: Standardized "symptom codes" for drivers (e.g., "Squealing Brakes," "Hard Shift," "Pulling to Right").
Analysis: CMMS correlates symptoms with historical repair data to suggest root causes to mechanics (e.g., "Squeal + Pull" = Caliper seizing).
Outcome: Reduced diagnostic time by 40%. Fixes addressing root cause, not just symptoms.

Common Causes, Symptoms & Fixes: A Fleet Playbook

By analyzing thousands of inspection reports, the agency identified the top 3 failure modes affecting their fleet reliability. Here is the playbook they developed to address them proactively.

1
Braking System Degradation
Symptom: Drivers reported "soft pedal" or "squealing" but often ignored it until grinding started.
Cause: Uneven pad wear due to seized slide pins (common in road salt areas).
Fix: Added "Wheel Heat Check" to post-trip inspection (hand hover test). Scheduled annual caliper pin lubrication. Result: 50% reduction in brake jobs.
2
Cooling System Failures
Symptom: "Sweet smell" inside cab or minor coolant spots on ground.
Cause: Micro-cracks in plastic radiator tanks and loose hose clamps from thermal cycling.
Fix: Implementing pressure tests during every oil change PM. Switched to silicone hoses for heavy-duty units. Result: Eliminated 12 roadside overheat events/year.
3
Electrical/Battery Drain
Symptom: Slow crank in mornings, dim headlights at idle.
Cause: Parasitic draw from added radios/lights and corroded ground straps.
Fix: Added "Voltage Check" to pre-trip (using dash gauge). Mechanics clean and tighten grounds annually. Result: 70% reduction in jump-start calls.

Results: The ROI of Prevention

Preventive vs. Reactive Ratio:
70/30
Shifted from 30/70 reactive chaos
Annual Parts Savings:
$185K
Due to catching failures early
Labor Efficiency:
+22%
Mechanics spending less time diagnosing
Total First Year Savings
$420,000

Transform Your Fleet Today

Take Control of Your Fleet's Health
Don't wait for the next breakdown. Implement the system that empowers drivers, equips mechanics, and saves taxpayers money. Oxmaint makes digital inspections simple, enforceable, and actionable.
Zero
Paper Forms
100%
Visibility
24/7
Uptime Focus
For Fleet Managers: Get a free fleet health assessment checklist with your demo.

Share This Story, Choose Your Platform!