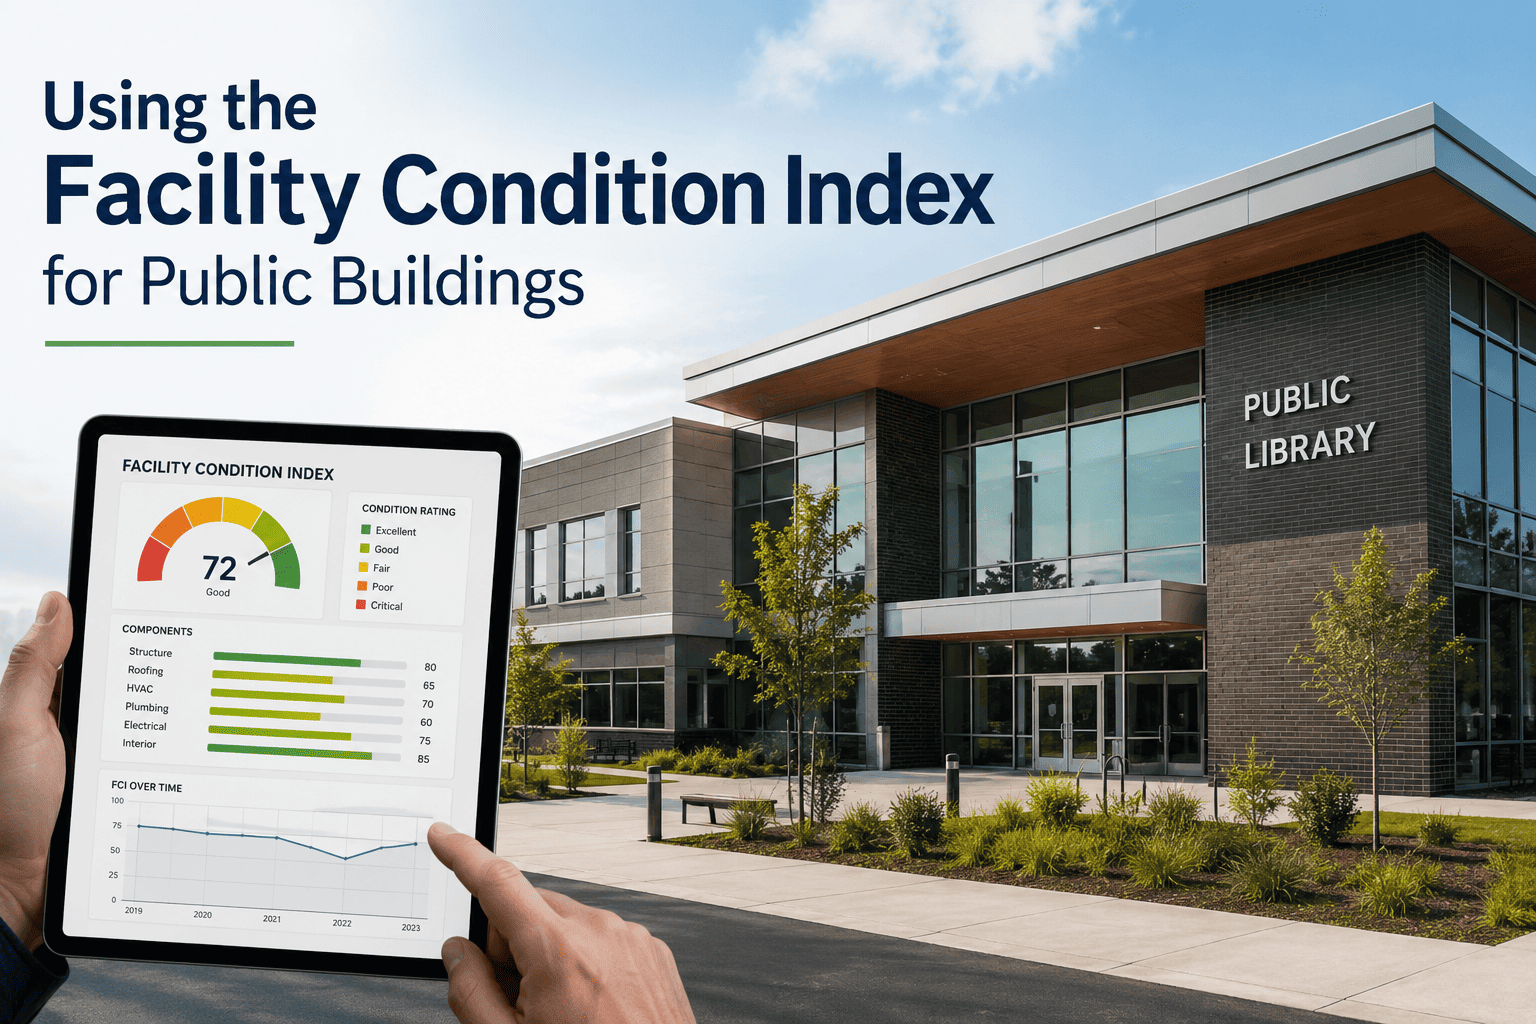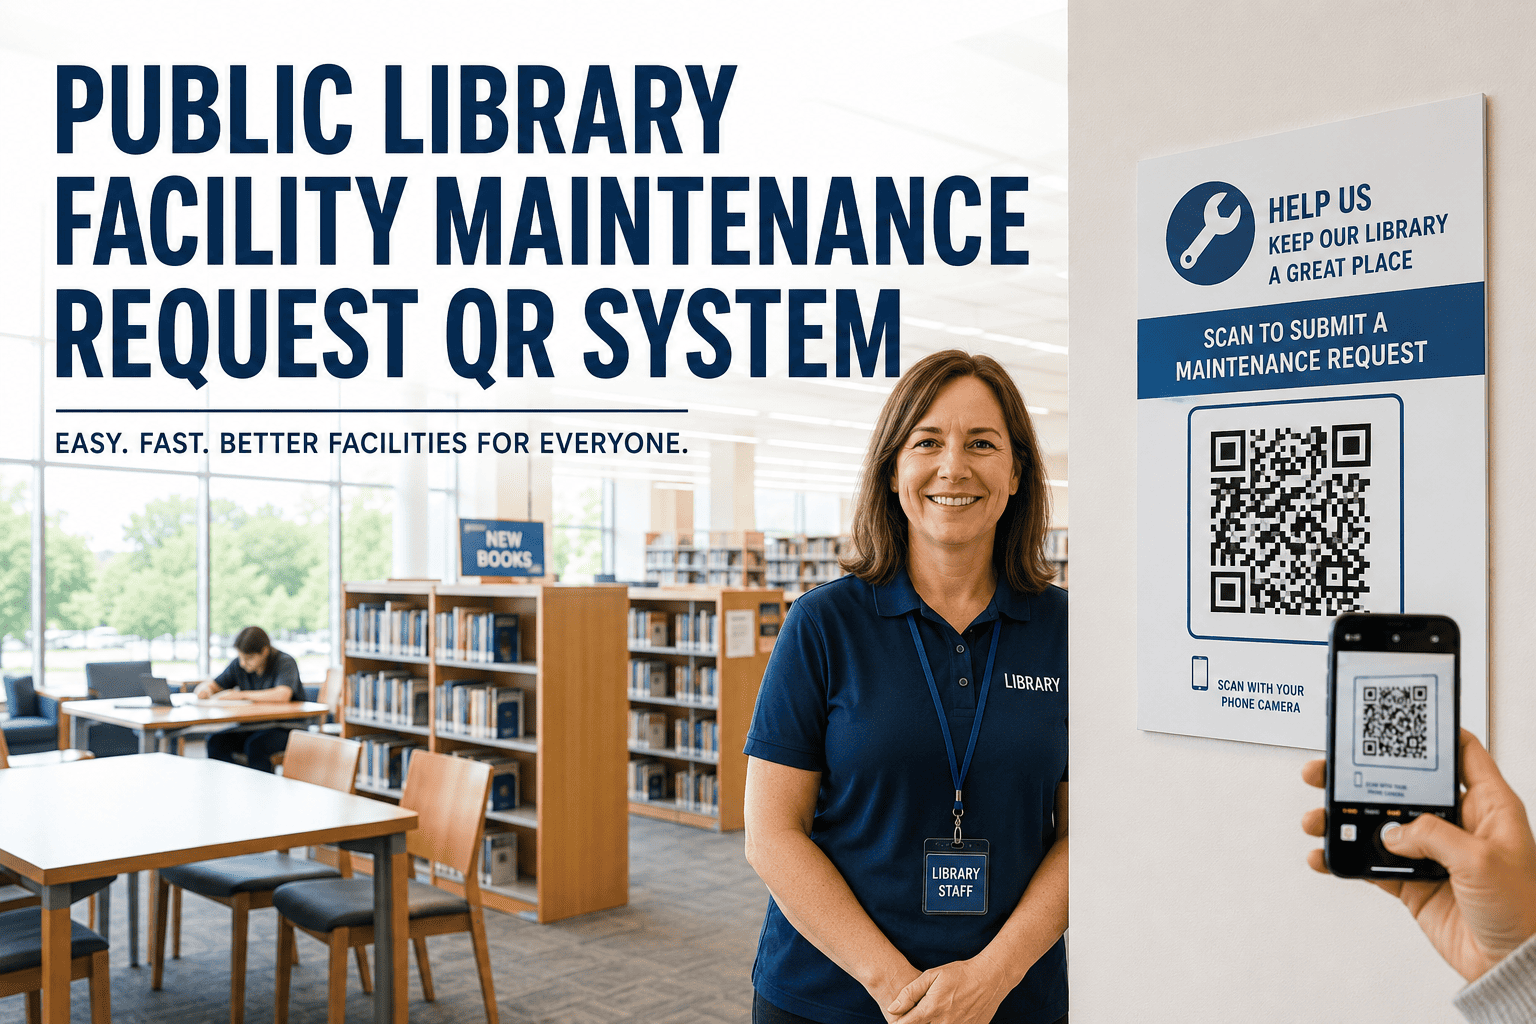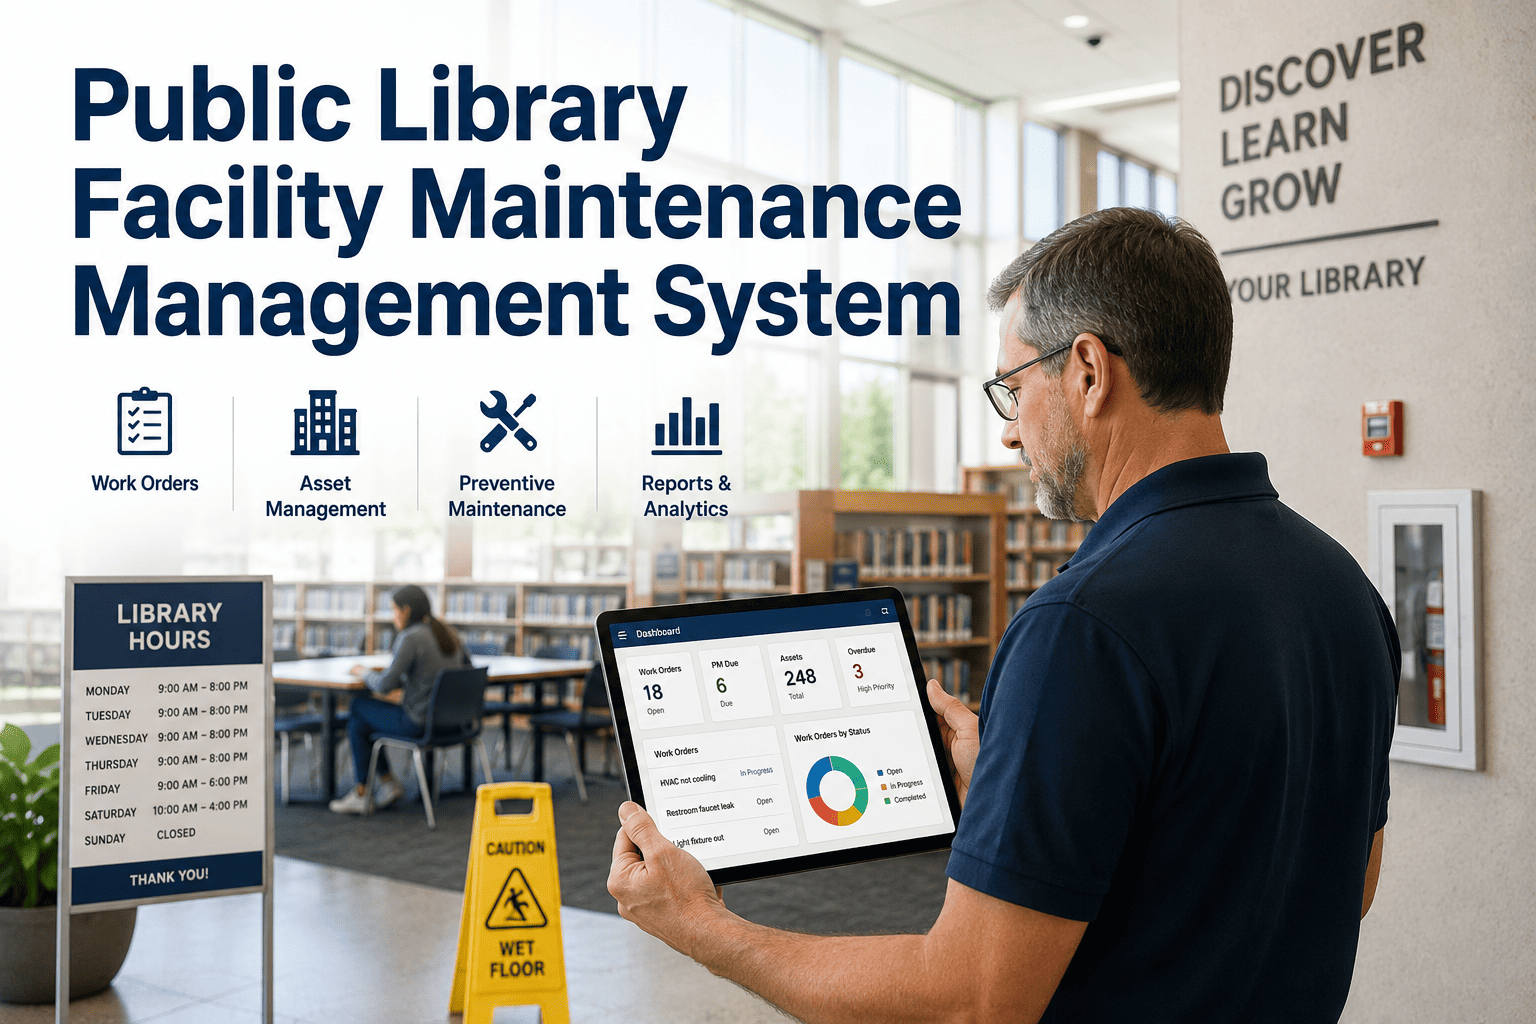
Public libraries and community centers log more than 1.3 billion visits each year in the United States alone, and every one of those visits leaves a maintenance footprint — from tracked-in grit at the entrance to HVAC strain during packed after-school programs. Facility teams responsible for these civic buildings balance high-traffic wear, indoor air quality, ADA accessibility, and digital infrastructure on tightening municipal budgets. A deferred repair in a public building is rarely just cosmetic; it ripples into program cancellations, lower attendance, and community trust erosion. Build a structured library and community center maintenance program with Start Free Trial and keep your doors open, safe, and welcoming.
Can a 40-year-old community center feel safer and run leaner than one built last decade?
When a public building serves 600+ visitors a day, deferred maintenance doesn't just age the asset — it suppresses program attendance, strains HVAC load, and exposes accessibility gaps. A structured facility program turns that around within a single budget cycle.
Public buildings wear faster — and matter more — than comparable commercial space
A branch library typically operates 50–70 hours per week with peak occupant density of one person per 150 sq ft during after-school and weekend windows. That is roughly 2.5× the traffic intensity of Class A office space, and the maintenance program has to match.
A 2019 ASCE infrastructure report graded U.S. public buildings at D+ — and the budget gap has widened since. Maintenance is the lever that closes it without new construction.
Air quality is the single biggest driver of comfort complaints in high-traffic civic buildings
ASHRAE 62.1 sets the ventilation baseline for public assembly spaces, but real-world performance drifts fast when filters load and coils foul. A tiered HVAC maintenance plan is how facility teams hold the line on both IAQ and energy spend.
- Inspect and replace MERV-13 filters when pressure differential exceeds 0.8 in. w.c.
- Walk lobby and program rooms for stale-air or humidity complaints; log CO₂ readings above 1,000 ppm.
- Verify restroom exhaust is pulling at design CFM — the #1 odor and moisture failure point.
- Clean cooling coil and condensate pan; treat drain lines to prevent Legionella-risk stagnation.
- Calibrate space sensors against a reference unit — a 200 ppm CO₂ drift can mask a 20% ventilation shortfall.
- Document supply-air temperature split; flag units outside the 18–22°F delta-T band.
- Run a full duct inspection on high-occupancy zones; seal leaks that drop effective ventilation below 80%.
- Rebalance air handlers serving assembly halls after any program-schedule change.
- Cross-check IAQ sensor data against attendance logs to spot chronic under-ventilation windows.
A 24,000 sq ft branch library in a midwestern municipality logged 38 IAQ complaints in one quarter and ran a $2,100/month energy overrun. After tightening filter changes to a 4-week cadence, rebalancing two air handlers, and sealing three major duct leaks, complaints dropped to 4 the following quarter and energy use fell 18% — a payback of under 11 weeks on the $3,400 labor and materials spend.
Accessibility is a measurable maintenance standard, not a one-time construction checkbox
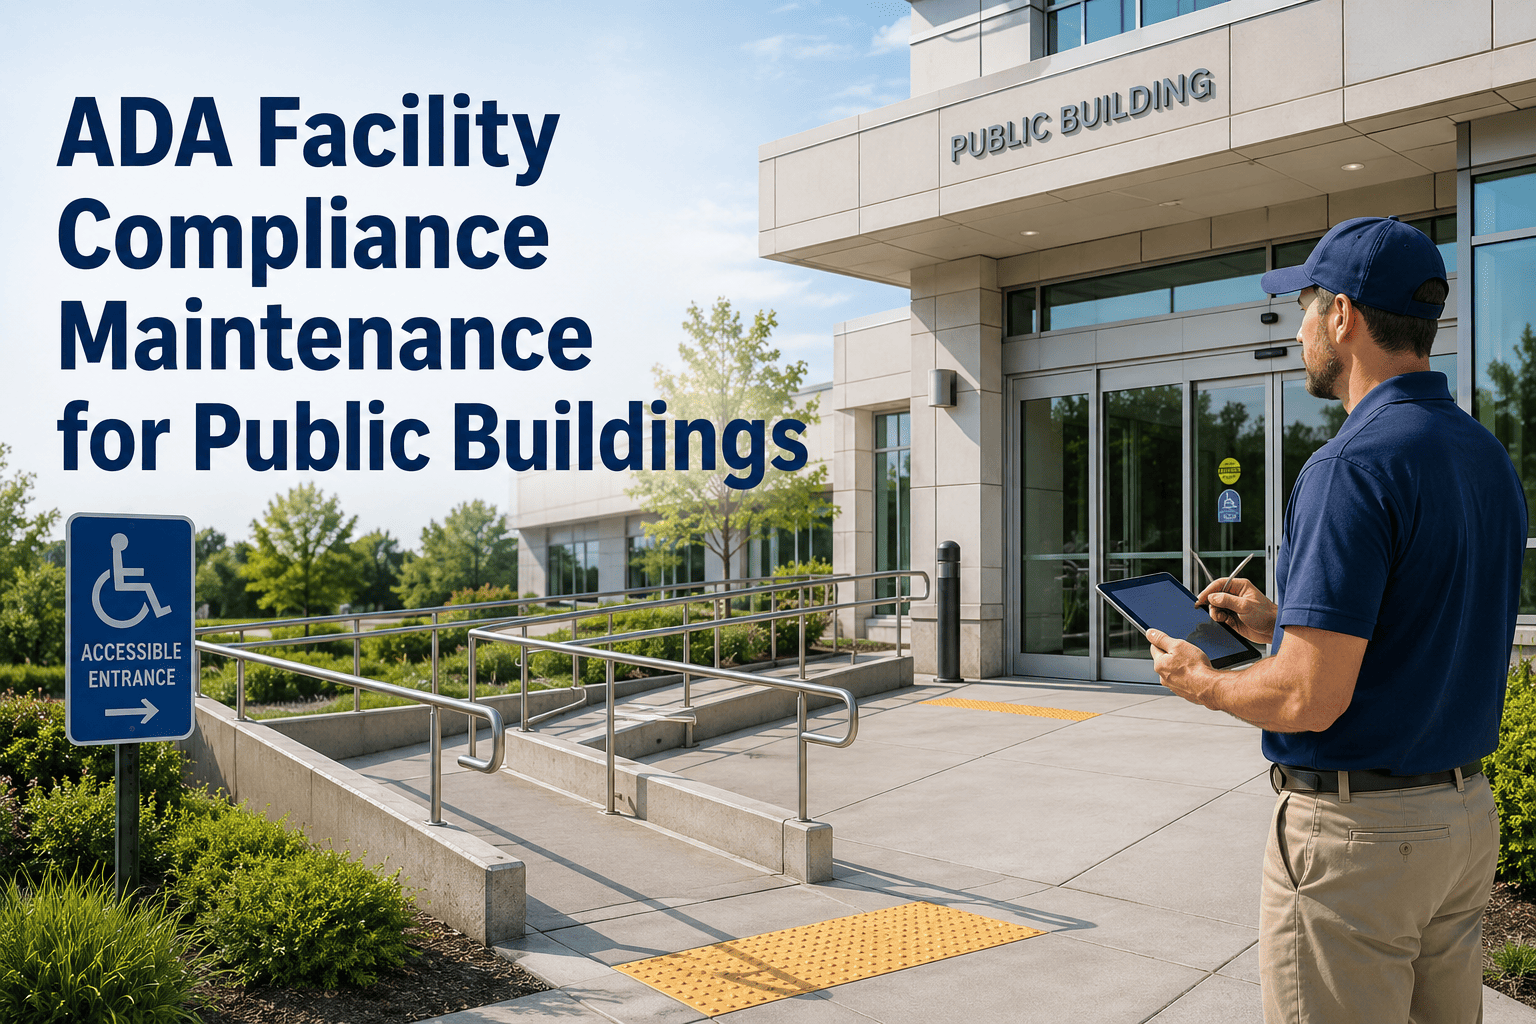
ADA Title II applies to every public library and community center, and the 2010 Standards define exact dimensional requirements. The maintenance team owns the ongoing conditions — door pressures, ramp slopes, path-of-travel clearances — that an audit will actually check.
| ADA Element | Required Threshold | Maintenance Check Cadence | Common Failure Mode |
|---|---|---|---|
| Door opening force (interior) | ≤ 5 lbf | Monthly | Closer drift; warped hardware |
| Accessible route width | ≥ 36 in clear | Weekly | Book carts and event furniture blocking path |
| Ramp running slope | ≤ 1:12 (8.33%) | Quarterly | Settlement, frost heave, surface spalling |
| Restroom grab bar fastening | 250 lbf load | Quarterly | Anchor loosening from masonry |
| Signage tactile + contrast | Grade 2 braille, 70% contrast | Semi-annually | Fading, peeling, replaced-with-non-compliant |
| Reach range (controls, dispensers) | 15–48 in AFF | Monthly | Dispenser refit placed out of range |
A single failed ADA element can trigger a Department of Justice complaint, remediation costs averaging $14,000–$55,000, and mandatory staff training. Structured quarterly inspections catch 90%+ of these failures before a visitor does.
Modern public libraries run as much on connectivity as on collections
Public-access computers, Wi-Fi access points, self-check kiosks, RFID gates, and digital signage all carry maintenance obligations that traditional facility programs underestimate. Downtime on a self-check unit during peak hours can push a 4-minute checkout line to 18 minutes.
Public-Access Stations
Maintain a 48-hour image-restore SLA on all public PCs. Track fan failures, keyboard wear, and USB-port damage as PM work orders — not reactive tickets.
Wireless Infrastructure
AP density should target 60 concurrent clients per radio in reading rooms. Log disconnect spikes as facility data — they often trace to HVAC interference or power-cycle resets.
Self-Check & RFID Gates
Schedule weekly lens cleaning and quarterly RFID tag-read calibration. A 3% misread rate on a 400-item/day branch equals 12 frustrated patrons daily.
Digital Signage & AV
Program-room projectors need quarterly filter cleans and annual lamp-hour audits. Carry one cold-spare lamp per model to eliminate 5-day vendor lead times.
A 12-month plan that matches civic budget cycles and program calendars
Public-building budgets reset on a fiscal calendar, and program attendance follows the school year. Align maintenance waves to both so the building is at peak condition when the community needs it most — summer reading kickoff, back-to-school, winter shelter surge.
Deep winter readiness + post-holiday reset
Boiler combustion analysis, entrance matting replacement, flooring deep-clean after salt and sand season, ADA door-closer audit before spring program ramp.
Summer reading kickoff prep
Cooling-tower disinfection per ASHRAE 188, chiller load test, exterior envelope inspection, parking-lot restriping for accessible stalls before peak visitation.
Peak-traffic stabilization
Bi-weekly filter checks during max occupancy, restroom fixture audit after summer-camp load, technology refresh window for public PCs before fall semester.
Winterization + budget closeout
Weatherstrip and door-seal audit, heating system tune-up, snow-equipment readiness, year-end asset condition assessment to inform next fiscal year's capital request.
What deferred maintenance actually costs a public library or community center
Municipal facility teams face a painful asymmetry: a $400 quarterly PM task, if skipped, becomes a $4,000 emergency repair and a $40,000 premature replacement. Run the math on a real asset profile.
Where the Failure Risk Factor ranges from 3× (cosmetic) to 12× (life-safety / ADA). On average, deferred civic maintenance costs 4–6× the equivalent preventive work.
| Maintenance Task | Annual PM Cost | Deferred Failure Cost | Multiplier |
|---|---|---|---|
| HVAC filter + coil maintenance | $1,200 | $8,400 (compressor + IAQ remediation) | 7.0× |
| ADA door-closer calibration | $280 | $3,100 (hardware replacement + complaint response) | 11.1× |
| Roof gutter + drainage clearing | $650 | $9,200 (interior ceiling + carpet replacement) | 14.2× |
| Restroom fixture preventive rebuild | $890 | $5,600 (emergency plumbing + water damage) | 6.3× |
| Public PC image restore + hardware clean | $420 | $1,850 (drive failure + staff downtime) | 4.4× |
"We cut emergency work orders by 61% in two quarters after moving to a structured PM calendar. The library director stopped calling me about the meeting room AC — and that's how I know it's working."
"Quarterly ADA audits caught four door-pressure failures before our state review. The $1,100 in labor saved us from a formal complaint that would have cost $30K-plus in remediation."
Stop running your civic building on reactive tickets
Set up a full library and community center maintenance program in under a day — PM calendars, ADA audit templates, asset registry, and work-order tracking built for public facilities.
Library and community center maintenance, answered
How often should a public library schedule HVAC filter changes?
For MERV-13 filters in a high-traffic branch, inspect weekly and replace every 4–6 weeks during peak seasons (summer reading, winter shelter) and every 8–10 weeks during lighter periods. Track pressure differential across the filter bank — when it exceeds 0.8 in. w.c., replace regardless of schedule. This single discipline typically cuts IAQ complaints by 40–60%.
What does an ADA compliance audit cost for a community center?
A professional ADA Title II audit ranges from $2,500 for a small single-story center to $12,000 for a multi-wing facility. The cost of skipping one is far higher — DOJ remediation settlements average $14,000–$55,000 per case, plus mandatory training. A Book a Demo walk-through shows how a quarterly self-audit template catches 90% of failures internally.
Can a CMMS really help a small municipal library with one facilities person?
Yes — single-person teams benefit most because the system becomes their institutional memory. A lightweight CMMS with templated PM schedules, asset history, and mobile work orders turns a reactive handyman role into a managed facility program. Most solo operators recover 6–8 hours per week previously lost to chasing parts and recalling service history.
What is the ideal preventive-to-reactive work-order ratio for a public building?
Industry benchmarks for well-run public facilities target a 70:30 preventive-to-reactive split. Most under-resourced civic buildings operate inverted at 30:70. Closing that gap typically reduces emergency repair spend by 35–50% within two quarters and extends major asset life by 4–7 years. Start your shift with a Start Free Trial to baseline your current ratio.
How do I justify a maintenance software budget line to my city council?
Frame it as a deferral-prevention investment, not an expense. A typical mid-sized library system carries $180K–$400K in deferred maintenance. A $4,800/year CMMS subscription that prevents even 5% of that annual growth pays for itself 2–4× over. Pair the cost figure with attendance data — buildings in good repair see 15–30% higher program participation, which is the metric councils actually care about.
Build the maintenance program your community deserves
Join municipal facility teams using OxMaint to run PM calendars, ADA audits, asset registries, and work-order tracking — all in one platform built for public buildings.
Free 14-day trial · No credit card