Every public building an agency owns is quietly aging, and most asset managers are stuck making capital decisions from outdated inspection notes, gut instinct, or a spreadsheet nobody has opened since the last audit. The Facility Condition Index turns that guesswork into a single, defensible number: the ratio of what it would cost to fix a building against what it would cost to replace it entirely. City councils, county boards, and state facility committees increasingly expect this number before approving a single capital dollar, and agencies that show up without it get rejected far more often than the ones that do. This guide breaks down how the facility condition index is calculated, what the resulting score means for a public building portfolio, and how asset managers turn that score into a funded capital plan using Oxmaint.
Asset Management · Capital Planning
The Number Behind Every Approved Public Building Budget
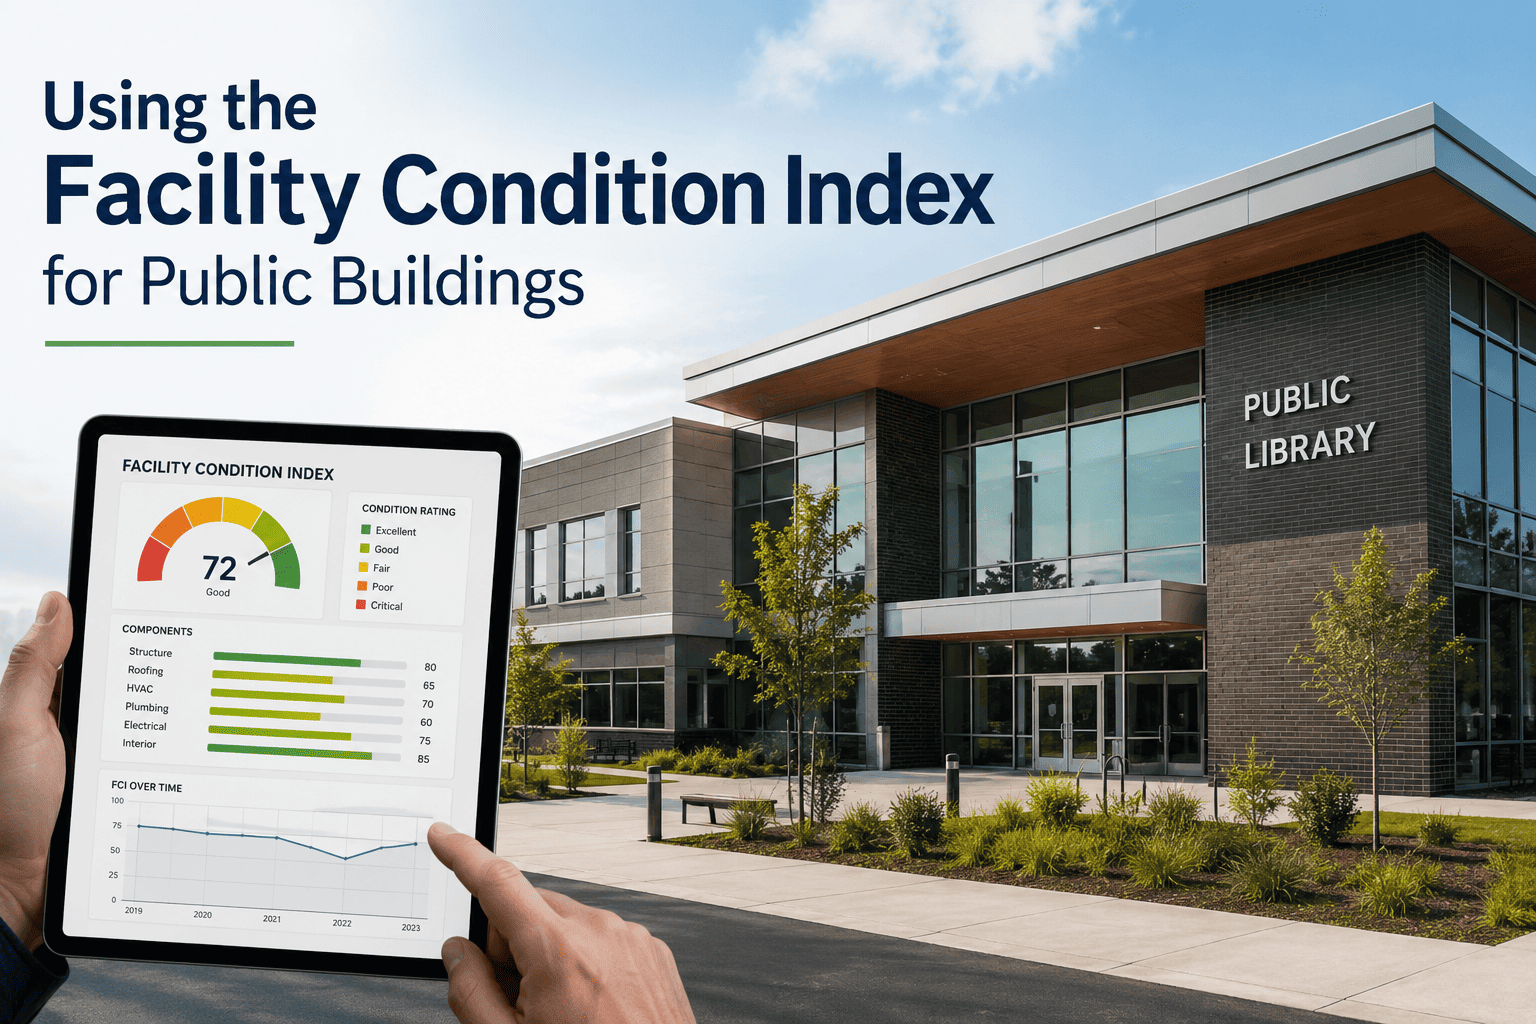
FCI takes the condition of a building — its roof, its HVAC, its electrical systems, its code compliance gaps — and expresses it as one percentage that a finance committee can actually act on.
Where does your portfolio sit on the FCI scale?
0–5%
5–10%
10–30%
30–60%
60%+
Excellent
Good
Fair
Needs Attention
Replace
$1T+
Deferred maintenance sitting across US public and commercial buildings today
88%
Capital request approval rate when FCI scores back the ask, versus 47% for estimate-only submissions
7%
Yearly compounding rate that turns a $100K repair into a $600K reconstruction if deferred too long
How the Facility Condition Index Is Actually Calculated
FCI is not a subjective condition rating — it is a straightforward financial ratio that any asset manager can defend line by line in front of a budget committee. It compares what a building currently needs against what a building is currently worth, which is exactly why it translates so cleanly into a capital planning document.
Stop Calculating FCI From a Spreadsheet That Goes Stale in a Month
Oxmaint connects every work order, inspection, and asset record to a live FCI score for each building in your portfolio — so the number in your capital request is always current, not last year's estimate.
What Your Score Is Actually Telling You
A single FCI number carries a lot of information once you know how to read it. Most public agencies use a five-tier scale, and where a building lands determines whether it gets a maintenance work order, a capital renovation line item, or a replacement recommendation.
0% – 5%
Excellent
Routine preventive maintenance only. No deferred backlog worth reporting to leadership.
5% – 10%
Good
Minor deferred items. Fund through the normal maintenance budget cycle, no escalation needed.
10% – 30%
Fair
Backlog is building. This is the range where a capital improvement request typically gets drafted.
30% – 60%
Needs Attention
Significant systems are failing or near end of life. Expect safety and compliance exposure.
60%+
Replace
Continued repair investment is no longer cost effective compared to full replacement.
Why Asset Managers Lean on FCI, Not Just Inspection Notes
Every public asset manager has sat in a budget hearing trying to explain, in plain language, why one roof matters more than another. FCI removes that argument entirely by putting every building on the same scale.
Without an FCI Program
Capital requests rely on visual estimates and staff memory of past repairs
Buildings compete for funding based on who complained loudest, not actual risk
Council and board members routinely ask for data the agency cannot produce quickly
Deferred items compound quietly until a system fails without warning
With a Live FCI Program
Every building is scored on the same ratio, ranked, and comparable instantly
Capital plans prioritize by actual condition and replacement cost, not complaints
Budget hearings are backed by a report generated in minutes, not weeks
Trending FCI year over year proves whether the portfolio is improving or decaying
One Score Can Hide the Real Problem
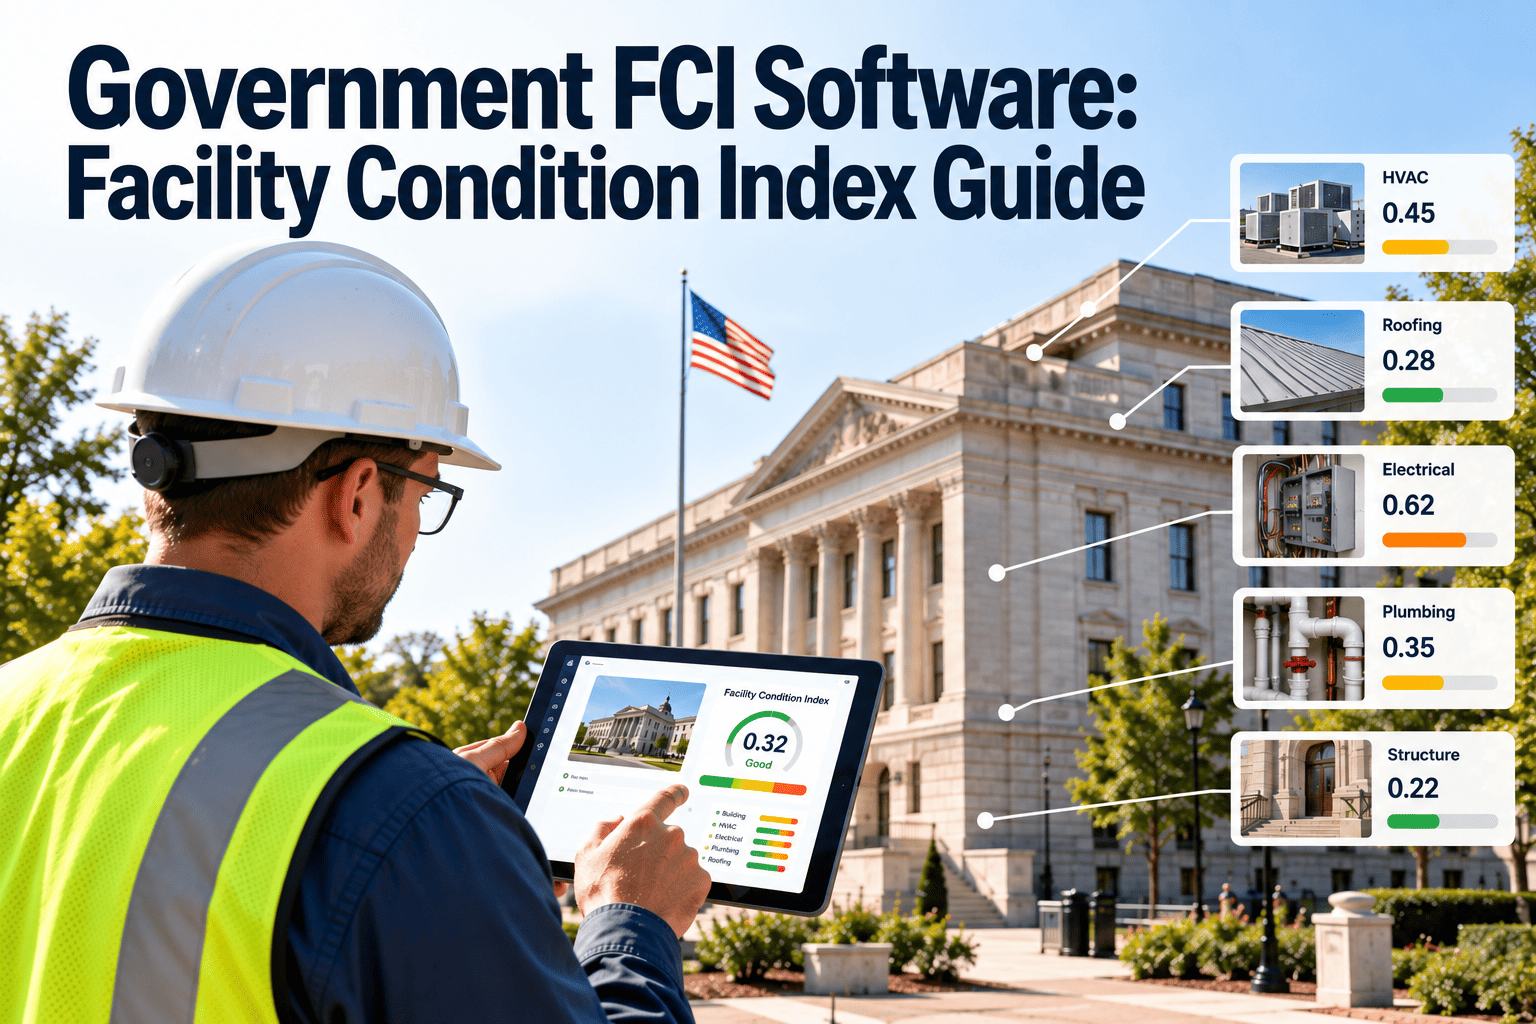
A building-level FCI of 12% sounds manageable — until you find out the HVAC system alone is sitting at 34%. Public agencies get the most value from FCI when it is tracked at the system level, not just the building level, so capital dollars go exactly where they are needed.
| Building System |
Typical Weight in CRV |
Common Failure Driving High FCI |
| Roofing and Envelope |
High |
Membrane past service life, water intrusion, insulation failure |
| HVAC |
High |
Original equipment beyond rated life, failing controls, poor efficiency |
| Electrical |
Medium |
Outdated panels, code compliance gaps, insufficient capacity |
| Plumbing |
Medium |
Aging supply lines, fixture failures, water pressure issues |
| Life Safety |
Medium |
Fire suppression and alarm systems out of compliance |
| Structural |
Low, but critical |
Foundation settling, seismic gaps, load-bearing deterioration |
AM
Municipal Asset Manager
Public Buildings and Facilities, 14 Years
The moment FCI changed my job was the first time I walked into a council meeting with a one-page ranking of every building we owned, sorted by condition and cost. Nobody argued with the number. Before that, every request was a negotiation. Now it is a review. The agencies that struggle are the ones still calculating this once every few years by hand — by the time the report is finished, three of the buildings on it have already gotten worse.
Turning a Score Into a Funded Capital Plan
Calculating FCI is only half the job. The agencies that consistently win capital funding treat it as a live process tied directly to daily maintenance work, not a report produced once and filed away.
1
Baseline the Portfolio
Build a complete asset inventory with current replacement value for every building and major system.
2
Automate the Score
Connect inspections and work orders directly to deferred maintenance so FCI recalculates on its own.
3
Prioritize by Risk
Rank buildings and systems by FCI trend, not just current score, to catch fast-decaying assets early.
4
Submit With Evidence
Attach FCI trending and cost history directly to the capital improvement plan going to the board.
Turn Your Building Portfolio Into a Data-Backed Capital Plan
See how Oxmaint calculates building-level and system-level FCI automatically from your existing work orders and inspections, and generates the report your next budget hearing needs.
Frequently Asked Questions
How is the Facility Condition Index calculated for a public building?
FCI is calculated by dividing total deferred maintenance cost by the current replacement value of the building, expressed as a percentage. Oxmaint pulls both figures directly from asset records and closed work orders, so the score updates automatically instead of waiting on a manual survey.
See how automated scoring works.
What FCI score should trigger a replacement request instead of another repair?
Most public agencies treat 30% as the point where repair investment starts losing cost-effectiveness, with 60% and above widely considered a replacement-only range. Mission-critical facilities like fire stations or clinics often set tighter internal thresholds.
Talk to our team about setting thresholds for your portfolio.
Should every building system have its own FCI, or just one score per building?
A single blended score can hide a system that is failing badly inside an otherwise healthy building. System-level FCI for HVAC, roofing, electrical, and life safety shows exactly where capital dollars should go rather than spreading funding across general improvements.
How often should a public agency recalculate FCI scores?
Static assessments every three to five years are the industry norm, but they go stale fast in an aging portfolio. Agencies using Oxmaint recalculate continuously because every closed work order and inspection updates the deferred maintenance figure automatically.
Start tracking FCI continuously.
How does Oxmaint help justify capital budget requests to a city council or board?
Oxmaint generates building-level and system-level FCI trends, deferred maintenance cost history, and reliability data that turn a subjective repair-versus-replace judgment into a documented, defensible capital request.
Book a demo to see a sample capital report.
Your Next Capital Budget Hearing Deserves a Real Number
Oxmaint gives public asset managers a live, automated Facility Condition Index for every building in the portfolio — so every request to council or the board starts from evidence, not estimates.