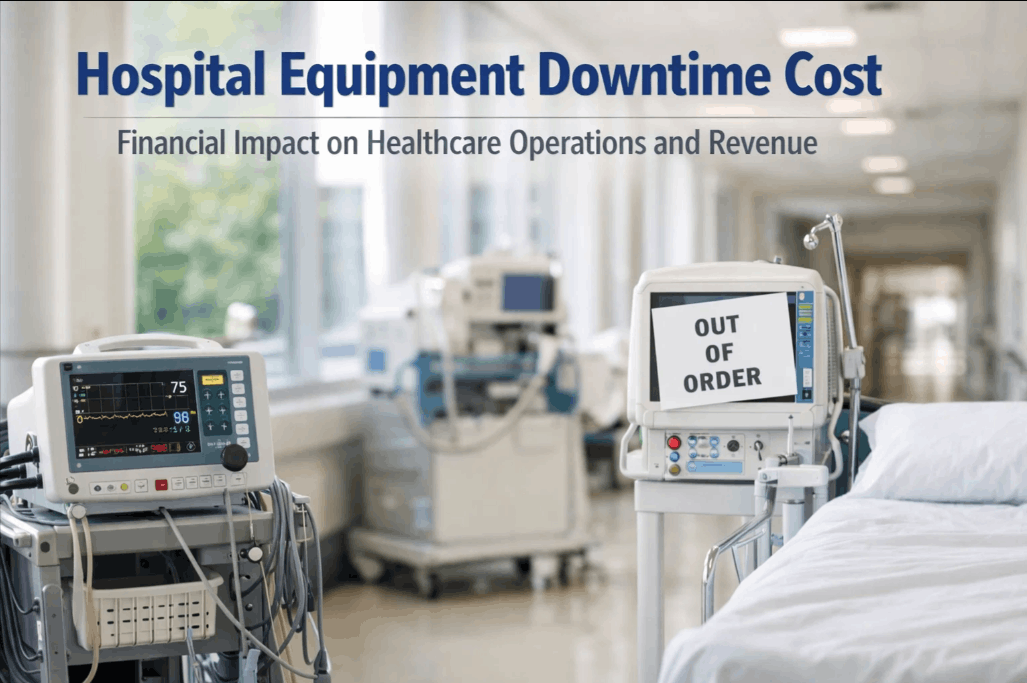
Hospital equipment downtime is not just an operational inconvenience — it is a direct revenue drain, a clinical risk, and a compliance exposure. When an MRI suite goes dark or an ICU ventilator fails, the financial consequences cascade across departments, insurers, and patient outcomes. This breakdown gives healthcare facility directors and operations leaders the numbers they need to make the case for proactive maintenance investment. Want to see how leading hospitals are tackling this — start a free trial for 30 days and book a demo to see the platform in action.
$8,662
Average revenue lost per MRI downtime hour
4.8x
Emergency repairs cost more than planned maintenance
$1.5M+
Annual unplanned downtime cost for a mid-size hospital
36%
Of equipment failures are preventable with scheduled maintenance
What Is Hospital Equipment Downtime — and Why Does It Cost So Much?
Hospital equipment downtime refers to any period when critical clinical or facility equipment is unavailable for use due to failure, unplanned maintenance, or extended repair cycles. Unlike manufacturing, where downtime means lost units, hospital downtime means delayed diagnoses, deferred procedures, diverted patients, and in extreme cases, clinical harm. The financial exposure is compounded because hospitals operate on fixed staffing costs — a surgeon, technician, and nursing team standing idle during a broken imaging suite still draws full salaries. Want to understand what this means for your facility — start a free trial and see how Oxmaint maps your asset risk, or book a demo with our healthcare team.
The Four Key Cost Layers of Equipment Downtime
Direct Revenue Loss
Cancelled procedures, diverted patients, idle billable capacity
Operational Expense Surge
Emergency vendor callouts, overtime, expedited parts procurement
Regulatory and Compliance Risk
Joint Commission citations, CMS penalties, accreditation flags
Reputational Damage
Patient dissatisfaction, referral physician attrition, market share erosion
Revenue Loss by Equipment Type: The Numbers by Category
Not all downtime is equal. High-utilization imaging and life-support equipment carry exponentially higher per-hour costs than general facility systems. These figures represent combined revenue loss and repair cost averages reported across US hospital networks.
MRI Scanner
$8,662/hr
6-8 scans per hour at $1,000–$1,500 average reimbursement. Downtime often extends 4–12 hours per incident.
Highest risk department
CT Scanner
$4,200/hr
12–18 scans per hour at $300–$500 average reimbursement. ER throughput impact compounds losses.
Emergency dependency
Surgical Robot
$6,100/hr
OR scheduling disruption cascades across entire surgical calendar. Average downtime incident: 6+ hours.
Cascading OR impact
ICU Ventilator
$3,800/hr
Includes patient diversion costs, liability exposure, and emergency equipment rental if backup units unavailable.
Life-safety critical
Linear Accelerator
$5,500/hr
Oncology treatment delays have clinical consequences beyond revenue. Patients may divert to competing facilities permanently.
Patient retention risk
Lab Analyzers
$1,900/hr
Diagnostic bottlenecks delay discharge decisions and bed turnover, multiplying downstream revenue impact across the hospital.
Throughput bottleneck
Cath Lab System
$7,300/hr
Cardiac intervention delays carry both revenue and mortality implications. STEMI diversion is a regulatory and liability event.
Cardiac emergency risk
HVAC / Sterile Systems
$2,400/hr
OR and sterile processing shutdowns ripple through surgical scheduling. Infection control failures trigger Joint Commission reviews.
Compliance exposure
The Hidden Costs Facilities Managers Consistently Underestimate
Most downtime cost analyses stop at lost procedure revenue. The real financial exposure extends well beyond the invoice from the repair vendor. Understanding the full cost picture is the first step toward building a business case for proactive maintenance investment. If you are ready to quantify this for your facility, start a free trial or book a demo and we will walk through the cost model with your data.
Idle Staff Wages
Clinical Teams on Standby
A 4-person OR team averaging $85/hr each costs $340/hr in labor alone during an equipment outage — before you factor in overtime premium to make up the backlog.
Emergency Procurement
Unplanned Parts at Premium Price
Emergency parts procurement costs 60–80% more than scheduled orders. Expedited shipping on specialized medical components can reach $2,000–$5,000 per incident.
Vendor Callout Fees
After-Hours Service Surcharges
OEM service contracts do not always cover emergency response. After-hours engineer callouts for imaging equipment routinely cost $1,500–$4,000 before parts.
Patient Diversion
Lost Patients Rarely Return
A diverted patient generates an average lifetime value of $180,000 in future procedures. Studies show 40% of diverted patients do not return to the original facility.
Regulatory Penalties
Compliance Failures Are Expensive
Joint Commission citations related to equipment maintenance can trigger focused surveys, corrective action plans, and in severe cases, CMS payment withholds reaching six figures.
Accelerated Asset Degradation
Reactive Cycles Shorten Asset Life
Equipment operated beyond PM intervals degrades 22% faster on average, pulling forward CapEx replacement by 3–5 years and inflating budget projections.
Staff Overtime and Burnout
Backlog Recovery Costs Add Up
Rescheduling backlogs after equipment failure require 1.4x–1.8x staff hours to clear. Sustained reactive patterns correlate with 18% higher technician turnover.
Contract and SLA Violations
Payor and Referral Agreements at Risk
Hospitals with documented equipment reliability issues report 12–19% higher difficulty in negotiating favorable payor contracts and referral agreements with specialist groups.
Reactive vs. Preventive: The Financial Reality Side by Side
The debate between reactive and preventive maintenance in healthcare is settled by the data. Every dollar invested in preventive maintenance returns between $3 and $5 in avoided emergency repair costs, extended asset life, and reduced downtime losses.
How Oxmaint Reduces Hospital Equipment Downtime
Oxmaint gives healthcare facility teams the operational infrastructure to shift from firefighting to proactive asset management. The platform is built around asset condition, not just work orders — which means you get real early warning before failures occur, not a record of what already went wrong. Ready to move from reactive to preventive? Start a free trial for 30 days with no implementation fees, or book a demo to see the healthcare workflow live.
Asset Intelligence
Full Equipment Registry with Condition Scoring
Every medical device, imaging system, and facility asset gets a real-time condition score. Flag degradation before it becomes failure. No more guessing which assets are at risk.
PM Scheduling
Preventive Maintenance Tied to Asset Records
PM schedules are created directly from asset data — triggered by runtime hours, cycles, or calendar intervals. Missed PMs auto-escalate. Nothing falls through the gaps.
Work Orders
Full Technician History and Accountability
Every work order logs technician, time, parts used, and resolution notes. Joint Commission-ready documentation is generated automatically with digital signatures and timestamps.
CapEx Forecasting
5–10 Year Equipment Replacement Models
Asset condition scores drive rolling CapEx forecasts. Stop reacting to surprise replacements. CFOs and directors get multi-year capital planning data grounded in real asset health.
IoT and SCADA
Real-Time Equipment Monitoring Integration
Connect clinical equipment sensors and building management systems to trigger maintenance alerts before threshold breaches become failures. Average early warning: 48–72 hours.
Compliance
Audit-Ready Documentation at All Times
GMP-compliant digital inspections, digital signatures, and complete maintenance records mean your facility is survey-ready on any given day — not just when an audit is announced.
Multi-Site
Portfolio-Level Reporting for Health Systems
Health systems managing 3, 10, or 30+ facilities get a single dashboard view across all properties. Compare asset performance, downtime rates, and PM compliance by site.
Mobile First
Field Execution Without the Paper Trail
Technicians receive, complete, and close work orders on mobile — including photo documentation, checklists, and parts usage. No paper, no data entry lag, no lost records.
ROI and Performance Benchmarks
Healthcare facilities using a structured preventive maintenance platform consistently report measurable improvements within the first 6–12 months. These are representative outcomes from facilities that shifted from reactive to condition-based asset management.
34%
Reduction in unplanned equipment failures
Reported within 12 months of PM program implementation
$420K
Average annual downtime cost savings per facility
Combined revenue recovery and avoided emergency repair spend
3.2x
ROI on preventive maintenance investment
Industry average across acute care hospital facilities
27%
Longer average asset lifespan with condition-based PM
Delays CapEx replacement cycles by 3–5 years on average
See What Downtime Is Costing Your Facility Right Now
Oxmaint helps healthcare operations teams quantify their equipment downtime exposure, build a preventive maintenance program, and generate CapEx forecasts that hold up in board-level conversations. No heavy implementation. No long onboarding. Results in weeks, not months.
Frequently Asked Questions
How much does MRI downtime cost a hospital per day?
A fully-utilized MRI suite running 10 hours per day generates approximately $86,620 in daily revenue at average reimbursement rates. A single full-day outage — factoring in emergency repair costs, idle staff wages, and rescheduling overhead — typically totals $95,000 to $130,000 in combined financial impact. MRI downtime incidents averaging 6–8 hours per occurrence cost most radiology departments $50,000–$75,000 per event. Over a year, even two or three unplanned MRI failures can represent a material operating budget variance.
What equipment failures are most common in hospitals and how can they be prevented?
The most frequent failure categories in hospital environments are imaging systems (MRI, CT, fluoroscopy), HVAC and air handling in sterile zones, electrical distribution and UPS systems, and laboratory analyzers. Studies show 36% of these failures are preventable with structured preventive maintenance schedules tied to manufacturer-recommended intervals and runtime hours. The remaining 64% are significantly reduced in severity and duration when condition-based monitoring provides early warning — converting major failure events into minor corrective interventions.
How does hospital equipment downtime affect Joint Commission accreditation?
The Joint Commission's Environment of Care and Life Safety standards require documented evidence of scheduled maintenance for medical equipment and building systems. Facilities with gaps in PM documentation, incomplete work order records, or evidence of deferred maintenance face findings during surveys. A pattern of reactive maintenance without structured PM programs can trigger focused follow-up surveys and corrective action requirements. In severe cases, accreditation status can be conditionally maintained or withdrawn, which directly affects CMS reimbursement eligibility. Digital maintenance records that are audit-ready at all times are the safest posture.
What is the ROI timeline for implementing preventive maintenance software in a hospital?
Most healthcare facilities see measurable ROI within 6 to 12 months of implementing a structured preventive maintenance platform. The fastest gains come from eliminating emergency repair premium costs and reducing unplanned downtime events — typically a 25–35% reduction in the first year. Full ROI including extended asset lifespan, deferred CapEx replacement, and compliance cost avoidance usually yields a 3x to 5x return on platform investment within 24 months. Facilities with high-value imaging equipment or large multi-site portfolios typically reach breakeven faster due to the higher revenue-per-hour exposure.
Stop Letting Equipment Failures Drain Your Operating Budget
Oxmaint gives hospital facility and operations teams the tools to move from reactive to predictive — with full asset condition tracking, automated PM scheduling, compliance-ready documentation, and CapEx forecasting built in. No heavy implementation. No specialist consultants. Operational in weeks.
Full medical equipment asset registry
Preventive maintenance automation
Joint Commission-ready audit documentation
5–10 year CapEx forecasting from asset data
![]-(1)](./manage-post-2k26/uploads/]-(1).jpg)



-(1).jpg)