U.S. hospitals lose an average of $7.5 million a year to inadequate equipment maintenance — and 68% of that cost never shows up as a line item anyone can point to. It hides inside overtime pay, rescheduled procedures, premium emergency parts, and contracts nobody has reviewed in three years. By the time finance notices the budget is off, the leak has been running for months. Start a free OxMaint trial and see exactly where your maintenance spend is leaking before the next budget review catches you off guard.
Hospital Finance · Maintenance Cost Analysis · Budget Visibility
68% of Maintenance Cost Leakage Never Shows Up in the Budget
OxMaint surfaces the maintenance spend that traditionally hides in overtime, emergency premiums, and unreviewed vendor contracts — so finance sees the real number, not the visible fraction of it.
$7.5Maverage annual hidden cost from inadequate equipment maintenance, per hospital
68%of that cost stays invisible to standard hospital budgets
18–28%emergency repair spend reduction once PM compliance passes 85%
Where the Leaks Actually Are
Four Places Maintenance Dollars Disappear Without a Trace
Direct repair costs are easy to track. The real leakage happens in the costs that ripple outward from every equipment failure — costs that rarely get coded back to maintenance in the general ledger.
01
Overtime & Rescheduling
Staff overtime to manage failures and the administrative cost of rescheduling canceled procedures rarely get tagged back to the maintenance budget.
02
Emergency Premiums
Failure-driven repairs cost 15–20% more than planned work, and emergency capital replacements carry their own steep markup on top.
03
Stale Vendor Contracts
Multi-year service contracts run on autopilot for years, with rate increases and underperformance going unnoticed until someone finally audits them.
04
Shortened Asset Lifespan
Deferred maintenance accelerates equipment failure, and every dollar saved by delaying a repair adds roughly four dollars to future capital renewal costs.
The Cost Cascade
How One Deferred Repair Becomes a Six-Figure Problem
Step 1A scheduled PM task gets deferred to save this quarter's budget
Step 2The deferred asset fails unexpectedly, triggering an emergency repair at 15–20% premium
Step 3Procedures get rescheduled, generating overtime and administrative coordination costs
Step 4The asset's shortened lifespan pulls a capital replacement forward by years, ahead of budget
Find Out What Your Hospital Is Actually Leaking
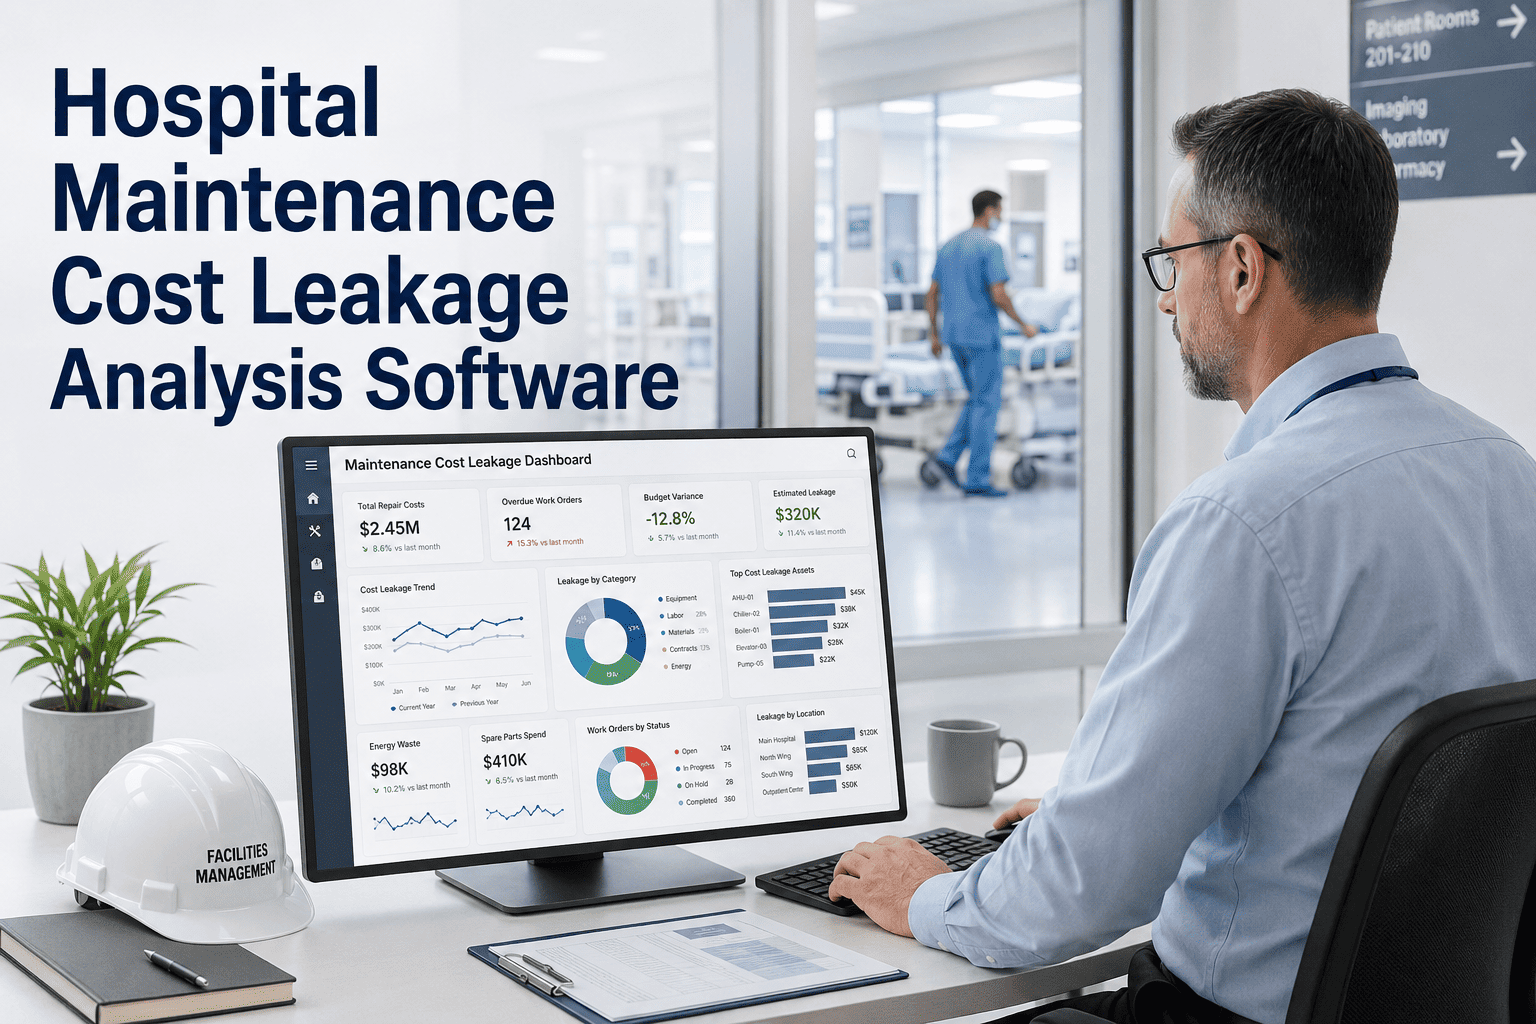
OxMaint's cost dashboard breaks down spend by department, asset class, and vendor — surfacing leakage finance has never been able to see clearly.
Before vs. After Cost Visibility
What Changes Once Leakage Becomes Trackable
| Cost Driver |
Without Cost Analytics |
With OxMaint Cost Dashboard |
| Reactive vs. planned ratio |
Untracked, assumed acceptable |
Trended live by department and asset class |
| PM compliance rate |
Estimated, often overstated |
Measured automatically from field completions |
| Vendor performance |
Reviewed rarely, if ever |
Scorecard updated automatically from work orders |
| Leadership reporting |
Manually assembled monthly or quarterly |
Automated weekly summary, no manual prep |
| Emergency repair spend |
Trending upward unnoticed |
Reduced 18–28% once PM compliance improves |
Expert Review
What Finance and Facilities Should Audit First
CF
Healthcare Facilities Cost Optimization Advisory Panel
Start by pulling the reactive-to-planned work order ratio for the last twelve months — it's the single clearest signal of where leakage is concentrated. Facilities consistently above a roughly even split between reactive and planned work are paying the emergency premium repeatedly without realizing it. Pair that number with a vendor contract review; multi-year service agreements that haven't been reassessed in over a year are a near-guaranteed source of quiet overspend.
FAQs
Common Questions on Hospital Maintenance Cost Leakage
How much of our maintenance spend is typically hidden from the standard budget?
Industry analysis across more than 1,000 hospitals found that roughly 68% of maintenance-related cost impact stays hidden from standard budget lines, spread across overtime, rescheduling, and lifespan reduction.
Book a demo to see this broken down for your facility.
Can OxMaint show leakage by department or vendor specifically?
Yes. The cost dashboard segments maintenance spend by department, asset class, and vendor, with reactive-to-planned ratios trending automatically so leakage sources are visible at a glance.
How quickly can we expect to see a reduction in emergency repair spend?
Facilities reaching 85%-plus PM compliance typically report an 18–28% reduction in emergency repair spend within about 18 months.
Start a free trial to begin tracking your own compliance trend today.
Does this require replacing our existing reporting process?
No. Weekly cost summaries generate automatically from field work order data, removing the manual report assembly step rather than replacing your existing leadership reporting structure.
Stop Letting Maintenance Costs Hide in Plain Sight
OxMaint turns scattered repair records into a live cost dashboard — so every dollar of leakage becomes visible, traceable, and fixable before the next budget cycle.