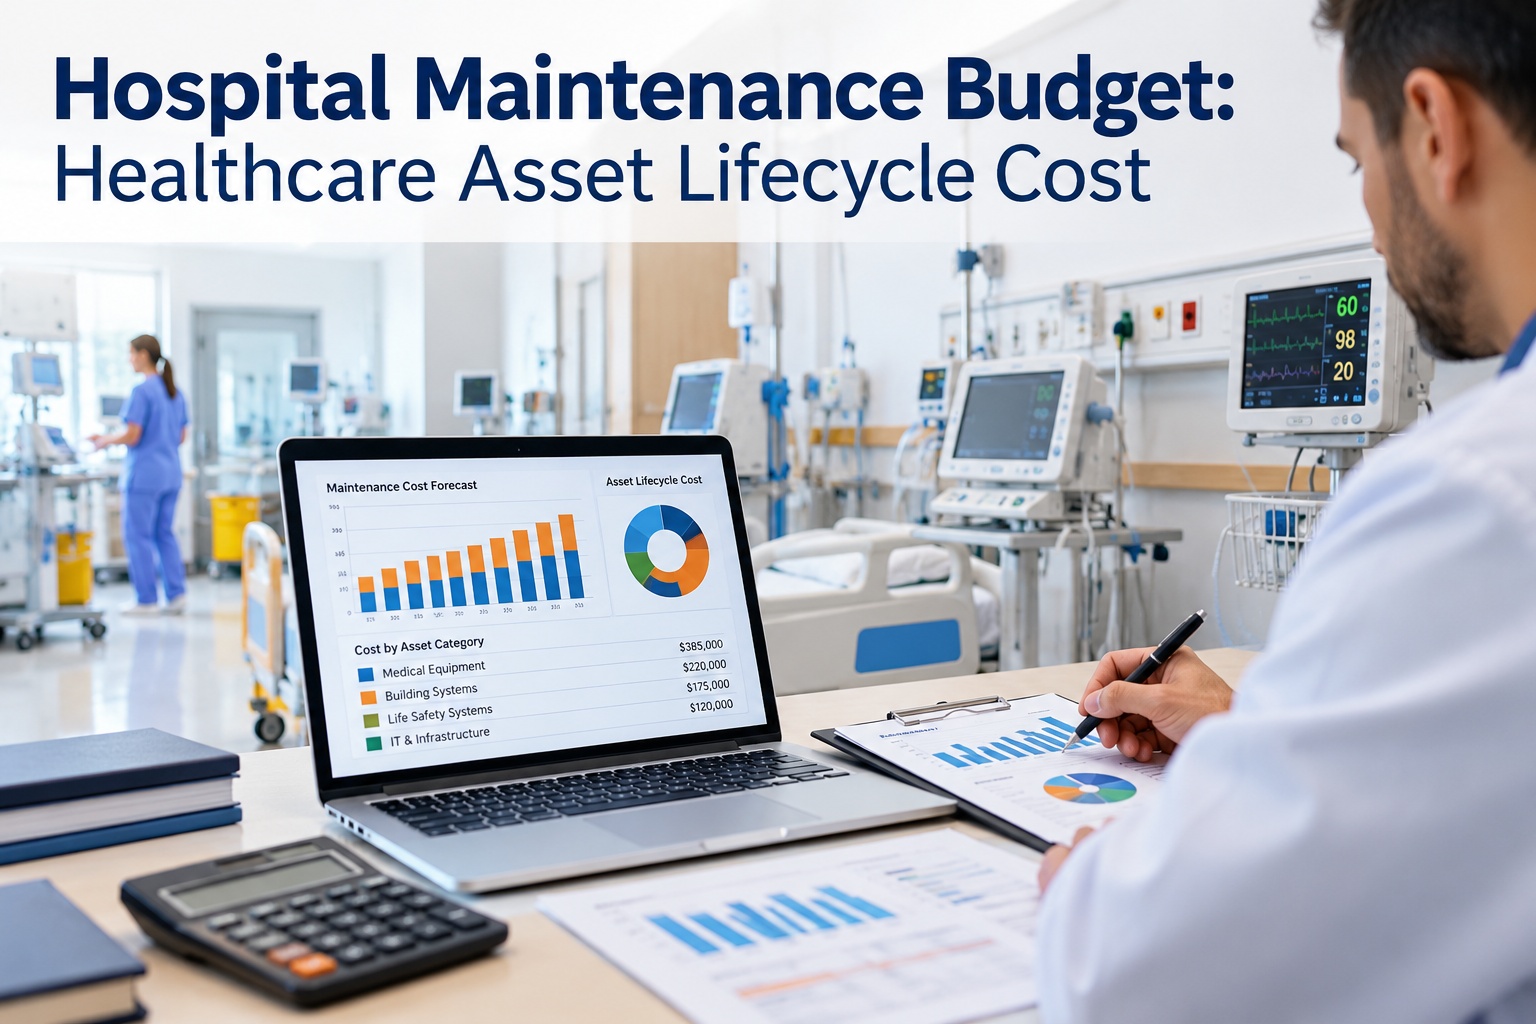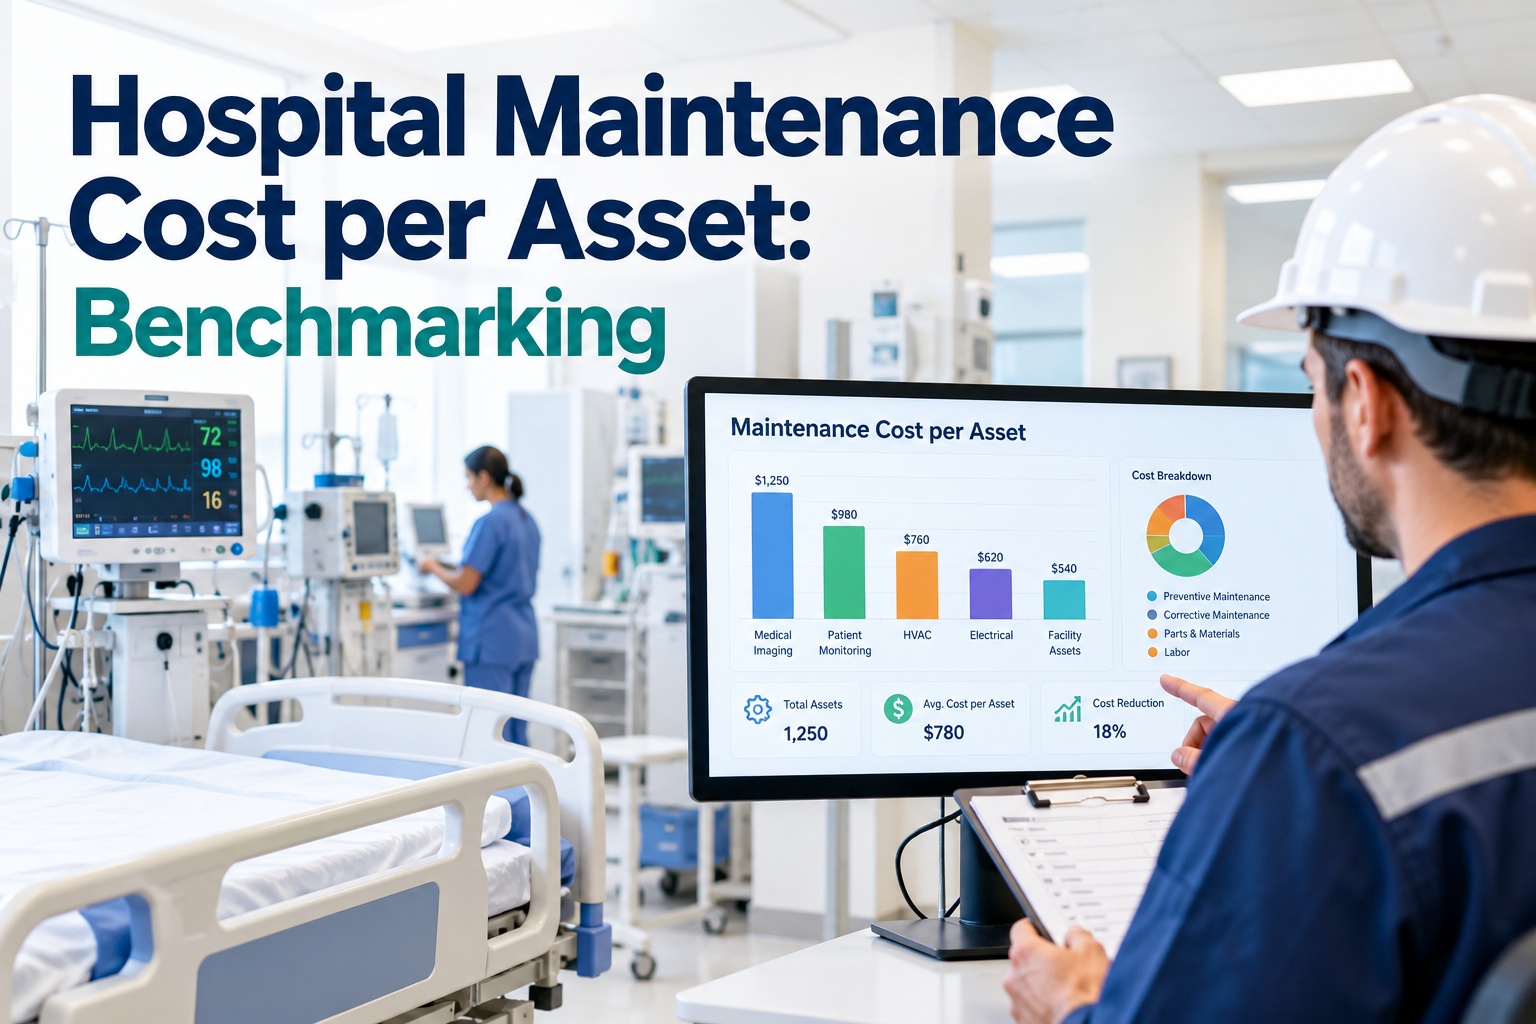
Ask a hospital facilities director what it costs to maintain a single infusion pump versus an air handler versus an MRI, and most can't answer — not because they don't care, but because maintenance spend is tracked as one big bucket, not per asset. That bucket hides everything useful: which assets are quietly draining the budget, which are cheaper to replace than repair, and whether a maintenance program is actually improving. Cost-per-asset benchmarking breaks the bucket open. This guide covers how to calculate it, what to compare against, and how OXMAINT AI, the AI-powered CMMS, ties every labor hour, part, and work order back to the asset that incurred it.
Hospital Maintenance Cost per Asset: Benchmarking
A single maintenance budget line tells you what you spent — never where it went or whether it was worth it. Cost-per-asset benchmarking turns that lump sum into a number per machine you can compare, trend, and act on. OXMAINT AI attributes every labor hour, part, and repair to the specific asset, so you can finally see which equipment costs the most to keep running — and build the predictive-maintenance case on real figures.
The Cost-per-Asset Formula
Cost per asset is simple in principle — total what you spent maintaining an asset over a period, and you have a number you can compare and trend. The discipline is capturing every input, not just the obvious repair invoice. Start free and capture every input automatically.
Not Every Asset Costs the Same to Keep
A per-asset number only means something in context. A high maintenance cost on an MRI is normal; the same cost on a general HVAC unit is a red flag. Benchmarking is about comparing like asset to like asset — and against the asset's own history. Book a demo to benchmark your own classes.
| Asset class | Cost profile | What to watch |
|---|---|---|
| Imaging | High — complex, vendor-serviced | Contract value vs. uptime; cost trending up faster than usage |
| Biomed devices | Moderate, high volume | Repeat repairs on a model; fleet-wide bad actors |
| Facility / HVAC | Moderate, steady | Rising cost signaling fouling, aging, or deferred PM |
| General equipment | Low per unit | An outlier costing far more than its peers |
You Can't Benchmark What You Can't Attribute.
Per-asset cost is impossible when labor and parts land in one undifferentiated budget line. OXMAINT AI logs every work order against the asset that caused it, so the cost-per-asset number builds itself from the work you already track — no separate accounting exercise.
Where the Number Pays Off
A cost-per-asset figure isn't a report you file — it's a decision tool. Four decisions get sharper the moment the number exists. Start free and put the number to work.
Reactive vs. Planned — The Cost Gap
The whole ROI argument for predictive maintenance lives in one comparison: what the same asset costs to run reactively versus on a planned program. The direction is consistent even when the exact numbers vary by site. Book a demo to model this for your assets.
- Emergency labor at premium rates
- Expedited parts and rush shipping
- Longer, unplanned downtime
- Collateral damage from hard failures
- Shorter asset life overall
- Scheduled labor at standard rates
- Parts ordered ahead, no premium
- Short, planned downtime windows
- Small fixes before big failures
- Longer, more predictable asset life
How OXMAINT AI Builds the Benchmark
The number is only as good as the data behind it. OXMAINT AI captures that data as a by-product of the work itself, then turns it into the benchmark. Start free and let the benchmark build itself.
One Budget Line vs. Cost per Asset
| What matters | Single budget line | OXMAINT AI |
|---|---|---|
| Cost visibility | One lump sum | Per asset, per class |
| Finding money pits | Invisible in the total | Outliers surface fast |
| Repair-or-replace | Judged on gut feel | Backed by cost data |
| Predictive ROI case | No evidence to cite | Reactive vs. planned figures |
| Budget defense | "We spent what we spent" | Where it went, and why |
| Program improvement | Can't tell if it's working | Cost trend shows the curve |
Frequently Asked Questions
Break the Budget Line Open — See Cost by Asset.
Tie every labor hour, part, and repair to the asset that incurred it, benchmark within each class, and turn cost per asset into repair-or-replace calls and a predictive-maintenance case built on your own evidence.