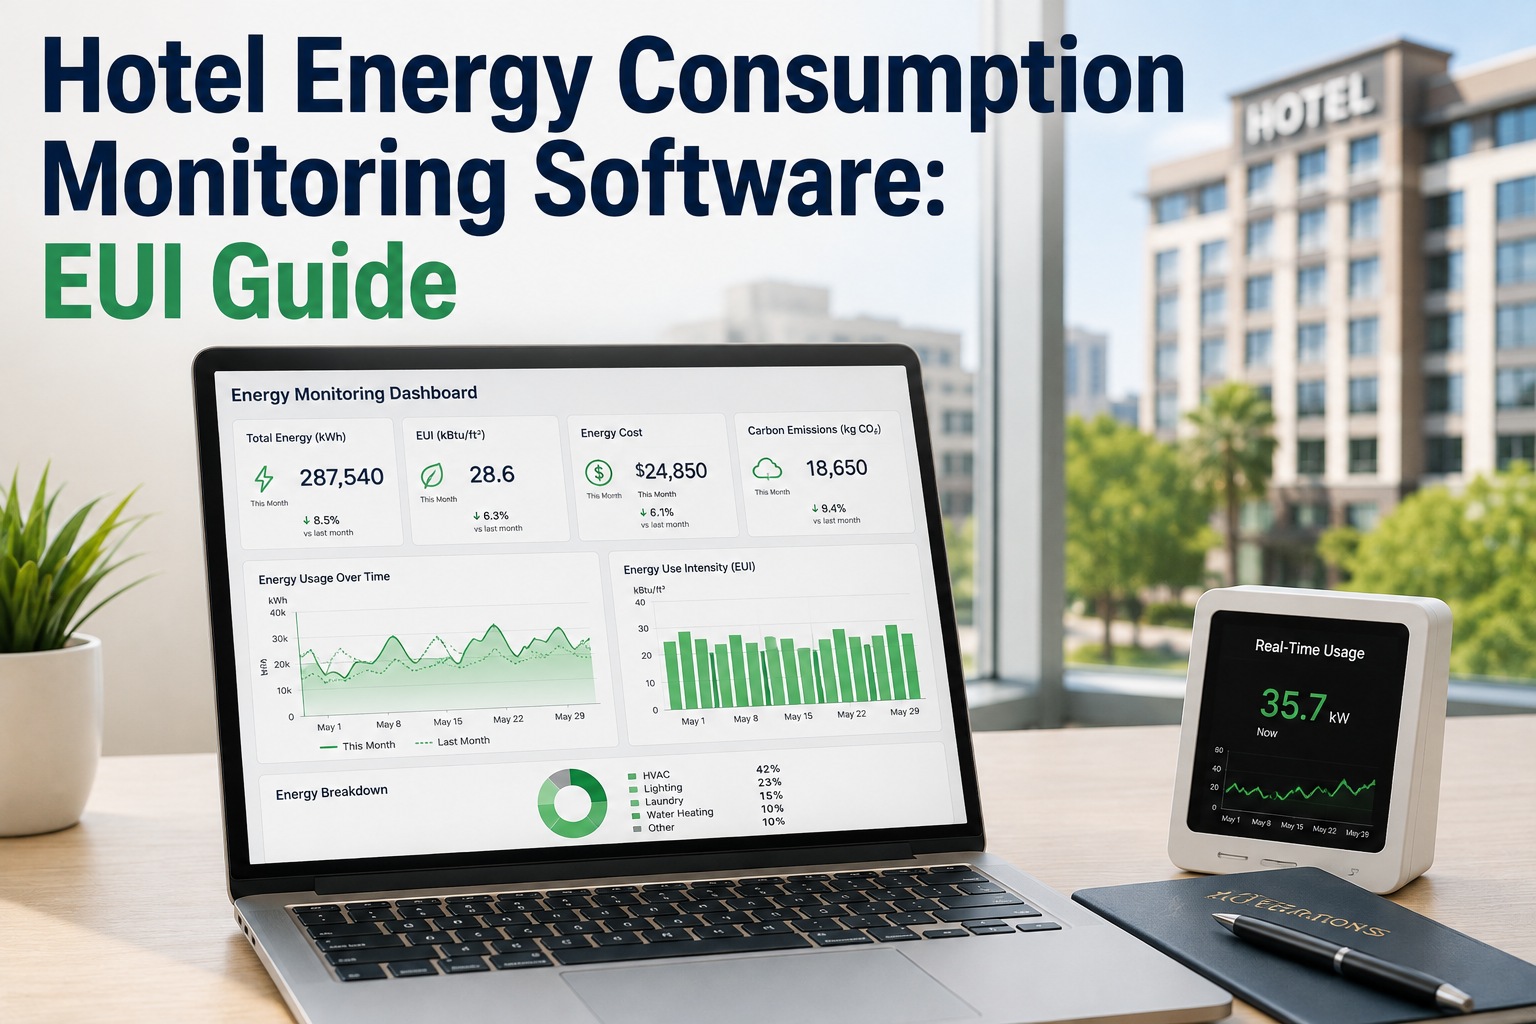
Hotel energy monitoring turns the metered signals every property already pays for into a live picture of where kilowatt-hours actually go — and where the 15-20% EUI reduction lives. This guide covers the EUI benchmark against ENERGY STAR percentiles, the hospitality end-use breakdown, the sub-metering hierarchy, interval-data anomaly signals, and the six cost levers with payback windows. Start free on OxMaint to load your property meter tree, or book a demo.
Hotel Energy · EUI · 2026
Hotel Energy Consumption Monitoring · The EUI Playbook
Sub-metering · load profiling · anomaly detection · payback ranking.
15–20%
Typical EUI reduction with monitoring + intervention
1–100
ENERGY STAR Portfolio Manager score range
15 min
Interval data resolution for anomaly detection
Where Your Property Sits · EUI Benchmarking
EUI (Energy Use Intensity, kBtu/ft²/yr) is the single hospitality benchmark that lets a property compare against peers, brand portfolio, and ENERGY STAR Portfolio Manager percentile bands. The scale below shows typical hospitality ranges — the goal is knowing where your property sits, and where the intervention path leads.
75–100
Top quartile · EUI ≤ 70
25–49
Below median · EUI ~ 110
1–24
Bottom quartile · EUI ≥ 130
ENERGY STAR Portfolio Manager score →
Full-service urban · median EUI ~ 100 kBtu/ft²/yr
Limited-service · median EUI ~ 65 kBtu/ft²/yr
Luxury / resort · median EUI ~ 140 kBtu/ft²/yr
ENERGY STAR certified · score ≥ 75
Where the Kilowatts Actually Go · Hospitality End-Use Breakdown
Before instrumenting anything, the property engineering director needs to know where energy goes at rest. The hospitality end-use pattern is remarkably consistent across full-service and limited-service — HVAC dominates, followed by lighting, DHW, and kitchen. The visualization below is the reference profile every sub-metering plan builds against.
Typical Full-Service Hotel Energy Breakdown
HVAC 42%
Lighting 18%
DHW 14%
Kitchen 12%
Laundry 8%
Misc 6%
HVAC — chillers, boilers, AHUs, PTACs, cooling towers
Lighting — guest floors, corridors, common areas, exterior
DHW — domestic hot water, recirculation, guest showers
Kitchen — walk-ins, hood exhaust, cooking equipment
Laundry — washers, dryers, ironers, DHW share
Misc — plug loads, elevators, IT, pool pumps
The Sub-Metering Hierarchy · Main to End-Use Circuit
You can't manage what you don't measure. A sub-metering plan disaggregates the main meter into end-use branches — the resolution needed to catch a chiller running out of hours or a laundry room drawing double the shift baseline. The tree below is the standard hospitality hierarchy.
Main Utility Meter
Total property kWh + demand + power factor
HVAC
Chillers, boilers, cooling towers, primary pumps, AHU motors
Lighting
Guest floors, corridors, back-of-house, exterior, parking
DHW / Hot Water
Water heaters, recirculation pumps, storage tank losses
Kitchen
Walk-in refrigeration, cooking equipment, hood exhaust motors
Laundry
Washers, dryers, ironers, laundry-dedicated water heating
Anomaly Signals · What Interval Data Actually Shows
Once sub-meters stream 15-minute interval data, patterns emerge that no monthly utility bill would ever reveal. Below are the six most common anomaly signals in hospitality interval data, with what each means and typical savings from resolving it.
Night Baseload Spike
Overnight kWh > expected occupancy baseline
Vacant floors still conditioned · unused kitchen equipment left energized · exterior lighting running past dawn
3–6% total
Weekend / Low-Occupancy Runtime
Weekend consumption matches midweek pattern
Setpoints not adjusting to occupancy · fixed schedules ignoring booking data · guest floors conditioned regardless
4–8% total
Chiller Short-Cycling
HVAC sub-meter shows repeated on/off spikes
Oversized chiller · staging control failure · low-load conditions with no lead-lag optimization
2–5% total
DHW Recirculation Overrun
Steady DHW draw during no-occupancy hours
Recirc pump running 24/7 · setpoint too high · uninsulated recirc loop losses
1–3% total
Kitchen Equipment Idle
Cooking-equipment draw between service periods
Ovens, griddles, fryers left on between meal service · walk-in door left ajar · hood exhaust running unnecessarily
1–3% total
Peak Demand Excursion
Coincident afternoon peak with poor power factor
All chillers + laundry + kitchen simultaneously · no demand-limiting · demand-charge on bill grows
2–6% on demand charges
Bring Your Sub-Meter Data Into the Maintenance Record — Free Forever
Sign up on OxMaint's free forever plan and connect main + sub-meter interval data to the same platform that runs your PM schedule. Anomaly signals auto-generate diagnostic work orders that land on the engineer's phone. No card, no time limit.
The 6 Cost Levers · Ranked by Payback
Once anomalies are visible, the intervention path is prioritized by payback. The six levers below are the field-standard ranked list — a hospitality-specific version of the "measure, then act" discipline that drives the 15-20% EUI reduction range.
01
Setpoint Discipline
Payback: immediate
Guest-floor and back-of-house setpoints reviewed and enforced. Every 1°F/0.5°C change on a large chiller plant is 2–3% of HVAC energy. Costs zero, saves immediately.
02
Occupancy-Based Control
Payback: 6–12 months
PMS occupancy data drives guestroom setback on vacant rooms. Corridor lighting steps down during low-traffic hours. Requires PMS integration but pays fast.
03
Chiller Sequencing & Optimization
Payback: 12–18 months
Lead-lag rotation, demand-based staging, chilled-water reset. Also catches oversized chiller short-cycling that would otherwise waste capacity.
04
LED Conversion (Remaining Areas)
Payback: 24–36 months
Any incandescent, halogen, or older fluorescent still in service — guest bathrooms, back-of-house, exterior. LED plus occupancy sensor is the second-order win.
05
DHW Recovery & Recirc Optimization
Payback: 18–30 months
Drain-heat recovery on shower loads, laundry heat recovery to DHW, recirc pump scheduling, tank insulation. Cumulative effect on the 14% DHW share.
06
Chiller / Boiler Retrofit
Payback: 4–7 years
High-efficiency replacement at end-of-life. Longer payback but the largest single move — often 20-30% reduction on the HVAC share alone. Aligns with capital planning.
How OxMaint Runs the Hotel Energy Program
Meter ingestion, sub-metering hierarchy, interval-data storage, anomaly detection, and cost-lever tracking all live on one CMMS — the same platform running the PM schedule and housekeeping QA, so anomaly-generated work orders land on the same engineer phone as scheduled maintenance.
Ingest
Main + Sub-Meter Streams
Utility API pulls, 15-min interval submeters, and gas / water / steam feeds all landing in one hierarchy per property.
Benchmark
EUI + ENERGY STAR Score
Live EUI trending against ENERGY STAR Portfolio Manager score, peer full-service / limited-service / luxury bands, and brand portfolio.
Disaggregate
End-Use Breakdown Live
HVAC / lighting / DHW / kitchen / laundry / misc share updated continuously against the reference hospitality profile.
Detect
6-Signal Anomaly Library
Night baseload · weekend runtime · chiller cycling · DHW overrun · kitchen idle · peak demand — each generates a diagnostic WO with reading attached.
Prioritize
6-Lever Payback Ranking
Cost levers ranked by payback specific to the property's meter profile. Immediate wins routed to engineering; capital items to planning cycle.
Report
Owner + Brand Sustainability Report
EUI trend, dollar savings, carbon reduction, and brand sustainability program alignment (Hilton LightStay, Marriott Serve 360, Hyatt World of Care, IHG Green Engage).
Turn Your Utility Bill Into a Live Operating Signal
Free forever plan — no card, no time limit. Connect the main meter, add sub-meters as they come online, and every anomaly signal fires a diagnostic WO on the same phone as the PM schedule. Or book 30 minutes and we'll walk your property's energy profile end-to-end on the platform.
Frequently Asked Questions
What is EUI and why is it the hospitality benchmark?
EUI is Energy Use Intensity, measured in kBtu per square foot per year. It's the single normalized metric that lets a property compare against peers of similar size and service level regardless of geography, climate zone, or hotel size. ENERGY STAR Portfolio Manager converts EUI into a 1–100 percentile score against a peer set; 75 or above earns ENERGY STAR certification. Typical full-service urban hotels sit around 100 kBtu/ft²/yr; limited-service around 65; luxury and resort properties around 140. The 15–20% EUI reduction range referenced across hospitality energy programs is what a disciplined monitoring + intervention program consistently delivers.
Where does energy actually go in a full-service hotel?
The pattern is remarkably consistent across the industry. HVAC is by far the largest share at roughly 42% — chillers, boilers, cooling towers, air handlers, and guestroom PTACs combined. Lighting is next at around 18%, split across guest floors, corridors, common areas, back-of-house, and exterior. Domestic hot water is around 14%. Kitchen (walk-in refrigeration, cooking equipment, hood exhaust) is around 12%. Laundry is around 8%. Miscellaneous — plug loads, elevators, IT, pool pumps — is around 6%. Any monitoring plan that doesn't have visibility into at least HVAC, lighting, DHW, and kitchen at the sub-meter level is missing more than 85% of where the money goes.
What sub-meters does a hotel actually need?
The minimum useful hierarchy is main utility meter plus five branch sub-meters — HVAC (chillers, boilers, cooling towers, primary pumps, AHU motors), lighting (all fixture branches), DHW (water heaters and recirculation), kitchen (walk-ins, cooking equipment, hood exhaust motors), and laundry (washers, dryers, ironers, laundry-dedicated DHW). Some properties add exterior lighting as a sixth branch and pool/spa as a seventh. Below that hierarchy, individual chillers or specific circuits can be sub-metered further where the ROI justifies — but the five-branch model catches the vast majority of anomaly-driven savings.
What anomalies show up in interval data that monthly bills would never reveal?
Six signals appear repeatedly across hospitality interval data. Night baseload spike — overnight consumption above the vacant-property baseline, meaning vacant floors are being conditioned or equipment is left energized. Weekend runtime matching midweek — setpoints ignoring occupancy. Chiller short-cycling — repeated on/off spikes on the HVAC sub-meter, meaning the chiller is oversized or staging is broken. DHW recirculation overrun — steady hot-water draw at 3 AM. Kitchen equipment idle between meal service — ovens, griddles, fryers left on. Peak-demand excursion — all major loads coincident in the afternoon, driving demand charges. Each one is invisible on the monthly bill but obvious on 15-minute interval data.
Book a demo to see the anomaly view.
Which cost levers pay back fastest?
Setpoint discipline is immediate — every 1°F/0.5°C setpoint change on a large chiller plant returns 2–3% of HVAC energy at zero capital cost. Occupancy-based control from PMS data pays in 6–12 months. Chiller sequencing and optimization pays in 12–18 months. LED conversion in remaining areas is a 24–36 month payback. DHW recovery and recirc optimization sits at 18–30 months. Full chiller or boiler retrofit is a 4–7 year payback and typically ties to capital planning cycles rather than operating budget. The ranked list is the "measure, then act" discipline that consistently delivers the 15–20% EUI reduction range referenced across hospitality energy programs.
Sign up free to load the lever tracker.