The hotel maintenance budget is one of the most consequential financial decisions a general manager or asset manager makes — yet it is frequently set by gut feel, last year's actuals, or arbitrary cost-cutting targets rather than structured financial analysis. The consequences of getting it wrong compound year over year in asset deterioration, emergency repair spend, and eventually brand erosion that no marketing budget can fix.
Industry benchmarks consistently point to 8–12% of total revenue as the appropriate range for hotel maintenance costs in full-service properties — but that headline number masks enormous variation by property type, asset age, brand standard, and geographic market. A 20-year-old full-service hotel in a humid coastal market will have fundamentally different hotel maintenance spending requirements than a two-year-old select-service property in a dry inland climate, even at the same room count and revenue level.
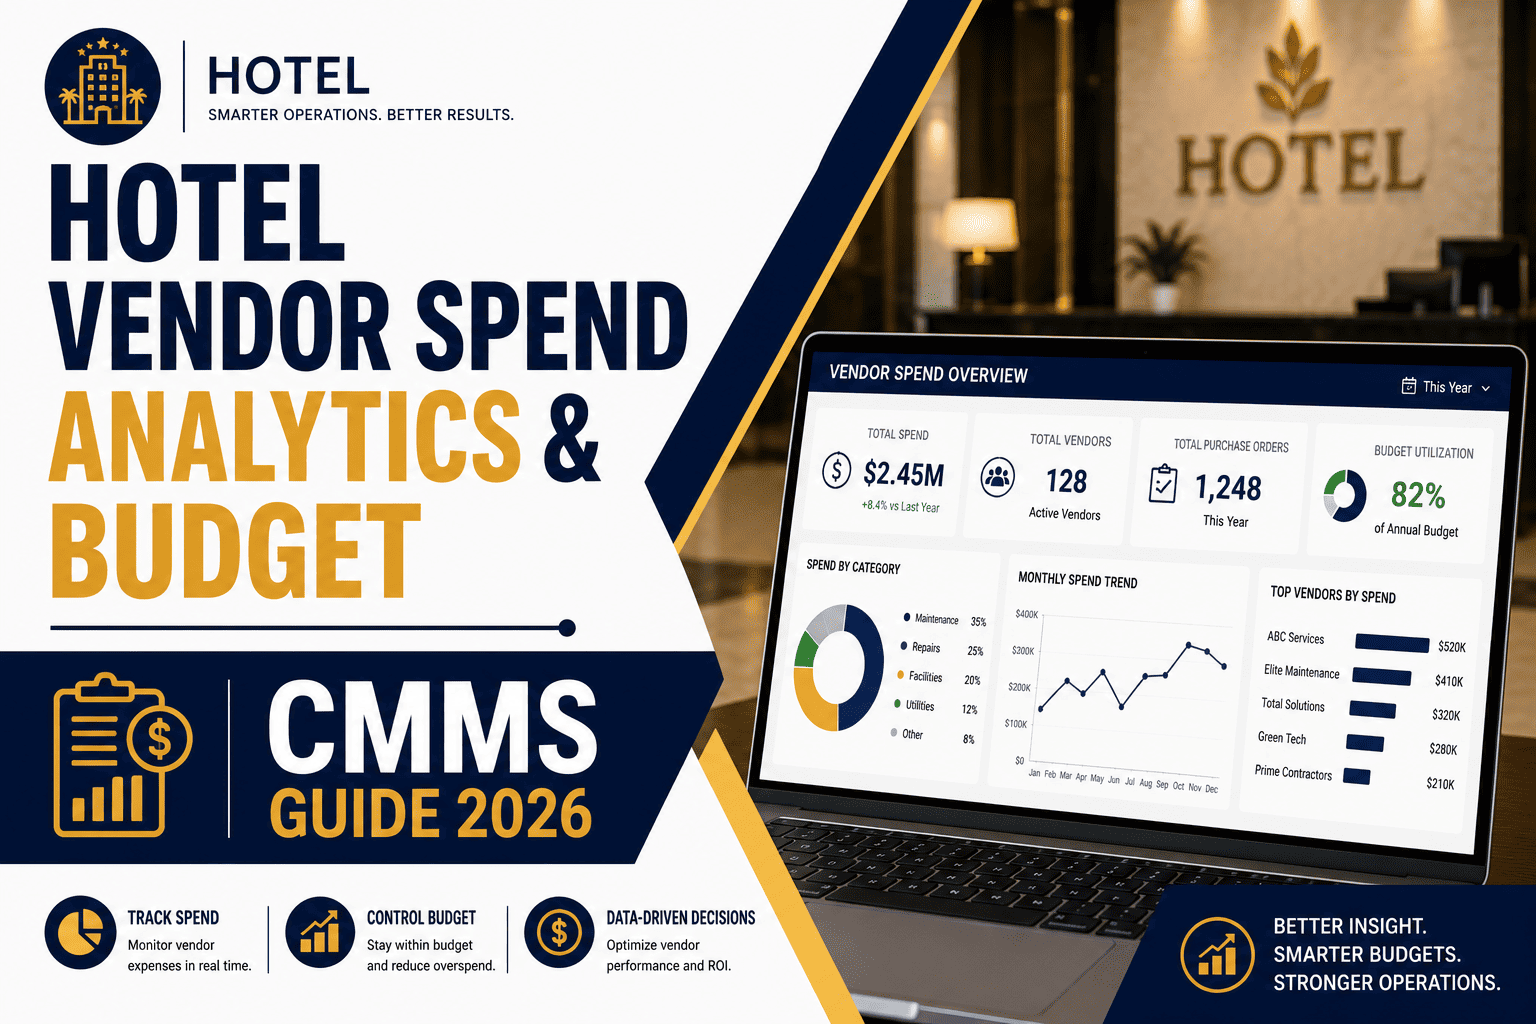
This article walks through how to think about hotel maintenance financial planning from first principles: how to benchmark your hotel maintenance expense ratio against peers, how to allocate the hotel POM budget across spend categories, how to build the hotel FF&E reserve into your long-range plan, and how a hotel inventory CMMS and analytics dashboard give you the data visibility to make the case for every dollar you request.
Every dollar of hotel maintenance spending deferred today typically generates $3–4 in future repair or replacement costs. Short-term budget cuts in the hotel POM budget that look attractive on a quarterly P&L create long-term capital expenditure obligations that are far harder to fund — and far harder to justify to ownership — than the original preventive maintenance spend would have been.
Hotel maintenance cost control is not about spending less — it is about spending smarter. The highest-performing hotel engineering teams consistently spend at or above benchmark levels on preventive maintenance while holding emergency repair and deferred work costs significantly below industry averages. That ratio discipline is what separates high-ROI maintenance programs from chronically reactive ones.
Hotel Maintenance Budget Benchmarks by Property Type
Hotel maintenance costs as a percentage of revenue vary significantly by segment. Use these benchmarks as a starting framework, then adjust for your property's specific age, brand standard, and market conditions.
Luxury & Upper Upscale
- Higher brand standards require more frequent replacement cycles
- Complex amenity sets (spas, pools, fine dining kitchens) drive hotel maintenance costs
- Guest expectations for perfection leave zero tolerance for visible deferred work
- Hotel cost per room often exceeds $3,500–$5,000+ annually at this segment
Full-Service (Upscale)
- Core benchmark range for most branded full-service properties
- F&B and meeting space infrastructure increases hotel maintenance spending baseline
- Hotel POM budget typically includes dedicated engineering staff of 5–12 FTEs
- Hotel maintenance cost per room ranges from $2,000–$3,500 annually
Select / Limited Service
- Simpler amenity set reduces hotel maintenance costs per room
- Leaner engineering teams (1–3 FTEs) with contracted specialist support
- Hotel maintenance financial planning driven heavily by PTAC and plumbing cycles
- Hotel maintenance cost per room typically $1,200–$2,200 annually
Extended Stay
- In-room kitchenettes and appliances significantly increase hotel maintenance spending
- Higher guest wear rates from longer stays accelerate replacement cycles
- Hotel operations budget must account for higher plumbing maintenance frequency
- Laundry equipment maintenance is a disproportionate cost driver in this segment
How to Allocate the Hotel Maintenance Budget
Once you establish the total hotel maintenance budget envelope, disciplined allocation across spend categories is what determines whether the money delivers maximum asset protection and cost efficiency. Here is the industry-standard allocation framework.
Hotel Maintenance Cost Per Room: Annual Reference Data
Hotel maintenance cost per room is a more granular and comparable metric than the percentage-of-revenue benchmark — especially when comparing properties across different RevPAR tiers. Use this as a secondary validation of your hotel maintenance budget.
| Property Segment | Cost Per Room / Year | % of Revenue | Labor Share | Parts & Supplies | Contracts |
|---|---|---|---|---|---|
| Luxury / Upper Upscale | $3,500–$5,500 | 10–14% | 45–55% | 20–28% | 20–30% |
| Full-Service Upscale | $2,000–$3,500 | 8–12% | 50–60% | 18–25% | 18–25% |
| Upper Midscale | $1,500–$2,500 | 7–10% | 52–62% | 18–24% | 15–22% |
| Select / Midscale | $1,200–$2,200 | 6–9% | 55–65% | 16–22% | 14–20% |
| Extended Stay | $1,600–$2,800 | 7–11% | 48–58% | 22–30% | 16–22% |
| Economy / Budget | $800–$1,500 | 5–8% | 58–68% | 15–20% | 12–18% |
Source: Compiled from STR, CBRE Hotels, and PKF Hospitality Research benchmark data. Adjust for asset age (+15–25% for properties over 15 years) and market (coastal/humid climates typically add 10–18% to hotel maintenance costs).
What the Hotel POM Budget Must Cover
The Property Operations and Maintenance (POM) budget is the operating line item that funds day-to-day hotel maintenance costs. Understanding its components in detail is essential for building a credible hotel maintenance financial plan and defending it to ownership.
Engineering Labor
Salaries, benefits, overtime, and on-call premiums for your engineering team. Typically 50–60% of the hotel POM budget. Understaffing here forces reliance on expensive contracted labor during peak demand periods and deferred preventive work.
Spare Parts & MRO Supplies
Hotel maintenance inventory costs including PTAC parts, filters, plumbing cartridges, electrical supplies, and other hotel maintenance supplies. Should be managed through a hotel inventory CMMS to control shrinkage and over-purchasing.
Service Contracts
Annual maintenance contracts for elevator systems, fire suppression, HVAC, pest control, water treatment, and kitchen equipment. Contracts offer budget predictability but require annual benchmark review to ensure competitive hotel maintenance spending rates.
Life Safety & Compliance
Fire alarm inspections, sprinkler testing, backflow preventer certifications, elevator state inspections, and ADA compliance work. Non-negotiable items that must be fully funded regardless of hotel maintenance budget pressure from above.
Energy & Utilities Infrastructure
Maintenance costs associated with energy management systems, BMS infrastructure, metering equipment, and efficiency retrofit projects that reduce the long-term hotel operations budget through lower consumption costs.
CMMS & Technology
Hotel inventory CMMS platform costs, mobile devices for technicians, analytics dashboard subscriptions, and hotel maintenance financial planning software. Typically 2–4% of the hotel POM budget — an investment that drives savings across every other category.
Hotel FF&E Reserve: The Capital Budget Behind the Operating Budget
The Furniture, Fixtures & Equipment reserve is a capital fund separate from the hotel POM operating budget, funded at 4% of gross revenue in most management agreements. Understanding how it interacts with hotel maintenance financial planning is critical for GMs and asset managers.
Initial Reserve Build
New properties contribute to the hotel FF&E reserve but rarely draw from it. Capital maintenance hotel costs are minimal and largely warranty-covered during this phase.
First Replacement Cycle
Soft goods (carpet, upholstery, bedding) typically reach first replacement. FF&E reserve hotel maintenance capital withdrawals begin. POM operating budget hotel maintenance costs rise as systems age past initial reliability curves.
Hard Goods Replacement
Casegoods, bathroom fixtures, major HVAC components, and elevator modernizations often fall in this window. Hotel capital budget maintenance planning must align FF&E reserve with operating POM budget to avoid funding gaps.
Major System Overhaul
Chiller replacements, roof systems, electrical infrastructure, and brand-mandated PIPs (Property Improvement Plans) drive the largest hotel maintenance cost peaks. Underfunded FF&E reserves here force ownership equity contributions or debt financing.
Comprehensive Renovation
Hotel maintenance spending and FF&E investment converge at full gut renovation levels. Properties in this cycle without adequate reserves face deferred deferred capital maintenance hotel obligations that can exceed $30,000–$50,000 per room.
Standard Reserve Rate
Most management agreements mandate 4% of gross revenue into the hotel FF&E reserve. Older assets or those approaching PIP cycles should consider supplemental contributions of 5–6% to avoid capital shortfalls.
Hotel Maintenance Cost Control: A Structured Approach
Effective maintenance cost control hotel operations requires systematic data collection and disciplined decision-making — not reactive budget slashing that creates larger costs downstream.
Establish Baseline Hotel Maintenance Expense Ratio
Before you can control hotel maintenance costs, you need accurate baseline data. Pull the last three years of POM actuals from your P&L and calculate hotel maintenance expense ratio as a percentage of total revenue for each year. Identify year-over-year trends and compare against the segment benchmarks above. If your ratio is significantly above benchmark, diagnose whether the driver is labor, emergency repairs, or contract costs before making any cuts.
Shift Spend from Reactive to Preventive
The single highest-ROI action in hotel maintenance financial planning is rebalancing the ratio of preventive to reactive hotel maintenance spending. If more than 25% of your POM budget is going to unplanned repairs and emergency hotel parts procurement, you are in a negative cycle. Invest in a preventive maintenance program backed by a hotel inventory CMMS and track the reactive spend reduction over 12 months — the payback is typically 6–9 months.
Benchmark and Renegotiate Service Contracts
Service contracts for HVAC, elevators, pest control, and kitchen equipment should be benchmarked against market rates every 2–3 years. Hotel maintenance cost control in this category often yields 10–20% savings without any reduction in scope. Bundling contracts with a single provider for multiple system types can also generate meaningful hotel maintenance spending efficiencies through volume pricing.
Deploy Analytics to Identify Cost Drivers
A hotel inventory CMMS analytics dashboard gives you visibility into which assets are generating disproportionate hotel maintenance costs — the 20% of assets typically responsible for 60–70% of unplanned repair spend. With that data, you can make informed repair-vs-replace decisions, schedule targeted PM upgrades, and build a defensible capital budget maintenance hotel justification for ownership.
Build a Multi-Year Hotel Maintenance Financial Plan
Annual hotel POM budgets set in isolation create reactive financial planning. Instead, build a 5-year hotel maintenance financial plan that projects major system replacement cycles, aligns FF&E reserve drawdowns with operating budget needs, and creates a smooth hotel maintenance spending trajectory — avoiding the spike-and-crash pattern that accompanies deferred maintenance programs.
Track Hotel Maintenance ROI Metrics Monthly
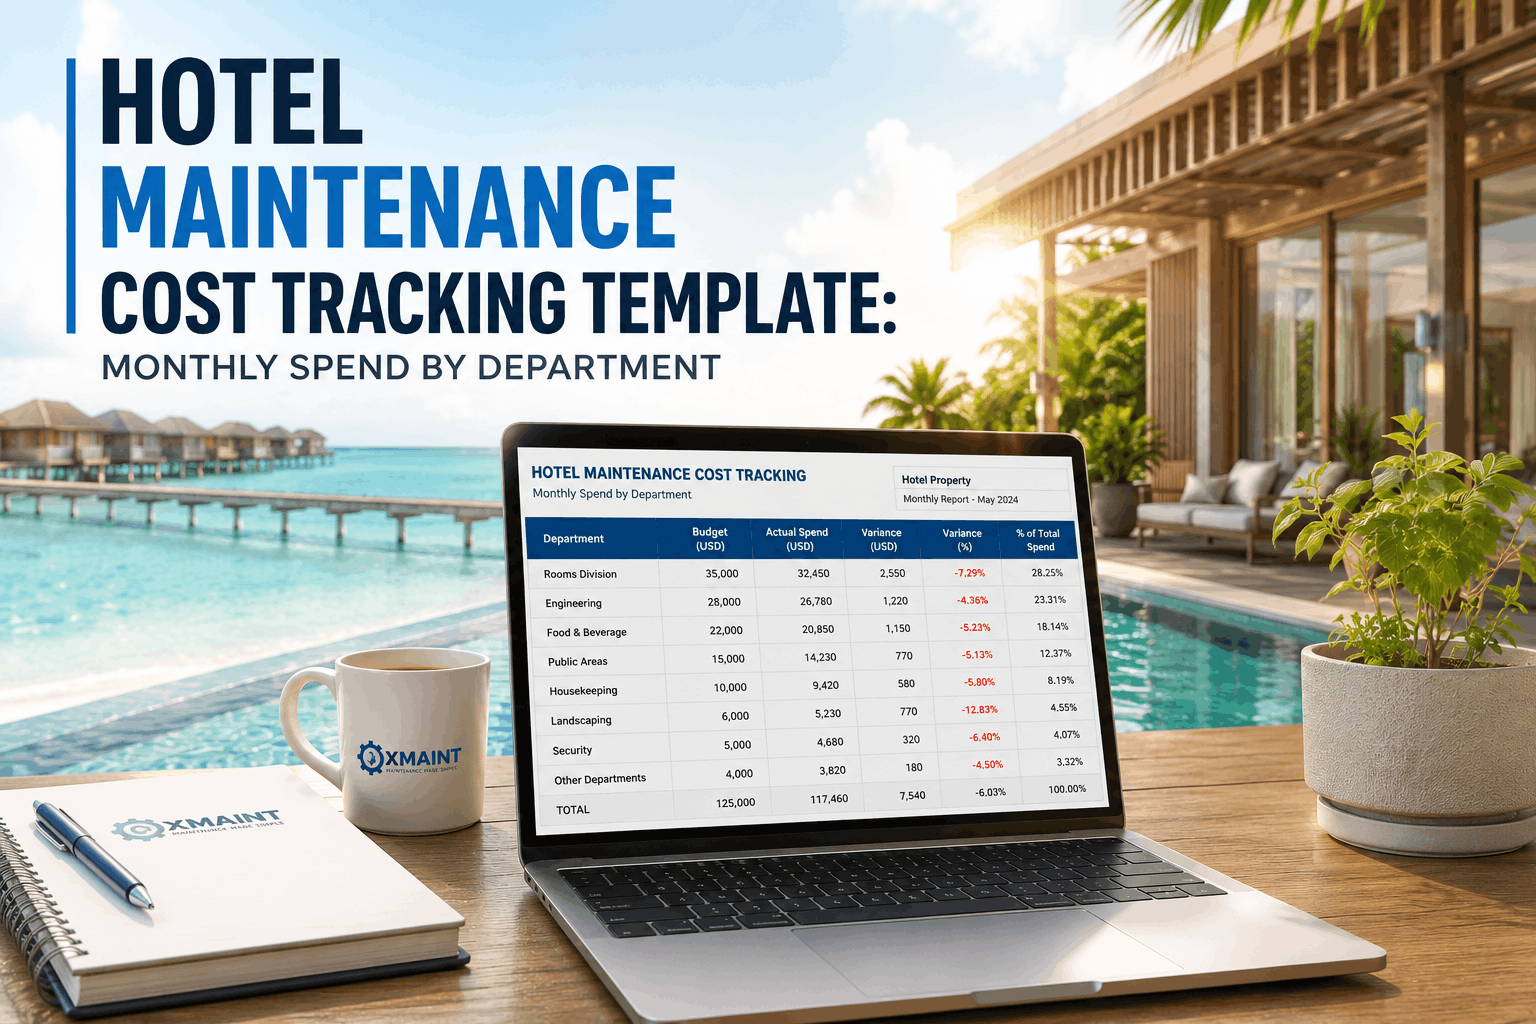
Report hotel maintenance ROI to ownership and leadership using a defined set of metrics: preventive vs. reactive ratio, cost per completed work order, mean time to repair, hotel maintenance cost per occupied room, and emergency hotel parts procurement spend as a percentage of total hotel maintenance costs. Monthly visibility creates accountability and makes the case for maintaining or increasing the hotel maintenance budget when data shows it is working.
Hotel Maintenance ROI: What the Numbers Show
Hotels that invest in structured hotel maintenance financial planning and digital tools consistently outperform those that treat maintenance as a cost to minimize rather than an investment to optimize.
Practical Tips for Building Your Hotel Maintenance Budget
Whether you're building next year's hotel POM budget or defending the current one to an ownership group looking for cuts, these tactics strengthen your financial position.
Anchor to Revenue, Not Last Year's Budget
Set your hotel maintenance budget as a percentage of projected revenue rather than incrementally from last year's actuals. This ensures the hotel maintenance expense ratio stays in benchmark range as revenue fluctuates — preventing both overspending in downturns and underfunding during growth years.
Age-Adjust Your Benchmark
Add 15–25% to the base benchmark range for every 5 years your property exceeds its brand-standard renovation cycle. A 15-year-old hotel with no recent PIP should not be budgeting hotel maintenance costs at new-build levels — the mechanical and structural reality demands more.
Separate Operating from Capital in Reporting
Keep hotel POM operating costs and hotel capital budget maintenance items in separate reporting lines. Mixing them obscures your true hotel maintenance expense ratio and makes it impossible to benchmark accurately against peer properties or industry data.
Budget for Seasonal Demand Spikes
Hotel maintenance spending is not evenly distributed across the year. Peak occupancy periods drive disproportionate emergency repair spend. Build a monthly hotel maintenance budget allocation that front-loads preventive work in Q1 and Q4 to reduce peak-season reactive costs.
Use CMMS Data to Build Your Proposal
Ownership groups respond to data, not intuition. A hotel inventory CMMS analytics dashboard that shows work order volume, repair cost by asset, preventive vs. reactive ratio, and hotel maintenance ROI metrics gives you the evidence base to defend every line item in your hotel maintenance financial plan.
Align with Revenue Management
Coordinate your hotel maintenance budget cycle with your revenue management team's occupancy forecast. High-occupancy weeks are not the time to schedule major maintenance, but the shoulder periods between them are ideal — and your hotel operations budget should reflect that scheduling reality.
Frequently Asked Questions
Answers to the most common questions from hotel GMs, directors of engineering, and asset managers about hotel maintenance budget planning and hotel maintenance cost benchmarks.
The industry benchmark for hotel maintenance costs is 8–12% of total revenue for full-service properties, 10–14% for luxury and upper upscale, and 6–9% for select-service and limited-service hotels. However, these are starting points — not targets. Your actual hotel maintenance expense ratio should be adjusted upward for older assets (add 15–25% per 5-year aging increment beyond renovation cycle), humid or coastal climates (add 10–18%), and complex amenity sets. A hotel that budgets below benchmark without a clear structural reason is typically building deferred maintenance obligations that will surface as capital emergencies within 3–5 years.
The hotel POM (Property Operations and Maintenance) budget is the primary operating line item that funds all ongoing hotel maintenance costs. It covers engineering labor (salaries, benefits, overtime), spare parts and hotel maintenance supplies, annual service contracts (HVAC, elevators, fire systems), life safety inspections and compliance costs, utilities infrastructure maintenance, and CMMS software costs. The hotel POM budget does not typically cover major capital replacements — those are funded through the hotel FF&E reserve or separate capital budgets. Understanding the boundary between operating hotel maintenance spending and capital hotel maintenance costs is essential for accurate hotel maintenance financial planning and ownership reporting.
The hotel FF&E (Furniture, Fixtures & Equipment) reserve is a capital fund — separate from the operating hotel POM budget — funded at a contractually specified rate (typically 4% of gross revenue) in most hotel management agreements. While the hotel maintenance budget covers day-to-day operational spending, the hotel FF&E reserve funds major replacement cycles: soft goods renovation, casegoods replacement, HVAC system overhauls, elevator modernizations, and brand-mandated PIPs. The two work in tandem: a well-funded hotel FF&E reserve reduces pressure on the hotel POM operating budget by ensuring capital-level maintenance hotel investments are funded separately, on schedule, rather than absorbed into operating costs as emergencies.
Hotel maintenance cost per room ranges from approximately $800–$1,500 annually for economy/budget properties up to $3,500–$5,500 for luxury hotels. Full-service upscale properties typically fall in the $2,000–$3,500 range. Hotel maintenance cost per room is a useful cross-property benchmark because it normalizes for room count, but it should always be used alongside the revenue-percentage metric — a high cost per room at low ADR may signal overspending, while the same cost per room at luxury ADR levels may be well within benchmark. Use both metrics together for the most complete picture of your hotel maintenance financial position.
A hotel inventory CMMS supports hotel maintenance financial planning in three critical ways. First, it gives you accurate historical cost data — work order costs by asset, category, and time period — that makes your hotel maintenance budget proposal evidence-based rather than estimate-based. Second, the analytics dashboard surfaces which assets are driving disproportionate hotel maintenance costs, enabling targeted repair-vs-replace decisions and capital hotel maintenance budget prioritization. Third, by tracking preventive vs. reactive maintenance ratios in real time, a hotel CMMS helps you demonstrate to ownership that your hotel maintenance spending is delivering measurable ROI — not just being consumed by emergencies. Properties using a CMMS consistently report 18–25% reductions in total hotel maintenance costs within 12 months of deployment.
The industry target is for preventive maintenance to represent 60–70% of total hotel maintenance costs, with reactive and emergency repairs contained to 15–20%. If reactive hotel maintenance spending exceeds 25% of your POM budget, your preventive program is structurally underfunded and you are in a negative cycle: reactive costs crowd out preventive budgets, which increases failure rates, which drives more reactive spending. The first priority in hotel maintenance cost control for any property in this situation is to rebalance toward preventive work — even if it means a short-term hotel maintenance spending increase — because the payback in reduced emergency costs typically materializes within 6–12 months.
The most effective approach to justifying a hotel maintenance budget increase is to frame it in the language of ownership — asset value protection and risk-adjusted return, not operational need. Present three things: first, your current hotel maintenance expense ratio vs. industry benchmark to show whether you are above or below market; second, a cost-of-deferral analysis showing what deferred hotel maintenance costs will compound to over 3–5 years using the 3–4× multiplier; and third, a hotel maintenance ROI calculation showing the projected reduction in emergency repair spend, guest compensation costs, and asset replacement acceleration if the preventive maintenance budget is funded at the proposed level. CMMS analytics dashboards that surface work order data and repair cost trends by asset are invaluable for building this case.
Build a Maintenance Budget That Ownership Approves — and Data Defends
Oxmaint's analytics dashboard and hotel inventory CMMS give you the work order cost data, preventive vs. reactive ratios, and asset-level hotel maintenance ROI metrics you need to build and defend a winning hotel maintenance budget — every cycle.
A Hotel Maintenance Budget Built on Data, Not Guesswork
The hotel maintenance budget is not a cost to be minimized — it is a capital allocation decision that determines whether your asset holds its value, your guests have experiences worth repeating, and your engineering team can do its job without perpetual crisis management. The 8–12% of revenue benchmark exists because the industry has learned, through hard experience, that properties that spend below it consistently accumulate deferred maintenance obligations that cost far more to resolve than the original hotel maintenance spending would have.
Getting your hotel maintenance financial planning right requires three things that too many hotels still lack: accurate historical data on what maintenance actually costs by asset and category, a structured allocation framework that prioritizes preventive over reactive hotel maintenance spending, and the analytical tools to communicate hotel maintenance ROI in the language of ownership and asset management.
A hotel inventory CMMS with a proper analytics dashboard provides all three. It turns the hotel POM budget from an annual negotiation based on instinct into a data-driven investment proposal backed by repair cost history, asset lifecycle data, and demonstrated hotel maintenance ROI. That shift — from gut feel to evidence — is what enables engineering teams to secure the hotel maintenance budget their properties actually need, and to deliver the results that justify it.
Whether you manage a 60-room select-service property or a 400-room luxury resort, the principles of hotel maintenance cost control and hotel maintenance financial planning remain the same: spend at the right level, allocate it toward prevention, track every dollar, and use the data to make the case for doing it right every single year.