Hotel Maintenance Budget Planning: Cost Benchmarks, Per Room Metrics & Forecasting Strategies (2026)
By Jam on March 23, 2026
Hotel engineering and asset management teams operating on fixed-interval overhaul schedules consistently overspend on reactive repairs while underinvesting in condition-based interventions. Industry benchmarks place maintenance expenditure between 4% and 6% of total revenue for full-service properties — yet properties without structured budget planning frameworks routinely exceed this band by 20% to 35%, driven by emergency premium costs and unplanned capital calls. A disciplined budgeting methodology separates assets by criticality, stratifies spend between CapEx and OpEx, and connects condition data to financial forecasts before the annual cycle closes. Engineering teams looking to implement this framework can sign up for a free Oxmaint trial or book a 30-minute demo to see how the platform structures budget tracking across the full asset hierarchy.
Cost and BudgetingHotel Maintenance Budget Planning Guide With Cost Benchmarks and Forecasting Tips10–12 min read
4–6%
of total revenue: industry benchmark range for full-service hotel maintenance expenditure
$1,200–$2,800
cost per available room annually for maintenance across midscale to luxury segments
3.1x
higher cost per repair event for reactive versus planned preventive maintenance interventions
18–24 mo
typical payback period for CMMS-integrated condition monitoring investment in full-service properties
Maintenance Budget Architecture: CapEx vs OpEx Framework
The structural distinction between capital expenditure and operating expenditure governs tax treatment, depreciation schedules, owner approval thresholds, and financial reporting — yet many hotel engineering teams conflate the two, creating budget variances that erode operator credibility with ownership groups. A rigorous classification discipline is foundational to accurate budget construction. Teams that want to see how Oxmaint enforces CapEx/OpEx separation at work order level can book a demo or sign up to explore the cost classification tools directly.
Capital Expenditure (CapEx)
Typical Classifications
HVAC system replacementElevator modernisationRoof replacementBoiler plant overhaulLife safety system upgrades
Approval and governance
Owner approval above management company threshold · Depreciated over asset useful life · Capitalised on balance sheet · Requires FF&E reserve draw authorisation
3–5% RevPAR
typical FF&E reserve contribution rate per management agreement
Operating Expenditure (OpEx)
Typical Classifications
PM labour and materialsService contractsConsumablesMinor repairsCompliance inspections
Approval and governance
GM or Director of Engineering authority · Expensed in period incurred · Impacts EBITDA directly · Reviewed monthly in owner financial reporting
55–65%
of total maintenance spend typically classified as OpEx in full-service hotels
FF&E Reserve Strategy
Reserve fund components
Rooms renovation cycleF&B area refreshPublic area upgradesBack-of-house systems
Planning horizon
5–10 year rolling capital plan · Aligned with brand standard cycle (typically 7–9 years) · Draws require asset manager and lender approval at threshold values
$8K–$22K
per key full guest room renovation cost range by segment
Track CapEx, OpEx, and Reserve Spend in One Platform
Oxmaint's Budget Analytics Dashboard connects work order costs to asset records and separates capital from operating spend automatically — giving engineering and finance teams a single source of truth for owner reporting.
Cost Per Available Room Benchmarks by Hotel Segment
Cost per available room (CPAR) is the standard normalisation metric for comparing maintenance expenditure across property types, enabling meaningful benchmarking against competitive sets and brand portfolio averages. The ranges below reflect stabilised properties; assets undergoing deferred maintenance remediation or post-acquisition repositioning will sit outside these bands. To track your property's CPAR in real time against these benchmarks, sign up for Oxmaint and connect your work order costs to the built-in Cost Per Room dashboard — or book a demo to see how the reporting is configured for your segment.
Expanded amenity footprint with pool, fitness, and meeting space increases system count. In-house engineering team typically 2–4 FTEs. Mix of in-house and contracted specialist maintenance.
Revenue %: 4.0–5.0%
Full Service / Upscale
CPAR: $1,700–$2,400
Multiple F&B outlets, full spa, conference infrastructure, complex BMS and kitchen systems. Engineering team 6–12 FTEs. Specialist contracts for BMS, elevators, fire suppression, kitchen ventilation.
Revenue %: 4.5–5.5%
Luxury / Upper Upscale
CPAR: $2,400–$4,500+
Highest service standards demand zero-defect presentation. Significant spend on aesthetic maintenance (finishes, fixtures, FF&E condition). Engineering team 12–25+ FTEs plus dedicated specialist contractors.
Revenue %: 5.0–6.5%
Resort / Integrated Complex
CPAR: $2,800–$6,000+
Outdoor infrastructure, water features, beach or ski assets, multiple pool systems, and large-format F&B substantially increase complexity and contractor cost. Seasonal demand patterns create budget volatility.
Revenue %: 5.5–7.5%
Convention / Conference Hotel
CPAR: $2,000–$3,500
High-intensity use of AV infrastructure, rigging, HVAC for large ballrooms, and vertical transportation systems. Compressed turnaround cycles between events increase maintenance frequency requirements.
Revenue %: 4.8–6.0%
Budget Construction: From Asset Register to Annual Plan
A defensible maintenance budget is built from the asset register up — not from last year's actuals with an inflation adjustment. The four-stage methodology below produces budgets that survive ownership scrutiny, align with management agreement obligations, and connect engineering decisions to financial outcomes. Properties already using Oxmaint can apply this methodology directly within the platform — sign up to get started, or book a demo to walk through the asset register and budget configuration for your property type.
1
Asset Criticality Classification
Score all assets on revenue impact of failure, safety consequence, and repair lead time. Tier 1 assets (critical path to revenue or life safety) receive condition monitoring and dedicated budget lines. Tier 2 and 3 assets are managed by PM frequency and pooled contingency.
→
2
PM Task Costing and Scheduling
Each PM task is costed at standard labour rate plus materials. Frequency is set by OEM specification or brand standard (whichever is more demanding). CMMS generates annual PM cost by asset — this forms the OpEx baseline before contingency or reactive allowance is added.
→
3
Condition-Based Capital Identification
Condition assessment data (vibration trends, thermal findings, inspection scores) identifies assets approaching end of reliable service life within the budget horizon. These are elevated to CapEx requests with RUL estimates — converting condition data into capital forecasts before failure forces an emergency request.
→
4
Contingency Stratification and Reserve Alignment
Reactive contingency is set at 15–25% of PM budget for Tier 1 assets and 8–12% for Tier 2/3. FF&E reserve draws are planned against the 5-year capital plan and aligned with management agreement contribution rates. Total budget is reconciled against CPAR benchmarks and revenue percentage targets.
Maintenance Budget Performance: Unstructured vs CMMS-Integrated Planning
Metric
CMMS-Integrated Budget Planning
Unstructured / Spreadsheet-Based
Budget accuracy (actual vs plan)
Variance typically within 8–12%. PM costs tracked against work orders; actuals feed next year's budget automatically.
Variance of 20–40% common. Reactive costs obscure true PM spend. Budget based on inflated prior year actuals.
CapEx timing and forecasting
Condition trend data forecasts replacement 12–36 months in advance. Capital requests submitted with RUL data and cost evidence.
Capital needs identified at failure or annual inspection. Emergency CapEx requests damage owner relations and carry 30–60% cost premiums.
Cost per available room tracking
Real-time CPAR by department, asset class, and cost centre. Monthly reporting to asset management without manual data extraction.
CPAR calculated retrospectively from invoices. No department-level visibility. Asset manager requests require 2–4 week data assembly lag.
Reactive maintenance as % of total
Typically 15–25% of total maintenance hours on planned PM programmes. Condition triggers replace emergency response for Tier 1 assets.
Reactive maintenance commonly 45–60% of total hours. High emergency premium costs distort budget and inflate EBITDA variance.
Owner and lender reporting
Automated cost reports by asset, period, and category. CapEx vs OpEx split extracted directly for financial statement alignment.
Manual report assembly from multiple systems. CapEx/OpEx misclassification risk. Audit exposure on management agreement compliance.
Critical Asset Budget Allocation: Where to Concentrate Maintenance Spend
Revenue-generating and guest-facing systems command disproportionate maintenance investment relative to their share of total asset count. The following allocation framework reflects industry practice at full-service properties with 200–500 keys — adjust weighting for property type, age, and segment positioning. If you want to model spend allocation across your specific asset mix, sign up for Oxmaint to configure your asset hierarchy, or book a demo to see how cost centres are structured for full-service and resort properties.
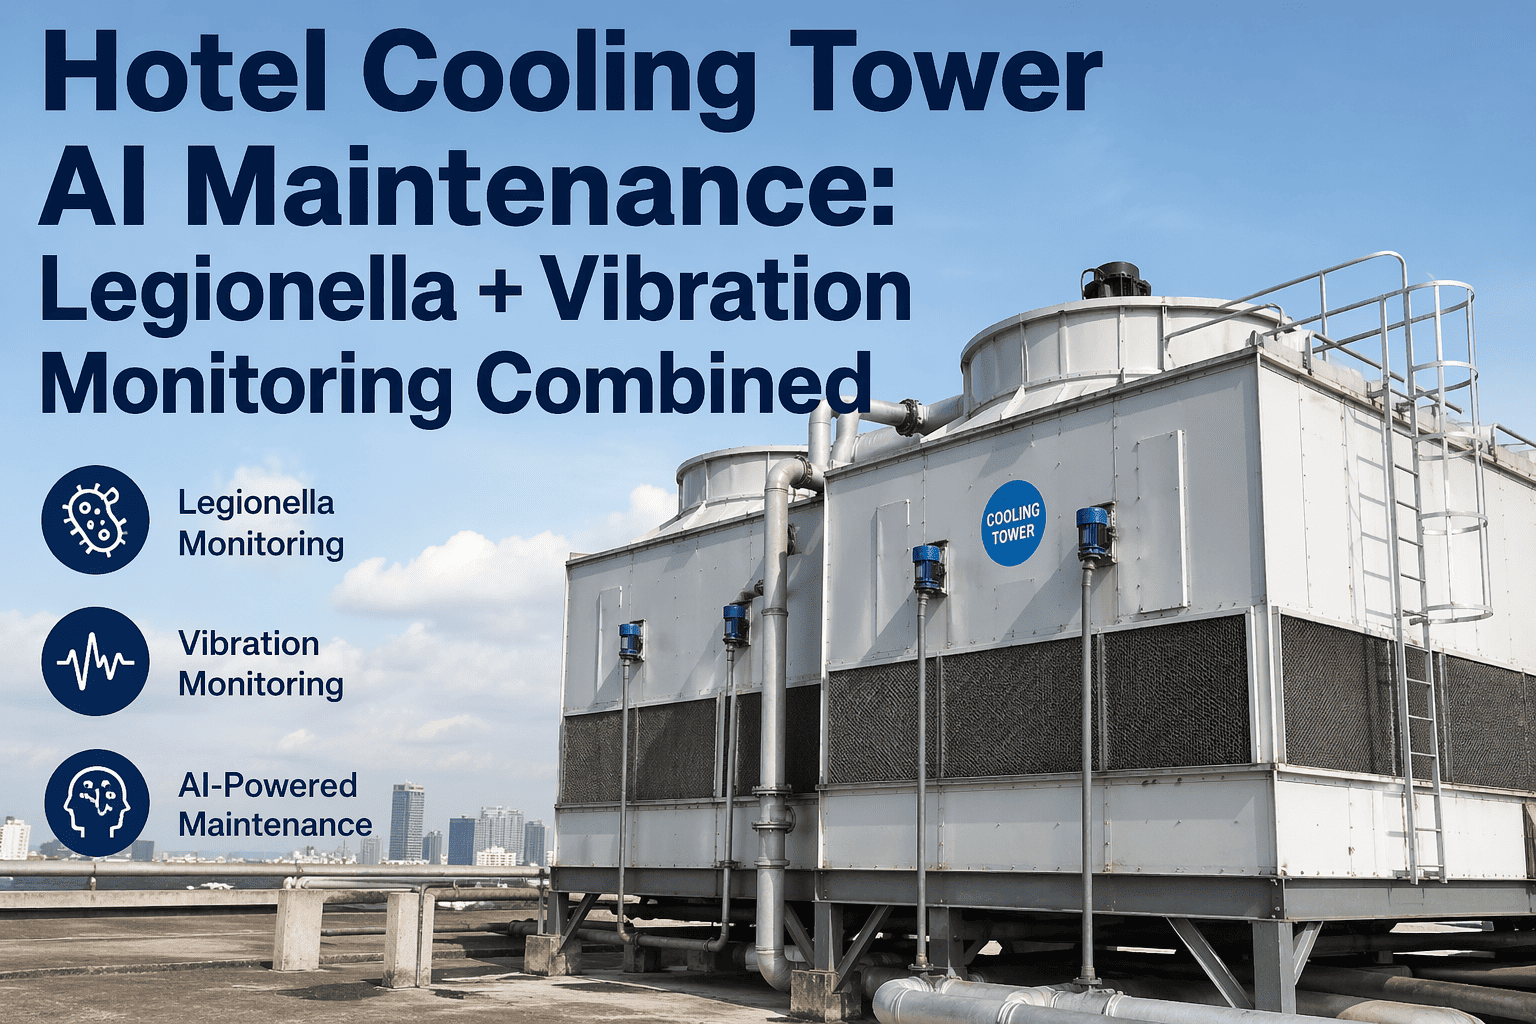
HVAC Systems
25–35% of total OpEx
Largest single maintenance cost centre in most hotels. AHUs, chillers, cooling towers, fan coil units, and VAV systems require multi-trade PM coordination. Chiller replacement is frequently the largest single CapEx event in the 10-year horizon.
CapEx cycle: 15–25 years (chillers)
Vertical Transportation
8–14% of total OpEx
Elevator maintenance contracts typically fixed-price comprehensive or full-maintenance agreements. Modernisation CapEx at 20–25 years is a major capital event. Escalator and moving walk systems where present add to this category.
CapEx cycle: 20–25 years
Plumbing and Water Systems
10–18% of total OpEx
Domestic hot water systems, boilers, pumps, and pool plant. Legionella compliance programme is a non-discretionary cost. Water treatment chemistry and testing contracts add to baseline. Pipe replacement CapEx at 30–40 years in older assets.
CapEx cycle: 30–40 years (piping)
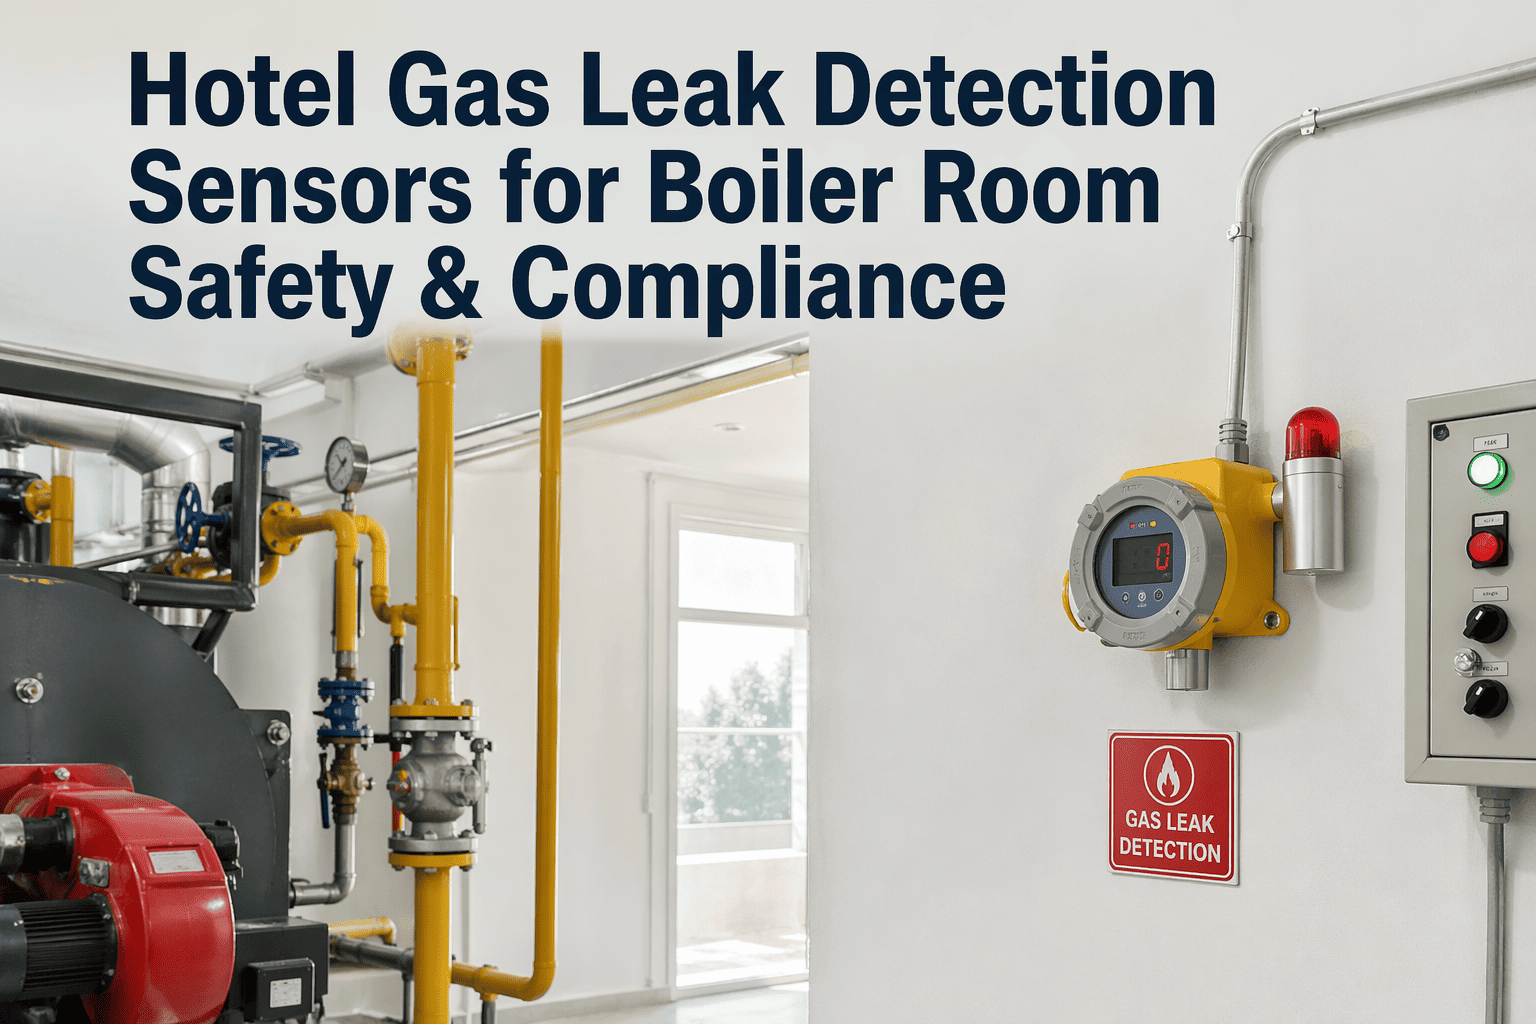
Electrical and Life Safety
12–18% of total OpEx
Switchgear, distribution panels, emergency generators, fire alarm, suppression, and sprinkler systems. Compliance testing is mandatory and non-deferrable. Generator load testing and fuel management add operational cost. ATS and UPS systems for critical systems.
CapEx cycle: 25–30 years (switchgear)
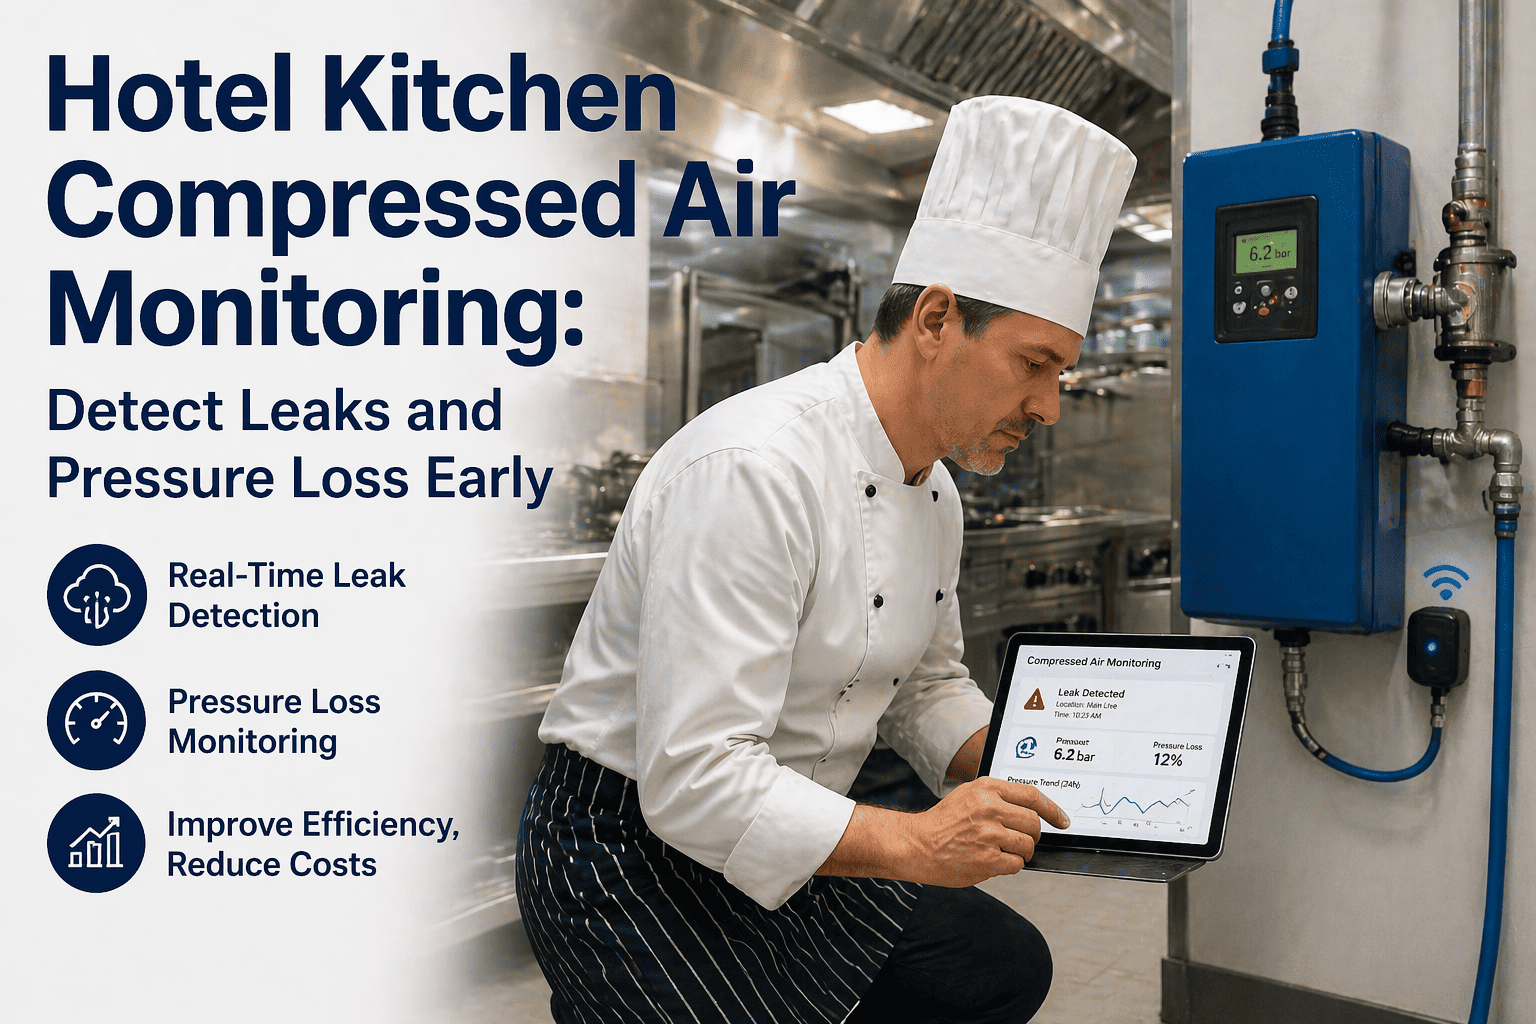
Kitchen and F&B Equipment
8–15% of total OpEx
High-frequency equipment with intensive duty cycles. Ventilation hoods, grease trap cleaning, and ansul system inspection are compliance-driven. Equipment replacement CapEx is frequent relative to other asset classes — 8–12 year cycle for commercial cooking equipment.
CapEx cycle: 8–12 years
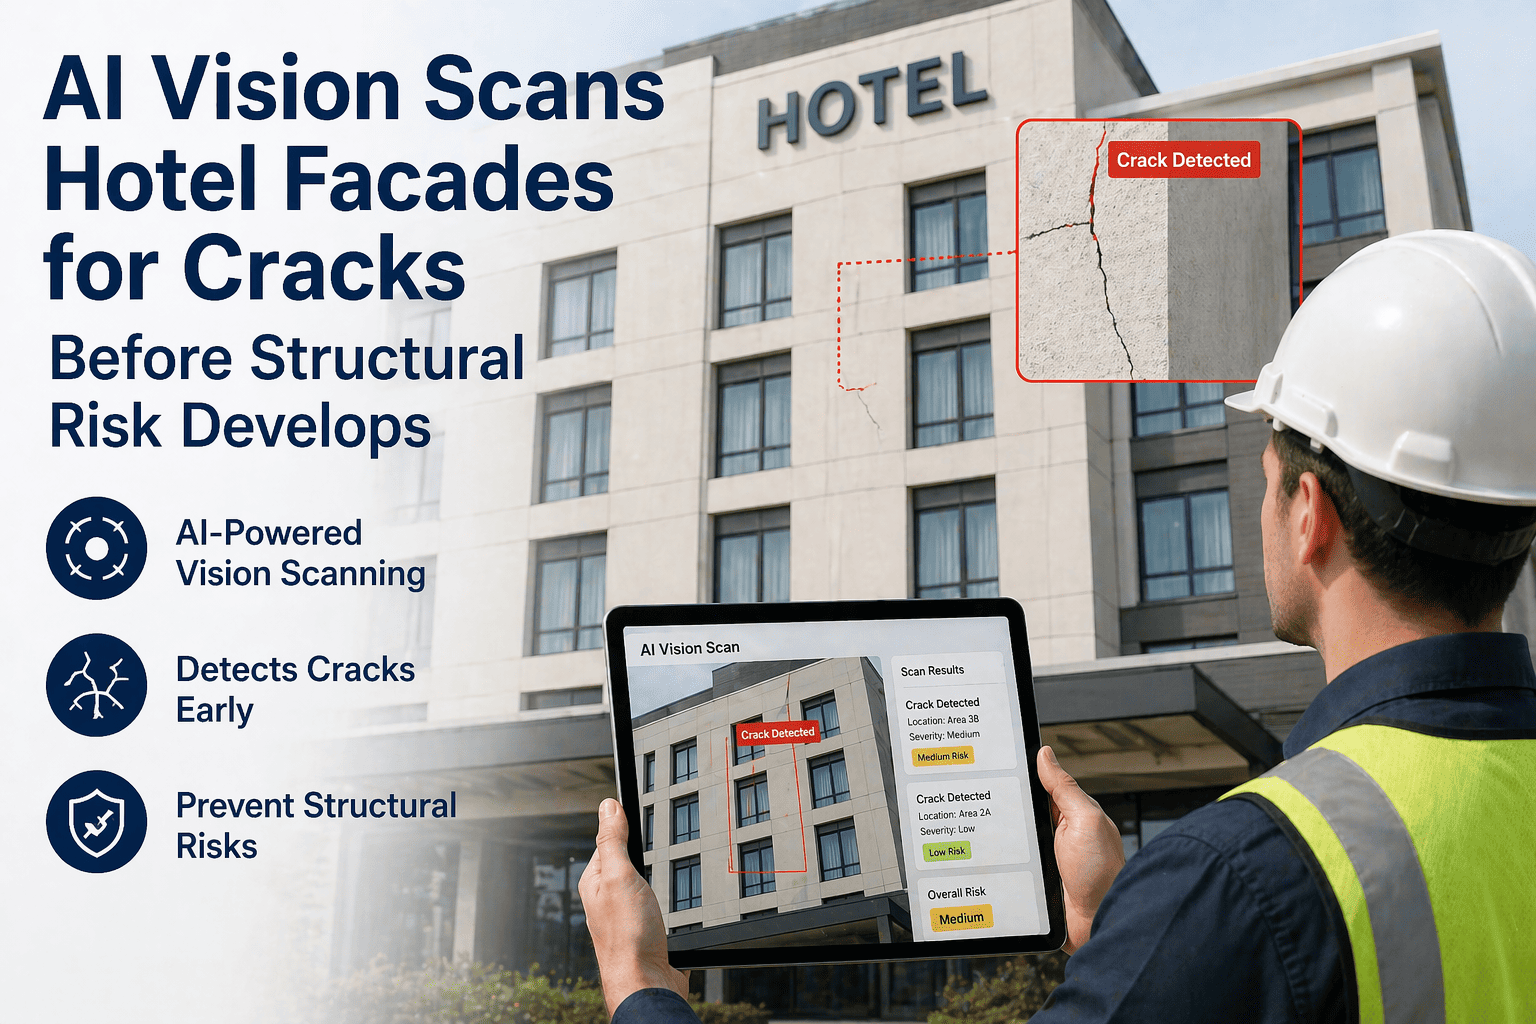
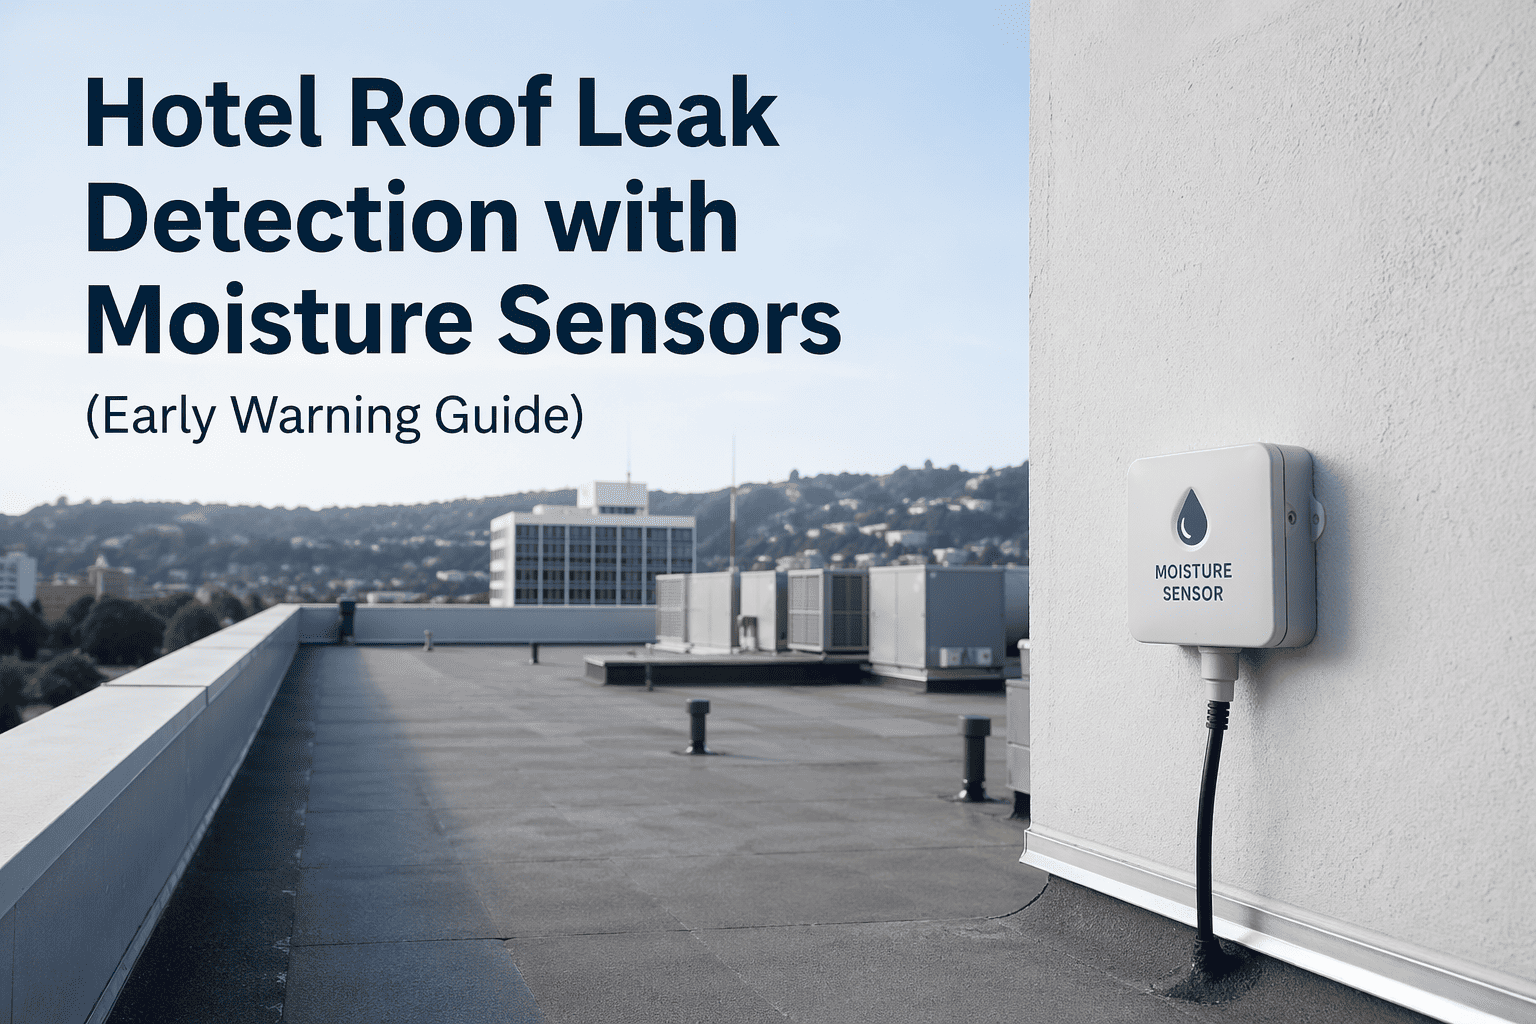
Building Envelope and Roof
6–12% of total OpEx
Routine inspection, sealant maintenance, and drainage management prevent escalating water ingress damage. Roof replacement is one of the most capital-intensive single events in the 20-year horizon. Façade specialist inspections required at 5-year intervals in many jurisdictions.
CapEx cycle: 20–25 years (roof)
Forecasting Methodology: Building a 5-Year Maintenance Capital Plan
Short-term budget accuracy matters for EBITDA reporting — but the 5-year capital plan is what protects ownership returns, satisfies lender covenant requirements, and enables strategic repositioning decisions. The forecasting framework below is designed for properties under institutional ownership or operating under brand management agreements where owner reporting obligations are material. Engineering directors building their first structured capital plan can book a demo to see how Oxmaint's CapEx Planning Tools generate RUL-based forecasts, or sign up to begin loading asset condition data against your register today.
1
Complete Physical Plant Assessment Against Asset Register
Commission a third-party property condition assessment (PCA) aligned with ASTM E2018 standards. Map PCA findings to the CMMS asset register. Assign remaining useful life (RUL) estimates to all Tier 1 and Tier 2 assets. Flag assets where condition monitoring data contradicts the PCA timeline — sensor-based evidence for capital timing has increasing credibility with sophisticated asset managers.
2
Model Replacement Cost Escalation at 3–5% Annually
Construction and equipment cost escalation has exceeded general inflation consistently in the post-2020 cycle. Apply segment-specific escalation factors to replacement costs: HVAC and electrical equipment at 4–6%, FF&E at 3–5%, labour-intensive envelope work at 5–8%. Sensitivity analysis at ±2% escalation creates the range for owner scenario modelling and stress-testing against debt service coverage ratios.
3
Align Capital Timing With Revenue and Occupancy Forecasts
Major capital projects carry displacement revenue costs that must be modelled explicitly. A chiller replacement requiring 6 weeks of partial common area closure displaces banqueting and pool revenue. CMMS work order data on seasonal demand patterns informs project timing optimisation. Owners expect engineering teams to present capital projects with displacement cost models, not just construction cost estimates.
4
Structure Reserve Draw Requests With Condition Evidence
FF&E reserve draw requests supported by condition monitoring trend data, vibration analysis reports, or thermal imaging findings have measurably higher approval rates and shorter approval timelines than requests based solely on age or visual inspection. Oxmaint condition reports export directly to owner-facing format — connecting engineering data to financial decision-making in the format ownership and asset management teams require.
12-Month Budget Performance Improvements With CMMS Integration
Reduction in reactive maintenance spend as percentage of total maintenance budget72%
Improvement in budget-to-actual variance — from 35%+ to under 12% within 12 months64%
Of CapEx requests submitted with condition data evidence versus inspection-only justification81%
Reduction in emergency premium costs — unplanned after-hours contractor callouts58%
Frequently Asked Questions: Hotel Maintenance Budget Planning
QWhat is the industry standard maintenance budget as a percentage of hotel revenue?
Full-service hotels typically target 4% to 6% of total revenue for total maintenance expenditure including both OpEx and CapEx components. Limited service properties operate at the lower end (3.5–4.5%) due to lower amenity complexity. Luxury and resort properties often exceed 6% when FF&E reserve contributions are included. Properties with deferred maintenance backlogs will sit above benchmark until remediation is complete — typically 2–4 years following an asset repositioning investment.
QHow should hotel engineering teams separate CapEx from OpEx for owner reporting?
The threshold between capitalisation and expensing is typically defined in the management agreement and should be reviewed with the property's finance controller and ownership group. Most hotel management agreements set a per-item threshold (commonly $2,500 to $5,000) above which expenditures are capitalised. Systems work that extends asset useful life is generally capitalised; work that maintains current functionality is expensed. CMMS work order coding should mirror this classification from point of creation to eliminate reclassification effort at period close.
QHow much contingency should be built into a hotel maintenance budget?
Industry practice varies by property age and condition, but a structured approach stratifies contingency by asset tier. Tier 1 critical assets (HVAC, electrical, vertical transportation) warrant 20–30% contingency above PM base cost given failure consequence. Tier 2 assets (secondary mechanical, kitchen equipment) carry 10–15%. The aggregate portfolio contingency on a well-managed full-service property typically lands at 15–20% of total PM budget. Properties above 20 years in age without recent system overhaul should budget at the higher end.
QWhat data should engineering teams present to ownership in annual budget reviews?
Credible annual budget presentations include: CPAR comparison against competitive set and brand portfolio benchmarks; prior year budget-to-actual variance with root cause analysis; asset condition summary for Tier 1 systems including remaining useful life estimates; 5-year capital plan with RUL-based timing justification; and reactive maintenance percentage trending over 24 months. Condition monitoring data (vibration trend charts, thermal imaging findings) presented for major CapEx requests materially strengthens the engineering team's credibility with sophisticated asset management and ownership groups.
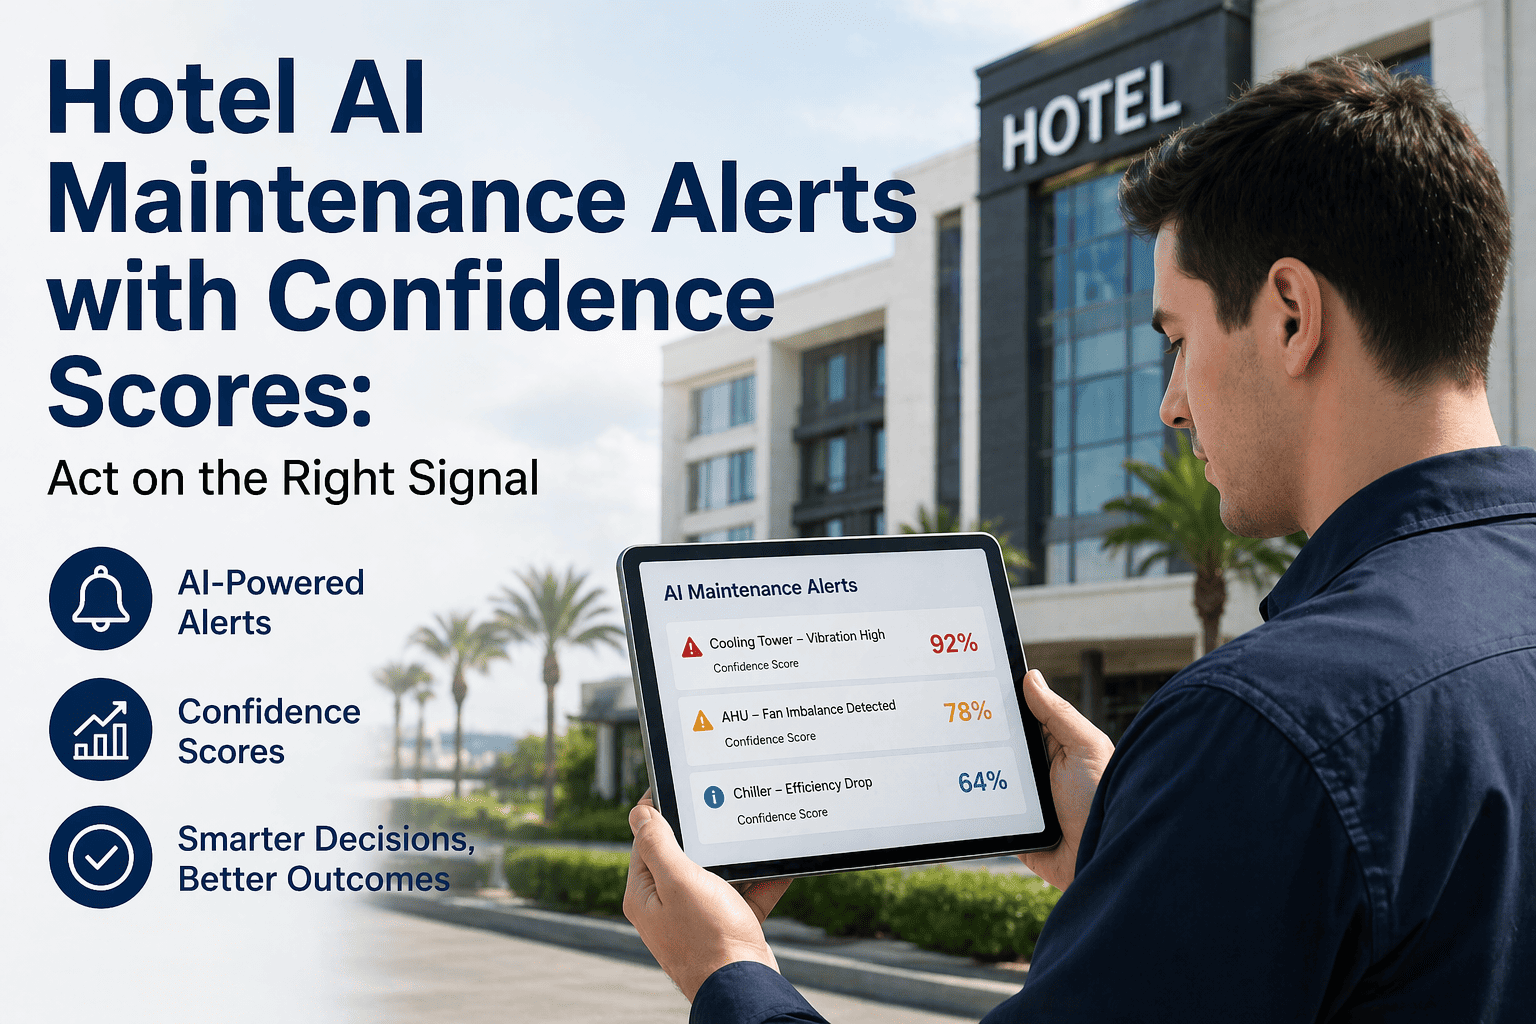
QHow does condition monitoring reduce hotel maintenance budget variance?
Budget variance in hotel maintenance is predominantly driven by unplanned reactive costs — emergency contractor callouts, premium-priced expedited parts, and overtime labour. Condition monitoring converts imminent failures into planned interventions by providing 4 to 12 weeks of advance warning on developing faults. Planned interventions are executed at standard labour rates during scheduled maintenance windows with pre-staged parts — eliminating the 2–3x cost premium associated with emergency response. Oxmaint connects sensor threshold breaches directly to work order creation, removing the 3 to 6 week delay between anomaly detection and maintenance action that causes most unplanned budget events.
Build a Data-Driven Hotel Maintenance Budget
Oxmaint's Budget Analytics Dashboard tracks cost per available room, separates CapEx from OpEx at work order level, and connects condition monitoring data to capital forecasts — giving engineering and asset management teams the financial visibility ownership expects.