Industrial cooling towers consume millions of gallons annually — and most facilities have no clear picture of where that water is actually going. Drift loss, blowdown inefficiency, and undetected leaks inflate consumption figures without triggering obvious alarms, while undertreated water drives equipment fouling that pushes energy costs higher through reduced heat transfer. Sign Up Free to see how OxMaint gives industrial facility teams the asset tracking, inspection records, and condition-based PM workflows needed to bring cooling tower water consumption under measurable control. This guide covers the metrics that matter, where consumption losses hide, and how a structured maintenance program translates tracking data into operational savings.
Track and Reduce Cooling Tower Water Waste
OxMaint connects cooling tower asset records to condition-based inspection workflows — tracking water treatment, drift, and blowdown data in one place to support water conservation and efficiency targets.
Why Water Consumption Metrics Are a Maintenance Priority for Industrial Cooling
Cooling tower performance is inseparable from water chemistry and flow management — and both deteriorate without consistent inspection and treatment tracking. Facilities that Book a Demo with OxMaint understand that asset condition records, water treatment logs, and PM completion history are the inputs that reveal consumption trends — not just the utility meter reading at the end of the month. When drift eliminators degrade, conductivity controllers malfunction, or basin leaks go uninspected, the variance between actual and optimal consumption compounds across every operational hour.
Evaporation accounts for 70–85% of cooling tower water loss. Tracking wet bulb conditions and load data helps establish expected evaporation baselines for comparison against measured consumption.
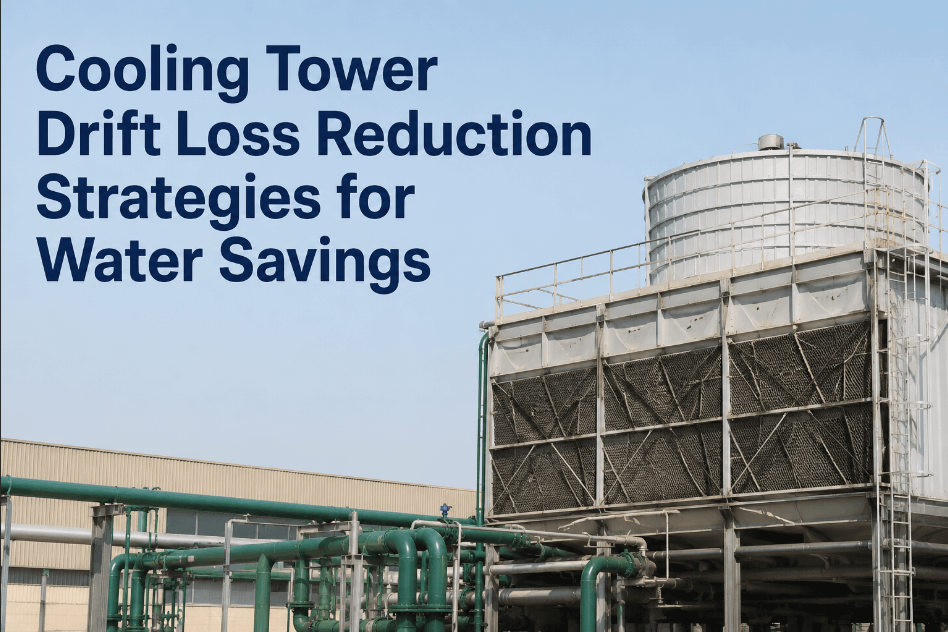
Degraded or missing drift eliminators can increase water loss by 5–10x over design rates. Inspection records for eliminator condition prevent silent drift losses that inflate consumption without warning.
Cycles of concentration management through controlled blowdown determines how much water is discharged per unit of evaporation. Optimized blowdown reduces waste while keeping chemistry in range.
Conductivity controllers regulate blowdown frequency based on dissolved solids. OxMaint tracks calibration and inspection records for controllers — preventing over-blowdown from controller drift.
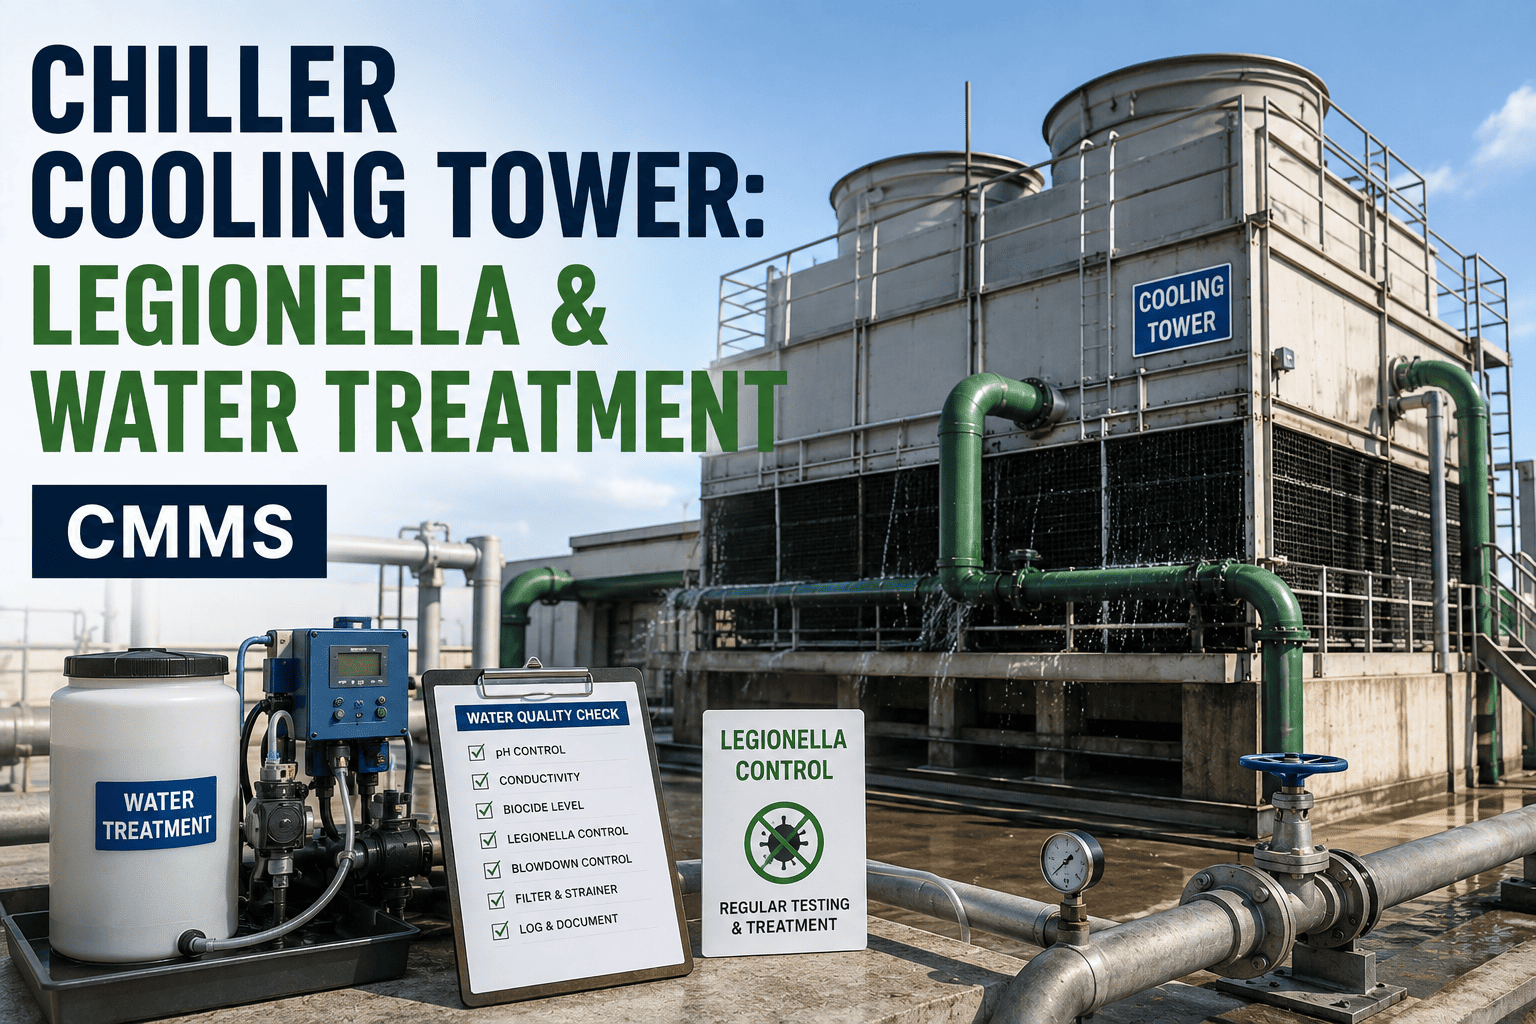
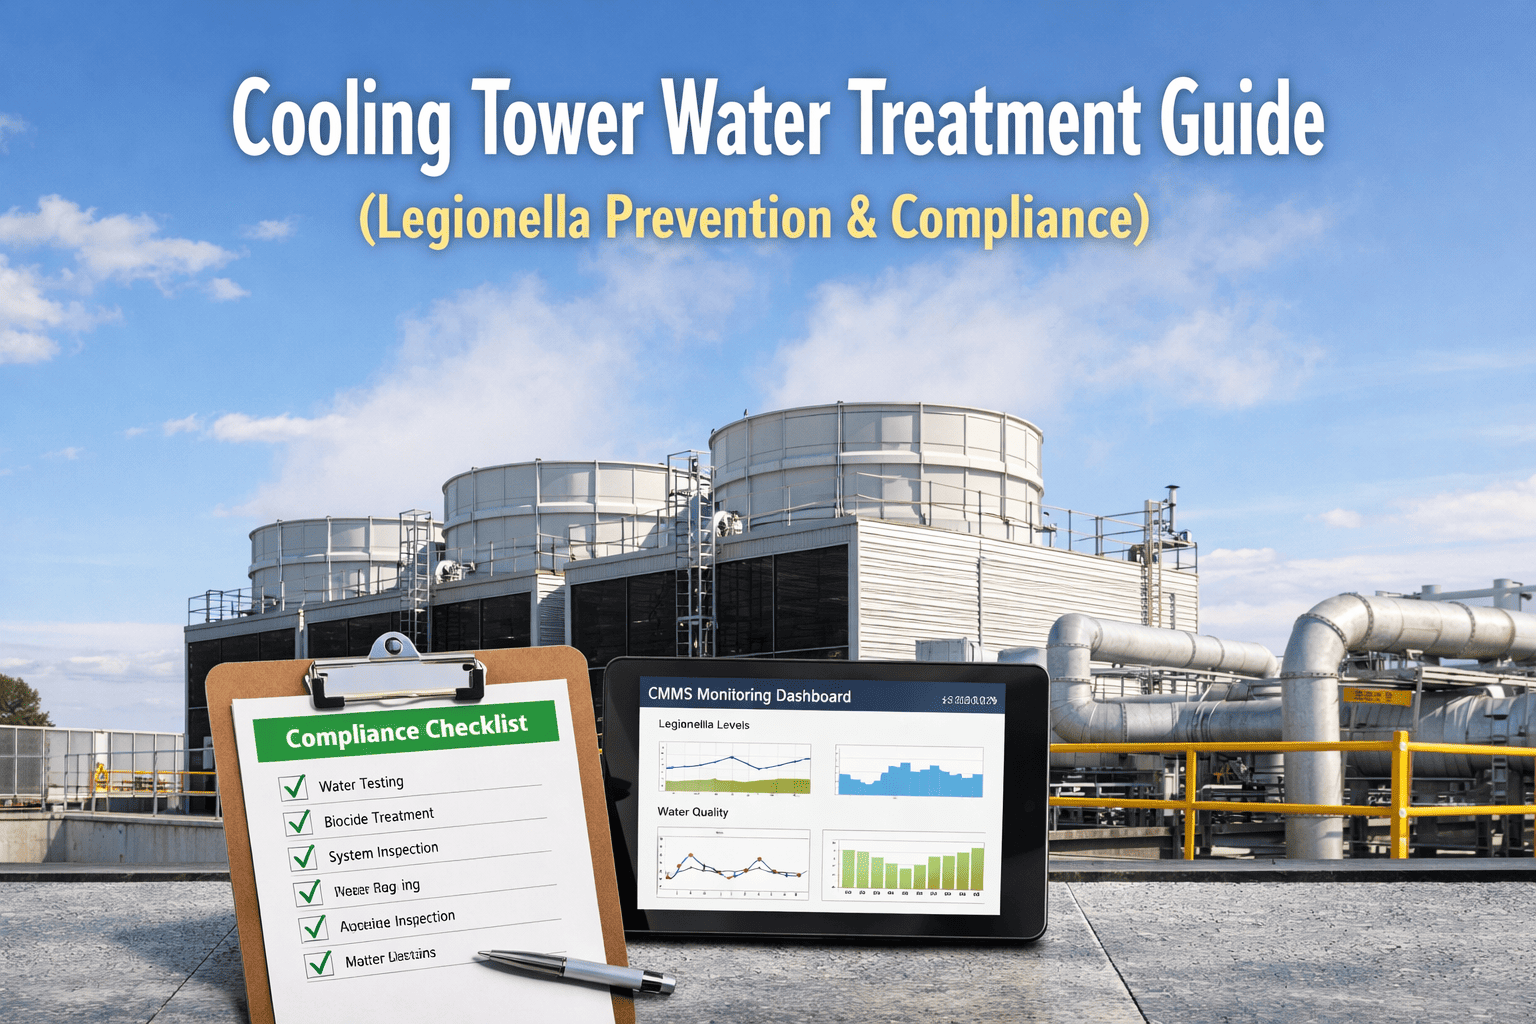
Water treatment dosing records tied to asset history allow teams to correlate treatment compliance with fouling events and consumption changes — closing the loop between chemistry and performance.
Basin cracks, nozzle wear, and distribution pan deterioration cause unmeasured losses. Scheduled inspection records in OxMaint track component condition over time and trigger PM before leaks develop.
Key Cooling Tower Water Consumption Metrics for Industrial Facilities
Cycles of concentration is the ratio of dissolved solids in circulating water versus makeup water — the single most direct indicator of blowdown efficiency. A facility operating at 3 COC when chemistry allows 5–6 COC is discharging two to three times more water than necessary. Increasing COC from 3 to 5 can reduce makeup water consumption by 15–20% with no capital investment — only chemistry management and conductivity controller calibration. OxMaint tracks conductivity controller inspection records and treatment logs that directly support COC optimization across tower assets. Facilities that Sign Up Free can tie treatment program records to each tower asset and track COC trends over time.
Makeup water replaces total losses from evaporation, drift, blowdown, and leaks. Tracking makeup flow against cooling load (gallons per ton-hour) establishes the consumption baseline that makes efficiency improvements measurable. Seasonal variation is expected — unexplained consumption increases during consistent load periods signal either leakage, drift deterioration, or excessive blowdown. OxMaint's asset records track inspection findings alongside consumption data, correlating maintenance actions with consumption changes in a single asset history. Teams that Book a Demo can see how PM history integrates with operational metrics per tower.
Drift is entrained water droplets carried out of the tower by airflow — representing both water loss and a Legionella risk vector. Modern drift eliminators achieve 0.0005–0.002% of circulating flow; deteriorated or absent eliminators can lose 10–50x that volume. Drift eliminator inspection is a scheduled PM task that most facilities defer too long — allowing progressive damage to compound both the water loss and the biological risk. OxMaint schedules drift eliminator inspections on condition-based triggers tied to runtime hours, generating work orders before degradation becomes a measurement problem.
Blowdown volume is a direct function of COC targets and evaporation rate. Tracking actual blowdown against theoretical optimal volumes identifies controller malfunction, manual override abuse, and chemistry program failures. Excessive blowdown wastes treated water and increases chemical costs; insufficient blowdown allows scaling and fouling that reduces heat transfer efficiency, indirectly increasing energy consumption. OxMaint logs blowdown valve inspection records, controller calibration history, and treatment chemistry application data — building the operational record needed to validate blowdown efficiency over time. Facilities can Sign Up Free and begin tracking treatment logs against asset records immediately.
Approach temperature — the difference between leaving water temperature and ambient wet bulb temperature — measures how efficiently the tower transfers heat. Rising approach temperature at constant load indicates fill fouling, scale buildup, or airflow restriction from fan or distribution issues. Degraded heat transfer forces chillers to operate at higher condensing temperatures, increasing energy consumption per ton of cooling delivered. OxMaint tracks fill inspection history, nozzle condition, and fan PM completion records — correlating maintenance activity with approach temperature trends to identify when cleaning or component replacement is warranted.
Unaccounted water loss is calculated as total makeup minus the sum of measured evaporation, blowdown, and drift. Persistent unaccounted loss above 5–10% of makeup indicates basin cracks, overflow line leaks, or distribution piping failures that physical inspection will confirm. OxMaint schedules basin and distribution system inspections on condition-triggered PMs, generating work orders when inspection intervals are due and logging findings against the tower asset record. Teams that Book a Demo can configure leak inspection templates specific to their tower configuration.
Cooling Tower Water Loss Breakdown: Industrial Facility Reference
| Loss Category | Typical % of Makeup | Primary Driver | OxMaint Inspection Record | Reduction Lever |
|---|---|---|---|---|
| Evaporation | 70–85% | Cooling load, wet bulb | Load-based baseline tracking | Optimize COC, load management |
| Blowdown | 10–20% | COC target, controller | Controller calibration logs | Raise COC, tune controller |
| Drift | 0.01–0.2% | Eliminator condition | Drift eliminator PM records | Inspect and replace eliminators |
| Unaccounted Leaks | Variable | Basin, piping, overflow | Basin inspection work orders | Scheduled physical inspection |
| System Losses | 1–5% | Filter backwash, side-stream | Side-stream PM records | Optimize backwash frequency |
How OxMaint Supports Industrial Cooling Tower Water Management
Water consumption metrics are only actionable when tied to maintenance history. OxMaint connects cooling tower asset records to inspection checklists, treatment logs, and condition-based PM schedules — giving facility teams the operational data to distinguish equipment degradation from process variation in consumption trends. When drift eliminator condition deteriorates or conductivity controller calibration drifts, OxMaint's PM records document the finding and track it through corrective action to closure. Facilities can Sign Up Free and connect their first cooling tower to OxMaint's condition-based inspection workflow today.
Cooling Tower Water Consumption Optimization: Implementation Steps
Build Cooling Tower Asset Records
Register each cooling tower in OxMaint with design parameters — circulation rate, design COC, drift eliminator type, and fill media specification — as the baseline for consumption tracking.
Define Inspection Checklists by Component
Create inspection templates for drift eliminators, basin condition, conductivity controllers, distribution nozzles, and fill media — capturing condition data that feeds consumption analysis.
Log Treatment Program Records
Record biocide, scale inhibitor, and corrosion inhibitor dosing against tower asset history — creating the chemistry log that supports COC optimization and fouling prevention.
Set Condition-Based PM Triggers
Configure OxMaint to generate drift eliminator, basin, and controller inspection work orders based on runtime hours — replacing fixed calendar schedules with condition-driven maintenance timing.
Track Consumption Metrics Against PM Records
Review makeup water consumption trends alongside inspection findings and treatment logs — correlating maintenance actions with consumption changes to identify high-impact intervention points.
Report and Benchmark Across Facilities
Use OxMaint's cross-asset reporting to benchmark water efficiency across multiple towers or sites — supporting sustainability targets and capital planning for tower rehabilitation. Book a Demo to see the reporting workflow.
Connect Cooling Tower Maintenance to Water Efficiency
OxMaint gives industrial facility teams the inspection records, treatment logs, and condition-based PM workflows to track and reduce cooling tower water consumption — without adding reporting overhead.
Frequently Asked Questions
What is the most impactful metric for cooling tower water efficiency?
Cycles of concentration is the primary efficiency lever — increasing COC from 3 to 5 typically reduces makeup water consumption by 15–20% with only chemistry management and controller calibration changes required.
How does OxMaint support cooling tower water management programs?
OxMaint tracks cooling tower asset records, inspection history, treatment logs, and condition-based PM schedules — giving teams the maintenance data that explains consumption trends and supports efficiency improvement.
How often should industrial cooling towers be inspected for water loss?
Drift eliminators and basin components should be inspected at least quarterly, with conductivity controller calibration checked monthly. OxMaint condition-based triggers can adjust these frequencies based on runtime and operational load.
What causes unexplained increases in cooling tower makeup water consumption?
Common causes include conductivity controller malfunction driving excessive blowdown, drift eliminator deterioration, basin or piping leaks, and fill fouling reducing heat transfer efficiency.
Can OxMaint track water treatment chemistry records alongside maintenance?
Yes. OxMaint records treatment dosing events against tower asset history — correlating chemistry program compliance with fouling incidents and consumption changes for operational analysis.
Start Tracking Cooling Tower Efficiency with OxMaint
Join industrial facility teams using OxMaint to connect cooling tower inspections, treatment records, and condition-based PM — turning water consumption data into actionable maintenance decisions.