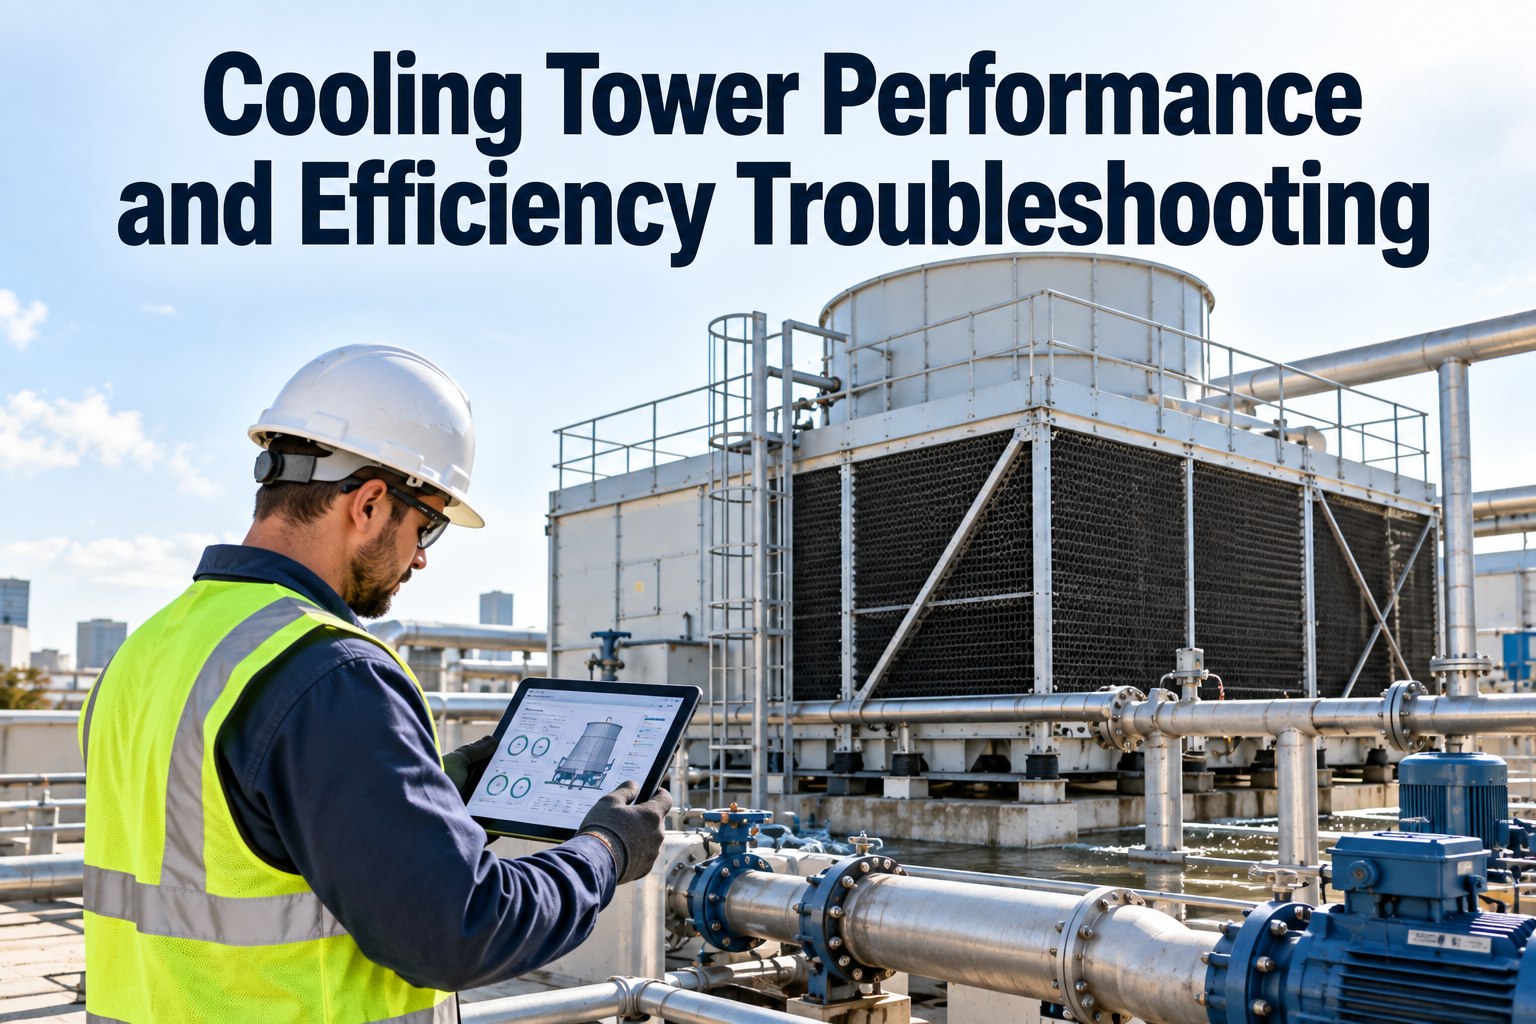
Cooling Tower Performance and Efficiency Troubleshooting

By William Jerry on September 30, 2026

cooling-tower-performance-efficiency-troubleshooting

A cooling tower rarely fails loudly — it fades. Long before anyone looks at the tower, its decline shows up downstream as rising chiller kW/ton and condensers staging early on a hot afternoon. By the time the plant is short on capacity, the tower has been underperforming for weeks. The reason it's so easy to miss is that a tower's health isn't a single gauge — it's the interplay of heat transfer, water distribution, and airflow, read through two numbers: approach and range. Get those two right and the diagnosis follows. OxMaint AI maintenance management software trends those numbers against every tower, so a slow drift becomes a work order before it becomes a capacity shortfall.

Facility Management · HVAC · Cooling Tower · Performance Troubleshooting · 2026

Troubleshoot the Tower Before the Chillers Pay for It

A cooling tower that can't reject heat pushes condenser water up, and every degree costs the chillers real energy. The trouble hides until peak load exposes it — but approach and range reveal it early, and the cause is always airflow, water distribution, fill, or scale. OxMaint AI trends both metrics per tower, links a rising approach to its likely cause, and raises the work order while there's still time to fix it cheaply.

1Read approach & range
→
2Isolate the cause
→
3Work order & fix
→
4Re-measure & confirm
< 5°F
approach to wet-bulb = tower performing well
> 7–8°F
approach signals a mechanical, fill, or distribution problem
1.5–2%
more chiller energy per 1°F rise in condenser water
20–40%
heat-transfer loss from a fouled fill pack

Read the Tower Through Two Numbers

You can't fix what you can't measure, and a tower's whole performance reduces to two temperatures you can read on any shift. Start free and log approach and range on every tower in OxMaint AI.

RANGE
hot water in − cold water out
How much heat the tower is actually removing. A falling range under the same load means the tower is losing capacity — the heat isn't leaving.
APPROACH
cold water out − wet-bulb temp
How close the tower gets to the theoretical limit set by the air. The single best health indicator — a rising approach is the first sign of trouble.
Cooling tower efficiency
Range ÷ (Range + Approach) × 100
A tighter approach — a lower number — means a more efficient tower. Track it against design, not against last week alone.

Why It Shows Up in the Chillers First

A struggling tower rarely trips an alarm — it quietly raises condenser water temperature, and the chillers absorb the penalty in energy and capacity. Book a demo to see tower-to-chiller performance links in OxMaint AI.

Approach rises
Cold water leaves the tower warmer than it should.
→
Condenser water climbs
Every 1°F adds roughly 1.5–2% to chiller energy.
→
Chiller kW/ton rises
The plant works harder for the same cooling.
→
Capacity runs short
Early staging on peak days — the shortfall finally shows.

The Tower Was Failing for Weeks. The Chiller Bill Told You Last.

A rising approach is measurable long before it becomes a capacity problem — but only if someone is trending it against design. OxMaint AI captures the reading each cycle, watches the trend per tower, and flags the drift as a work order while the fix is still a cleaning, not a shutdown.

The Four Places Performance Goes

When approach climbs above 7–8°F under design conditions, the cause is almost always one of four systems. Troubleshooting is a matter of ruling them out in order. Start free and track each cause against the tower in OxMaint AI.

Airflow
Fan motor failure, blade pitch misalignment, worn belts, or gearbox inefficiency — less air over the fill means less evaporative cooling.
Check: fan operation, blade pitch, belt tension, motor amps, gearbox
Water Distribution
Clogged or broken spray nozzles and uneven distribution leave dry patches on the fill, so water bypasses the air contact it needs.
Check: nozzle spray pattern, hot-water basin, distribution deck, debris
Fill & Water Contact
A fouled, biofouled, or collapsed fill pack can cut heat-transfer efficiency 20–40% — the single biggest performance loss.
Check: fill condition, fouling, biological growth, structural sag
Scale & Fouling
Scale and chemical imbalance coat heat-transfer surfaces and shrink the effective area, quietly raising the approach.
Check: water chemistry, scale on fill/surfaces, treatment program

Symptom → Likely Cause → Action

Read the pattern in the numbers and the field, and the probable cause narrows fast. This is the diagnostic path from symptom to fix. Book a demo to build this diagnostic flow into OxMaint AI.

SymptomLikely causeFirst action
Approach rising, range steadyAirflow or fill foulingCheck fan/belts, then inspect fill
Range falling under same loadReduced heat transferInspect fill and water distribution
Dry patches on the fillClogged/broken nozzlesClean or replace nozzles; check basin
Fan running, little airflowBlade pitch, belt, gearboxCheck pitch, tension, gearbox
Scale visible on surfacesWater-chemistry imbalanceReview treatment; descale as needed
Chiller kW/ton up, tower "looks fine"Gradual approach creepMeasure approach vs design

Compare every reading to the tower's design approach and its own history — a value that looks acceptable may still be a drift worth chasing. Start free and trend each tower against its design in OxMaint AI.

How OxMaint AI Runs Performance Troubleshooting

Troubleshooting a tower once is a task; catching the decline every time is a system. OxMaint AI turns the readings into a performance history that does the early warning for you. Start free and turn tower readings into a diagnostic history.

Approach & Range Logging
Both metrics captured against the specific tower each cycle — the diagnostic baseline builds itself.
Trend vs Design
Every reading compared to the tower's design approach, so a slow creep is visible long before peak load.
Drift Alerts
A rising approach triggers an alert and a work order while the fix is still a cleaning, not a capacity crisis.
Guided Cause Checklist
Airflow, distribution, fill, and scale checks built into the work order, so troubleshooting follows the same path each time.
Tower-to-Chiller View
Tower approach alongside chiller performance, so the plant-wide cost of a degrading tower is visible.
Full Performance History
Every reading, cause, and fix on one timeline — the record that turns troubleshooting into prevention.

Frequently Asked Questions

What are approach and range on a cooling tower?
Range is hot water in minus cold water out — the heat removed. Approach is cold water out minus wet-bulb temperature — how close the tower gets to its limit. Approach is the key health metric. Start free and track both in OxMaint AI.
What's a good approach temperature?
Within about 5°F of wet-bulb at design flow and load is healthy; above 7–8°F under design conditions points to a mechanical, fill, or distribution problem. Book a demo of approach trending.
Why does a bad tower raise chiller energy?
A weak tower pushes condenser water temperature up, and every 1°F rise adds roughly 1.5–2% to chiller energy — so tower decline shows in chiller kW/ton first. Sign up free and link tower to chiller performance.
What most commonly hurts tower performance?
Airflow faults, water-distribution problems, and fill fouling — a fouled fill pack alone can cut heat-transfer efficiency 20–40%. Book a demo of the cause checklist.
How does a CMMS help troubleshoot towers?
OxMaint AI logs approach and range per tower, trends them against design, alerts on drift, and guides the cause checklist — so decline is caught early and fixed cheaply. Start free and see it work.

Catch the Approach Before It Costs You the Chillers.

A cooling tower loses performance quietly and hands the bill to the chillers — but the warning is right there in the approach, weeks ahead, for a program that trends it against design. Read the two numbers, rule out the four causes, and act on the drift, and the tower keeps its capacity and the plant keeps its efficiency. OxMaint AI logs the readings, watches the trend, and raises the work order — so the first sign of decline is an alert, not a hot afternoon you can't cool.

Share This Story, Choose Your Platform!