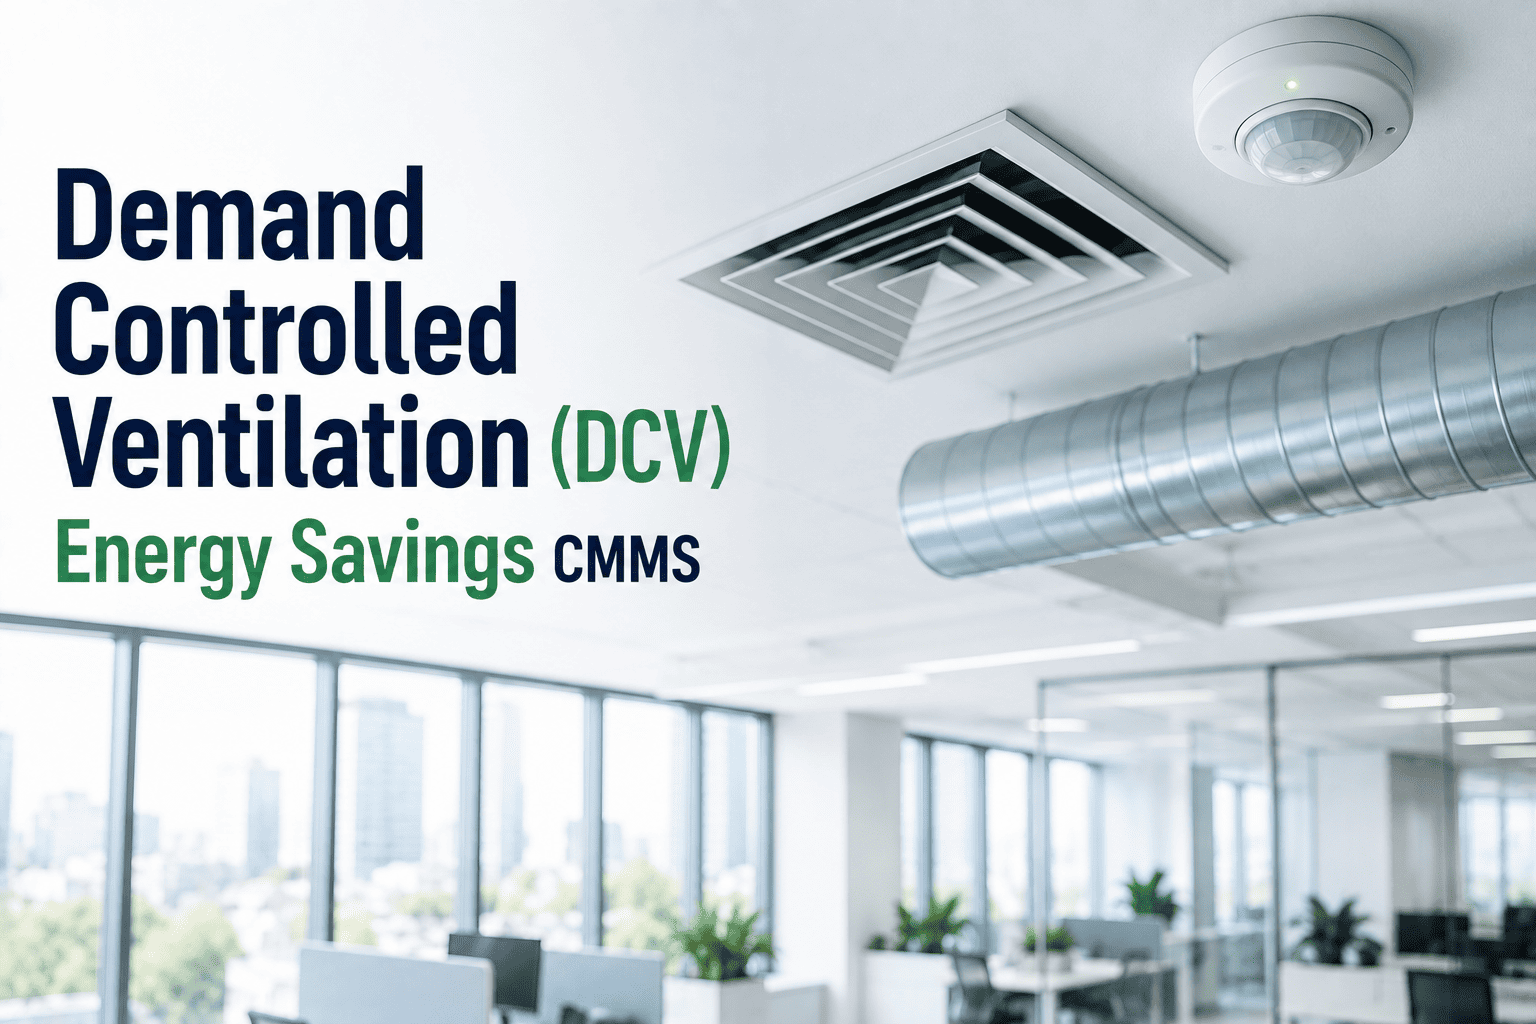
Demand-control ventilation promises significant airflow energy savings in commercial buildings—but the economics depend heavily on sensor cost, controls tuning, occupancy variability, and how well the system maintains indoor air quality across different space types. Facilities that adopt DCV without evaluating site-specific variables often invest in systems that underdeliver or create comfort complaints that erode stakeholder confidence. Sign Up Free with Oxmaint to connect your ventilation asset telemetry, track DCV system performance, and ensure your demand-control investment delivers its projected airflow savings through systematic maintenance and controls management. This guide helps facility managers, energy engineers, and HVAC planning teams evaluate whether demand-control ventilation makes economic sense for their commercial sites.
What Makes Demand-Control Ventilation Economics Work—and When It Fails to Deliver
DCV systems save energy by reducing outdoor air intake when occupancy sensors or CO2 concentrations confirm that full ventilation rates are not required. The savings are real—but they are conditional. In spaces with highly variable occupancy, DCV consistently outperforms fixed minimum ventilation. In low-occupancy or constantly occupied spaces, the sensor and controls investment may never recover its cost within a reasonable payback window. Book a Demo to see how Oxmaint's asset performance management platform tracks DCV system performance alongside maintenance history to validate savings projections across your commercial portfolio. Understanding where DCV earns its keep—and where it does not—requires honest analysis of four cost and benefit variables specific to each site.
Four Variables That Determine Whether DCV Economics Work for Your Commercial Site
Facilities that evaluate DCV only on potential airflow savings miss the total cost and performance picture. Sign Up Free to build ventilation asset performance profiles in Oxmaint and track DCV economics at the zone and system level, not just the energy meter level.
CO2 and occupancy sensor procurement, installation, commissioning, and ongoing calibration costs drive the upfront investment side of DCV economics. Sensor costs range widely by technology, coverage area, and integration complexity—and calibration drift over 3–5 years creates ongoing maintenance costs that must factor into total cost of ownership calculations for each zone type.
Actual airflow savings depend on how frequently a space operates below design occupancy and how large the spread is between minimum and design ventilation rates. Conference rooms, auditoriums, and multi-use lobbies deliver the strongest DCV returns. Private offices, server rooms, and continuously occupied production spaces offer minimal savings opportunity regardless of sensor investment.
Aggressive DCV setpoints that reduce ventilation too quickly in response to transient CO2 or occupancy signals create air quality complaints and occupant dissatisfaction. Comfort impact risk is highest in spaces with rapid occupancy changes, low ceiling heights, or poor air distribution. Control sequence design and sensor placement directly determine whether DCV improves or degrades occupant experience.
DCV systems require ongoing controls tuning as occupancy patterns shift, building use changes, and sensor calibration drifts. Facilities that treat DCV as a set-and-forget installation lose savings performance within 2–3 years. Structured controls review cycles, linked to CMMS work order schedules, are essential for sustaining DCV economics across the asset lifecycle.
DCV Economic Evaluation Framework: Key Metrics for Commercial Site Planning
Evaluating DCV investment requires a structured framework that captures both upfront costs and ongoing performance variables by space type. Facilities that rely on generic payback calculators without site-specific occupancy and controls data routinely over- or underestimate DCV returns. Book a Demo to see how Oxmaint integrates ventilation asset data with PM scheduling and controls analytics to support evidence-based DCV planning decisions.
| Evaluation Factor | High DCV Return Spaces | Low DCV Return Spaces | Key Metric to Track | Monitoring Approach |
|---|---|---|---|---|
| Occupancy Variability | Conference rooms, lobbies, retail | Private offices, server rooms | Average occupancy vs. design capacity | Occupancy sensor data logging |
| Ventilation Rate Spread | Spaces with large min-to-design gap | Spaces near minimum ventilation continuously | Actual vs. minimum airflow differential | VAV box position trending |
| Sensor Calibration Drift | All DCV zones after year 2–3 | N/A (all sensors drift) | CO2 sensor accuracy vs. reference | Periodic field calibration checks |
| Controls Tuning Decay | High-variability occupancy zones | Stable occupancy patterns | DCV response time vs. commissioning baseline | BAS sequence performance review |
| Comfort Complaint Rate | Dense, rapidly changing occupancy | Low-occupancy steady-state spaces | IAQ complaints per zone per quarter | Work order complaint tracking |
| Energy Rate Impact | High-rate climates with long heating/cooling seasons | Mild climates, low utility rates | Avoided ventilation conditioning cost per CFM | Sub-metered AHU energy trending |
DCV Performance Failure Patterns in Commercial Building Operations
Implementing DCV Performance Monitoring with CMMS and Condition-Based Maintenance
DCV systems that are not connected to a structured maintenance platform lose their economic performance silently—sensor drift, controls decay, and override accumulation erode savings over 2–4 years without visible fault codes. Linking DCV asset performance to calibration records, work orders, and controls review schedules in a CMMS transforms demand-control ventilation from a one-time installation into a sustained energy asset. Sign Up Free and connect your DCV system telemetry to Oxmaint's equipment health and work order management platform.
- Register every CO2 sensor, occupancy sensor, and DCV-controlled damper in Oxmaint as child assets under their AHU or zone system
- Document commissioning airflow baselines, design occupancy levels, and DCV setpoint configurations for each zone
- Link as-commissioned BAS sequence of operations to each DCV asset record for future controls verification
- Set CO2 and occupancy sensor drift alerts based on calibration interval and accuracy specifications
- Configure damper position vs. occupancy signal correlation rules to detect controls sequence failures
- Route DCV performance alerts to facility engineers with full sensor history and calibration records attached
- Generate automatic calibration work orders when sensor drift indicators or DCV performance metrics exceed defined thresholds
- Attach DCV savings trend data and zone performance scores to every calibration work order for technician context
- Update sensor calibration schedules dynamically based on observed drift rates rather than fixed annual intervals
- Monitor actual DCV airflow modulation rates by zone against commissioning baselines to detect savings erosion
- Measure energy cost avoidance from DCV operation against sensor and controls maintenance costs for ongoing ROI tracking
- Report DCV performance and payback progress to facility leadership and sustainability teams quarterly
DCV Economic Performance KPIs for Commercial Facility Operations
Tracking DCV economics over time requires indicators that connect sensor health and controls performance to actual ventilation energy savings, not just system uptime. Book a Demo to access Oxmaint's asset health dashboards and build DCV economic KPI tracking across your commercial facility portfolio.
Percentage of time DCV systems are actively modulating ventilation below design maximum. Declining modulation rates signal sensor drift, controls decay, or changed occupancy patterns reducing savings delivery.
Percentage of CO2 sensors calibrated within their defined interval. Low compliance predicts DCV logic operating on inaccurate data, undermining both energy savings and IAQ performance simultaneously.
Occupant comfort complaints attributable to under-ventilation in DCV-controlled zones. Each complaint indicates a controls tuning or sensor failure that requires investigation before savings optimization resumes.
Actual avoided ventilation conditioning costs versus pre-installation savings projection. Tracking this monthly identifies when DCV performance is eroding and justifies calibration or retuning investments.
Count of DCV zones with active manual overrides defeating demand-control logic. Unresolved overrides are the single most common cause of DCV savings loss in operating commercial buildings.
Cumulative savings against installation and maintenance cost investment. Payback tracking by zone identifies which DCV applications are delivering ROI and which require retuning or setpoint revision.