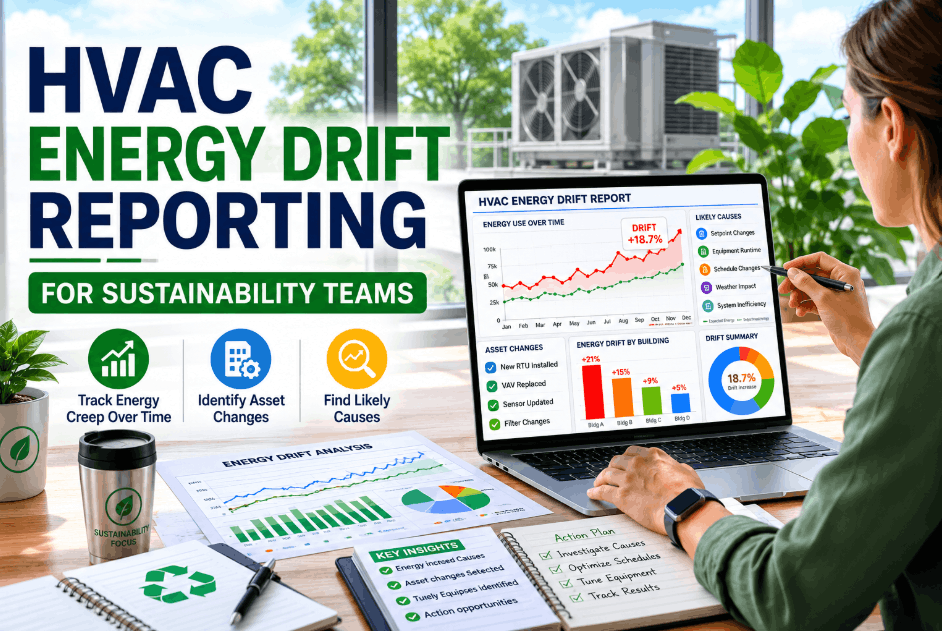
HVAC energy drift reporting gives sustainability teams the structured visibility they need to detect where energy consumption creeps upward over time, identify which assets changed behavior, and surface the likely operational cause — before the drift compounds into a material impact on carbon goals or utility budgets. Most facilities discover efficiency loss only when bills arrive or audits flag variance; Oxmaint AI changes that by continuously monitoring asset-level energy behavior and generating drift reports that sustainability managers can act on. Sign Up Free to connect your HVAC assets to Oxmaint and begin building a drift baseline your sustainability team can reference each reporting cycle. Book a Demo to see how Oxmaint surfaces energy drift across your building portfolio with connected sensor data and automated trend analysis.
Stop Discovering HVAC Energy Drift After It Already Costs You
Oxmaint AI monitors HVAC asset behavior continuously, generating drift reports that show sustainability teams where energy is creeping up, which assets changed, and what likely caused it — before variance hits your utility report.
Gap #1
No Continuous Drift Monitoring
HVAC energy changes are typically reviewed at billing intervals, leaving weeks or months of drift undetected between reporting cycles.
Gap #2
Asset-Level Changes Go Unlinked
When energy consumption shifts, sustainability teams rarely have a direct line to which specific asset changed behavior or when the change occurred.
Gap #3
Root Cause Not Documented
Drift reports without a likely cause attached give sustainability managers findings but no operational path to resolution or corrective action.
Gap #4
Reporting Data Scattered Across Systems
Energy data lives in BMS exports, utility portals, and spreadsheets — making it difficult to produce a clean drift trend report for management or auditors.
Gap #5
Seasonal Variance Not Separated
Without baseline-adjusted drift analysis, sustainability teams cannot separate expected seasonal consumption shifts from actual performance degradation.
Gap #6
Carbon Goal Impact Not Quantified
Energy drift is rarely translated into carbon impact in real time, leaving sustainability teams unable to assess how HVAC performance gaps affect scope targets.
01
HVAC Sensor Connection
Connect AHUs, chillers, VFDs, and RTUs to Oxmaint so energy and runtime data streams into each asset record automatically.
→
02
Baseline Energy Capture
Oxmaint builds a season-adjusted energy baseline per asset, capturing normal consumption patterns as a reference for drift detection.
→
03
Drift Detection and Attribution
When consumption deviates from baseline, Oxmaint flags the specific asset, the magnitude of drift, and probable operational causes from maintenance and runtime history.
→
04
Sustainability Reporting Output
Drift reports are generated with asset-level detail, trend timelines, and carbon impact estimates — ready for sustainability reviews and utility submissions.
Energy Data Layer
Continuous runtime and energy consumption logged per asset
Baseline-adjusted consumption trend tracked season over season
Deviation events timestamped with magnitude and duration
Asset Attribution
Drift linked to specific HVAC asset and location
Maintenance history cross-referenced with drift onset date
Operational changes flagged as likely contributing causes
Reporting Analytics
Period-over-period drift summary generated automatically
Seasonal variance separated from performance degradation
Carbon impact estimate calculated from energy drift volume
Sustainability Outcome
Drift detected early before it compounds into utility overages
Reports audit-ready with asset detail and cause attribution
Carbon goal tracking supported with real asset performance data
94%
Prediction accuracy reported by teams using Oxmaint AI on connected HVAC sensor data
62%
Reduction in unplanned energy overages among facilities using continuous drift monitoring
48hrs
Typical time from sensor connection to first energy drift dashboard in Oxmaint
1season
Time needed to establish a usable baseline for reliable HVAC drift detection
Standard Approach — Reactive Discovery
Energy drift discovered at billing or audit intervals, weeks after consumption has already shifted
No link between consumption changes and specific HVAC assets or operational events
Root cause analysis performed manually after the fact with incomplete maintenance records
Seasonal variance and actual performance degradation are reported as the same number
Carbon impact of HVAC drift not quantified until annual sustainability report cycle
Reporting relies on utility exports and manual spreadsheet consolidation
Oxmaint AI — Continuous Drift Reporting
Drift flagged continuously at the asset level as deviation occurs — Sign Up Free
Each drift event is attributed to a specific HVAC asset with onset timestamp
Maintenance and runtime history cross-referenced automatically for likely cause
Baseline-adjusted reporting separates seasonal shifts from real performance loss
Carbon impact estimated per drift event and rolled into sustainability reporting
Reports generated from connected sensor data — no manual consolidation required
These KPIs give sustainability managers measurable evidence of drift magnitude, asset contribution, and progress toward energy and carbon targets. Book a Demo to see Oxmaint track all six automatically.
KPI 01
Percentage difference between current consumption and the season-adjusted baseline per asset. The primary signal that drift is occurring and needs investigation.
Drift Magnitude
KPI 02
Time between when drift is first detected and when a corrective work order is generated. Shorter response time limits the energy volume lost before intervention.
Response Speed
KPI 03
Number of HVAC units currently deviating above acceptable consumption thresholds. Tracks the breadth of the drift problem across the portfolio at any point in time.
Portfolio Exposure
KPI 04
Split between consumption changes explained by seasonal conditions versus actual performance degradation. Keeps sustainability reporting accurate and defensible.
Reporting Accuracy
KPI 05
Cumulative carbon emissions attributable to HVAC energy drift within a reporting period. Directly supports scope reporting and sustainability goal tracking.
Carbon Accountability
KPI 06
Frequency of drift re-emerging on the same asset after corrective action. High recurrence signals an underlying mechanical or controls issue requiring deeper intervention.
Fix Durability
Commercial Real Estate
Property teams use Oxmaint to monitor HVAC energy drift across multi-building portfolios, generating reports that support ESG disclosures and utility benchmarking. Sign Up Free for your portfolio.
Healthcare
Healthcare sustainability teams use Oxmaint to track HVAC drift in climate-controlled areas where energy efficiency and air quality compliance are both at stake. Book a Demo for your facilities.
Retail
Retail operations teams use Oxmaint to catch energy drift early across distributed store locations, reducing utility variance before it appears in monthly cost reviews.
Manufacturing
Manufacturing sustainability managers use Oxmaint to separate production-driven HVAC load shifts from equipment degradation drift in energy reports submitted to corporate sustainability teams.
Give Your Sustainability Team HVAC Drift Reports That Actually Explain What Changed
Oxmaint AI connects to your HVAC assets and generates continuous drift reports with asset attribution, likely cause, and carbon impact — so sustainability teams can act on findings instead of just logging them. Book a Demo to see how.
It is the practice of continuously comparing HVAC energy consumption against a season-adjusted baseline to detect where consumption is creeping upward, which assets are responsible, and what likely caused the change.
Oxmaint connects to HVAC sensors and BMS controllers, builds a per-asset energy baseline, and flags deviations automatically with timestamp, magnitude, and probable cause from maintenance history.
Yes. Oxmaint applies season-adjusted baselines so sustainability teams can distinguish expected load changes from genuine performance degradation in their reports.
Yes. Carbon impact estimates are generated per drift event, supporting scope tracking and sustainability report submissions without manual calculation.
Most teams see their first HVAC energy drift dashboard within 48 hours of connecting sensors. A reliable drift baseline typically develops within one full season of data.
Start Tracking HVAC Energy Drift Before It Impacts Your Sustainability Goals
Oxmaint AI gives sustainability teams continuous drift visibility — with asset-level attribution, seasonal separation, and carbon impact reporting built in from day one.