HVAC Maintenance Cost per Asset Analysis for Multi-Site Facility Managers

By William Jerry on September 29, 2026

hvac-maintenance-cost-per-asset-analysis-for-maintenance-teams

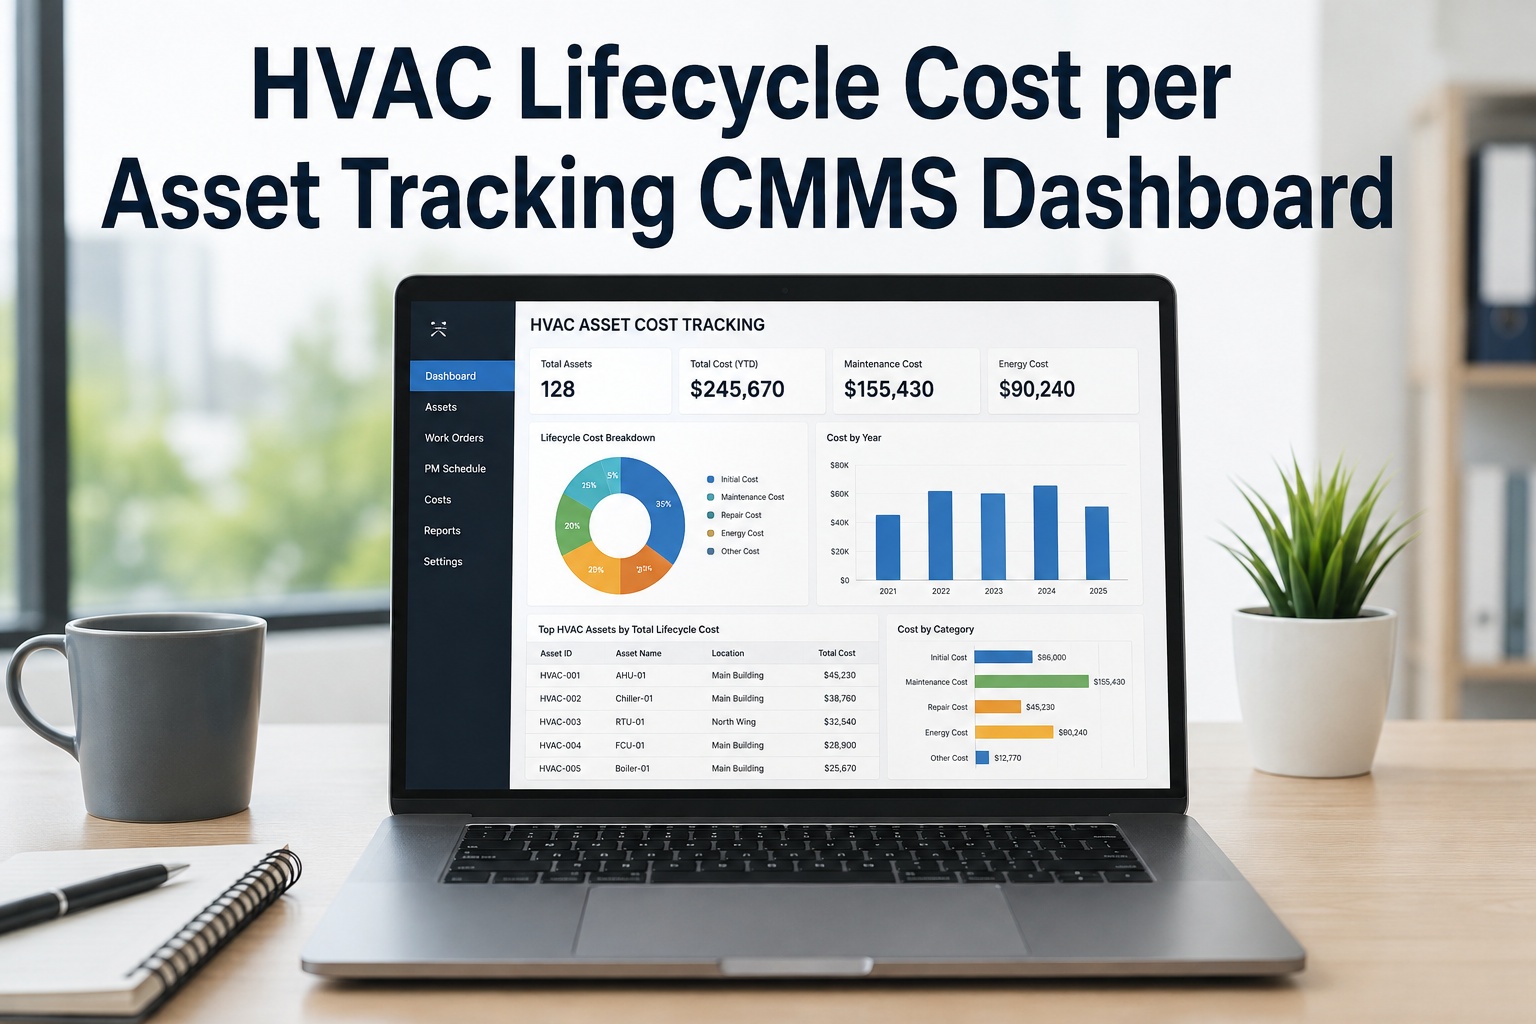
Across a portfolio of buildings, the HVAC line item is one big number — and that's the problem. It hides the rooftop unit quietly costing three times its neighbours, the chiller you keep repairing past the point where replacement would have paid off, and the sites where "we spent more on HVAC this year" has no explanation attached. Cost per asset is the metric that breaks the blur: total spend divided down to the individual unit, so you can see which assets earn their keep and which are draining the budget one emergency call at a time. OxMaint AI maintenance management software captures every labour hour, part, and work order against the specific unit — turning a portfolio total into a per-asset decision you can defend.

Facility Management · HVAC · Cost-per-Asset Analysis · 2026

Stop Budgeting HVAC by the Portfolio. Start Deciding by the Asset.

A single HVAC total across ten sites tells you what you spent, never where the money went or which unit to replace next. When every work order, part, and hour posts against the individual asset, cost per asset stops being an estimate and becomes the number that drives repair-versus-replace, budget defence, and PM planning. OxMaint AI tracks it automatically — one live figure per unit, built from the maintenance you're already doing.

1Log work to the unit
→
2Roll up cost per asset
→
3Flag the outliers
→
4Repair, replace or plan PM
40–70%
more that reactive emergency replacement costs vs. planned
50% rule
repair > half of replacement cost → replace wins
50–60%
of HVAC lifecycle cost is energy, not purchase price
$5–$8
emergency repair avoided per $1 of preventive maintenance

What "Cost per Asset" Actually Means

It's the full annual spend on one unit — not a site average — so a $28,000 rooftop unit and a $400,000 chiller are each judged on their own economics. Start free and build a per-asset cost record in OxMaint AI.

LABOUR
Technician hours on PMs, repairs, and callbacks — internal and contractor
+
PARTS
Filters, belts, compressors, refrigerant, controls components
+
CONTRACTS
Allocated share of the PM service agreement covering this unit
+
DOWNTIME
Emergency premiums and occupant impact when it fails
÷ asset= Cost per Asset

Why the Portfolio Total Hides the Money

One big HVAC number averages your best and worst assets together — and the average is where waste survives unnoticed. Book a demo to see per-asset cost roll-ups across sites in OxMaint AI.

The Outlier Disappears
A unit costing 3× its peers looks normal once blended into a site total. Per-asset cost pulls it back into view.
Repair Creep Goes Unseen
Small repairs on a dying unit never trigger a decision until they've quietly out-spent a replacement.
Budgets Can't Be Defended
"HVAC went up" isn't a capital case. "These six units drove 60% of the spend" is.
Sites Aren't Comparable
Without a per-unit basis, a 40-unit site and a 12-unit site can't be benchmarked against each other.

The 50% Rule: When Cost per Asset Says Replace

Cost per asset only pays off when it drives a decision. The clearest one is repair-versus-replace, and the industry rule of thumb is simple. Sign up free and track each unit against the 50% line in OxMaint AI.

< 50%
Repair — the unit still has better 10-year economics than a replacement
≥ 50%
Replace — when a single repair exceeds half the replacement cost, replacement almost always wins
The 50% rule compares a repair estimate against current replacement cost. A complete per-asset history is what makes that comparison honest — you can see whether this is the third repair this year or the first in five.

You Can't Manage the Number You Can't See.

The units bleeding the budget rarely announce themselves — they hide inside a portfolio total and a stack of one-off repair invoices. OxMaint AI posts every hour and part to the specific asset, so the cost per unit is always current and the outliers surface on their own.

Lifespan Is a Cost Lever — PM vs. Reactive

The same asset lasts years longer under planned maintenance than under run-to-failure, and every extra year spreads the purchase cost thinner. These are ASHRAE-referenced service-life bands. Book a demo to see how PM scheduling extends asset life in OxMaint AI.

EquipmentMedian lifeWith good PMReactive only
Rooftop units15–20 yrs20–25 yrs10–14 yrs
Chillers20–25 yrs25–30 yrs15–18 yrs
Boilers20–25 yrs28+ yrs14–18 yrs
Split systems12–15 yrs17–20 yrs8–11 yrs
Cooling towers20 yrs25+ yrs12–15 yrs

Maintenance Cost Benchmarks to Compare Against

Once you know your per-asset numbers, these commercial ranges tell you whether a unit sits inside normal or has become an outlier worth acting on. Start free and benchmark every asset against these ranges in OxMaint AI.

$0.15–$0.35
per sq ft / yr
Preventive maintenance contract
$18–$40
per ton / yr
Full PM contract, commercial
$180–$350
per RTU / quarter
Rooftop-unit full PM
$3.5K–$12K
per chiller / yr
Annual chiller service
$600–$2,500
per AHU
Coil cleaning
$500–$45K
per incident
Emergency / reactive repair

How OxMaint AI Runs Cost-per-Asset Analysis

The metric fails when spend is captured at the invoice, not the asset. OxMaint AI fixes that at the source — every action posts to the unit, so the number builds itself. Start free and turn maintenance activity into per-asset cost intelligence.

Cost Posted to the Asset
Every labour hour, part, and contractor invoice lands on the specific unit — no allocation guesswork.
Full Asset History
Every repair and PM on one timeline, so the 50% rule runs against real spend, not memory.
Multi-Site Roll-Up
Compare cost per asset across buildings and equipment classes from one dashboard.
Outlier Flags
Units running well above their peer benchmark surface automatically for a repair-or-replace review.
Automated PM Scheduling
Planned tasks raised on cadence to push each asset toward its longer PM-maintained service life.
Capital-Ready Reports
The per-asset evidence to defend a budget or justify a replacement, exported in minutes.

Frequently Asked Questions

How do you calculate HVAC cost per asset?
Sum the labour, parts, allocated PM contract, and downtime cost for one unit over a period, then divide by the asset — giving a per-unit figure instead of a site average. Start free and calculate it automatically in OxMaint AI.
What is the 50% rule for HVAC?
When a single repair estimate exceeds half the equipment's current replacement cost, replacement almost always delivers better 10-year economics. Book a demo of repair-vs-replace tracking.
Why track cost per asset instead of a total budget?
A portfolio total hides the outliers — the few units driving most of the spend. Per-asset cost reveals them, so you fix the right equipment and defend the budget with evidence. Sign up free and surface your outliers.
Does preventive maintenance actually lower cost per asset?
Over the asset's life, yes — PM extends service life well beyond reactive-only operation and avoids the emergency premiums that spike per-unit cost. Book a demo of PM scheduling.
How does a CMMS help with cost-per-asset analysis?
OxMaint AI posts every hour, part, and invoice to the specific unit, keeps its full history, and rolls costs up across sites — so the number is always current and audit-ready. Start free and see it per asset.

Turn a Portfolio Total Into a Per-Asset Decision.

The HVAC budget stops being a mystery the moment cost lives on the asset instead of the invoice. When every unit carries its own spend, its own history, and its own place against the benchmark, repair-versus-replace becomes obvious, PM planning becomes targeted, and the capital case writes itself. OxMaint AI captures it from the maintenance you already do — so the next budget review is a report, not a guess.
Share This Story, Choose Your Platform!