Most facility managers know their HVAC is underperforming — they just can't prove it in numbers that a CFO or ownership group will act on. MTTR sitting at 4.2 hours when world-class is 90 minutes, MTBF declining quarter-over-quarter while PM compliance is reported at 85%, energy costs rising but no asset-level attribution — these are the gaps that analytics dashboards close. Oxmaint's analytics dashboard and AI insights module tracks every HVAC maintenance KPI in real time — from technician wrench time to energy deviation per asset — turning maintenance data into the financial and operational evidence your leadership team needs to approve PM programs, capital replacements, and headcount decisions.
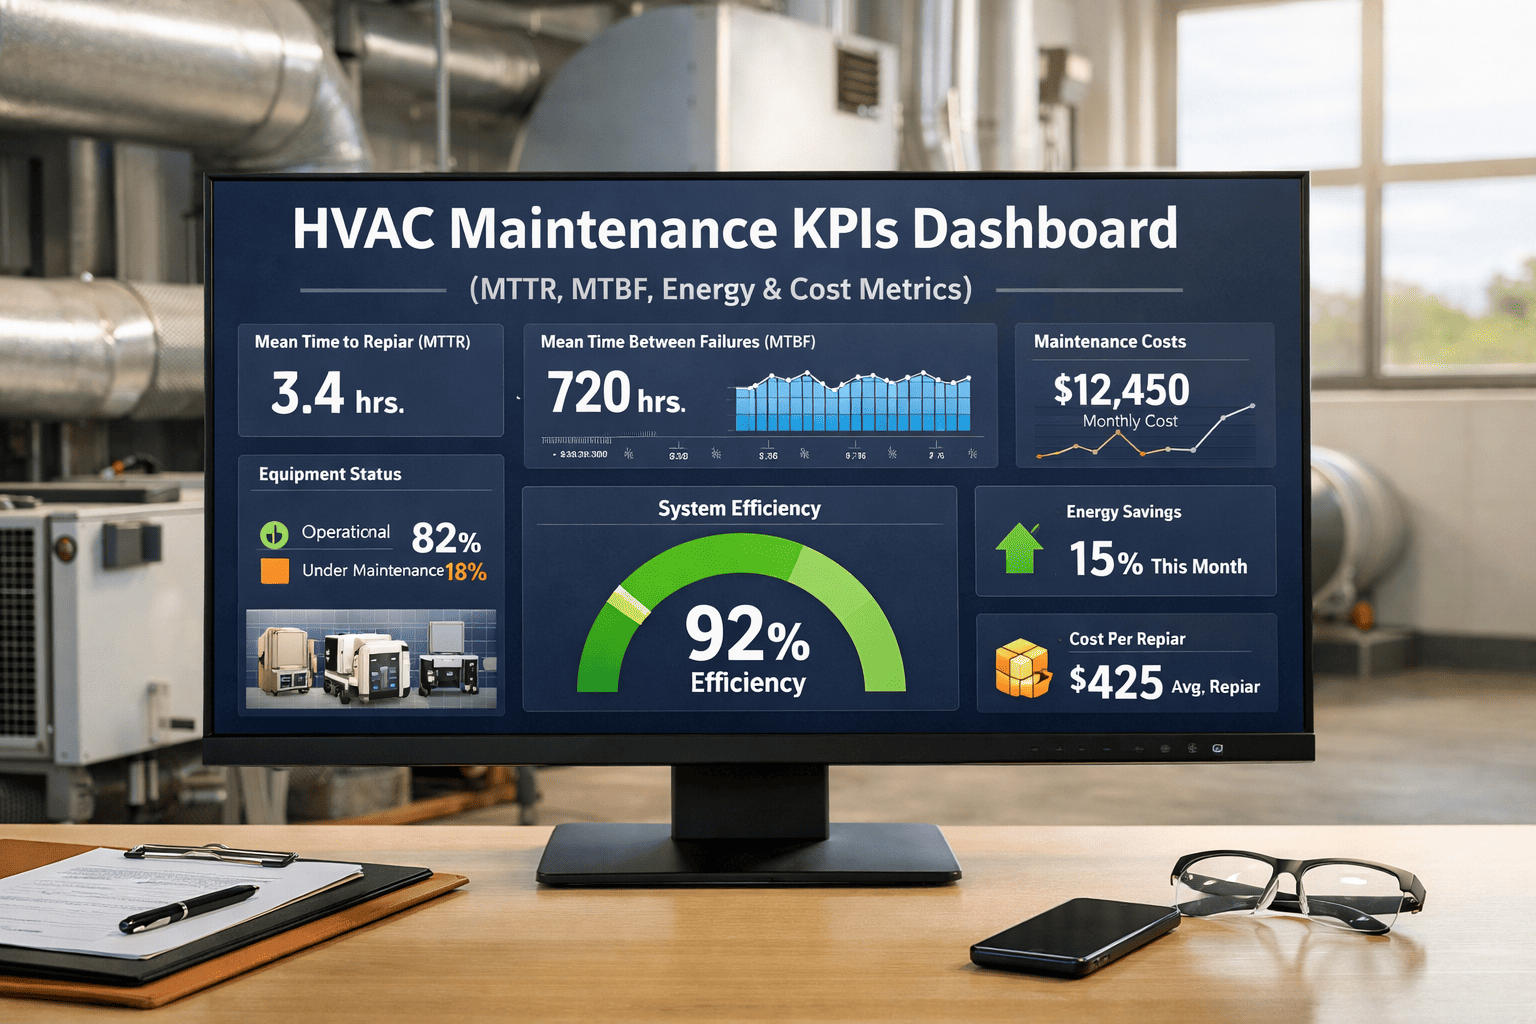
HVAC Maintenance KPIs Dashboard: MTTR, MTBF, Energy & Cost Metrics
The 8 KPIs that define world-class HVAC maintenance performance — with real-time dashboard visualization, AI-powered insights, and the benchmarks your team needs to move from lagging to leading indicators.
8 HVAC Maintenance KPIs — Definition, Formula & Benchmark
| KPI | Definition | Formula | Industry Avg | World-Class Target |
|---|---|---|---|---|
| MTTR (Mean Time to Repair) | Avg time from failure detection to system restoration | Total repair hours ÷ Number of failures | 3–6 hours | Under 90 min |
| MTBF (Mean Time Between Failures) | Avg time equipment operates before next failure | Total uptime ÷ Number of failures | 500–900 hrs | 1,200+ hours |
| PM Compliance Rate | % of scheduled PMs completed on time | (Completed on-time PMs ÷ Total scheduled PMs) × 100 | 65–75% | 95%+ |
| Reactive Work % | % of work orders that are unplanned reactive repairs | (Reactive WOs ÷ Total WOs) × 100 | 30–45% | Under 20% |
| Maintenance Cost Per Sq Ft | Total annual HVAC maintenance spend per square foot | Annual HVAC cost ÷ Total sq ft | $4.00–$6.00 | Under $3.50 |
| Energy Efficiency Index (EUI) | HVAC energy use per sq ft per year | Annual HVAC kBtu ÷ Building area (sq ft) | Varies by climate | ENERGY STAR top quartile |
| First-Time Fix Rate | % of work orders resolved in a single technician visit | (Single-visit repairs ÷ Total repairs) × 100 | 65–75% | 88%+ |
| Technician Wrench Time | % of shift time spent on actual maintenance work | Productive hours ÷ Total paid hours × 100 | 25–35% | 55–65% |
Your KPIs vs. World-Class Benchmarks
See Your HVAC KPIs Live — MTTR, MTBF, Energy, and Cost in a Single Dashboard
Oxmaint's analytics dashboard tracks all 8 maintenance KPIs in real time — from work order closure rates to energy deviation by asset. AI identifies which KPIs are trending toward failure and surfaces the specific maintenance actions that will move each metric toward benchmark.
What AI Identifies When KPIs Are Trending Wrong
The facilities that struggle most with HVAC KPI improvement are not the ones with the worst maintenance teams — they are the ones tracking the wrong metrics. PM completion rate is a lagging indicator that tells you what happened last month. What drives improvement is leading indicators: technician wrench time trending upward, first-time fix rate approaching 85%, reactive work percentage declining as PM compliance rises. When these leading indicators move, MTTR and MTBF follow within one to two quarters. The value of an analytics dashboard like Oxmaint's is not in the KPI display — it is in the AI insight layer that connects a declining MTBF on a specific chiller to the missed condenser service from 8 weeks ago. That causal link is what turns data into a maintenance decision, and maintenance decisions into ROI that a CFO understands.
HVAC Maintenance KPIs — Frequently Asked Questions
What is a good MTTR target for commercial HVAC systems?
How is HVAC maintenance cost per square foot calculated, and what is the benchmark?
What percentage of maintenance work should be planned vs. reactive?
How does Oxmaint's AI identify which KPI improvements will have the highest ROI?
Track Every HVAC Maintenance KPI — From Wrench Time to Energy Deviation — in One Live Dashboard
Oxmaint gives your facility operations leadership the MTTR, MTBF, PM compliance, reactive work ratio, and cost-per-asset data they need to make informed maintenance investment decisions — with AI surfacing the causal insights that explain why each KPI is trending the way it is and what to do about it.