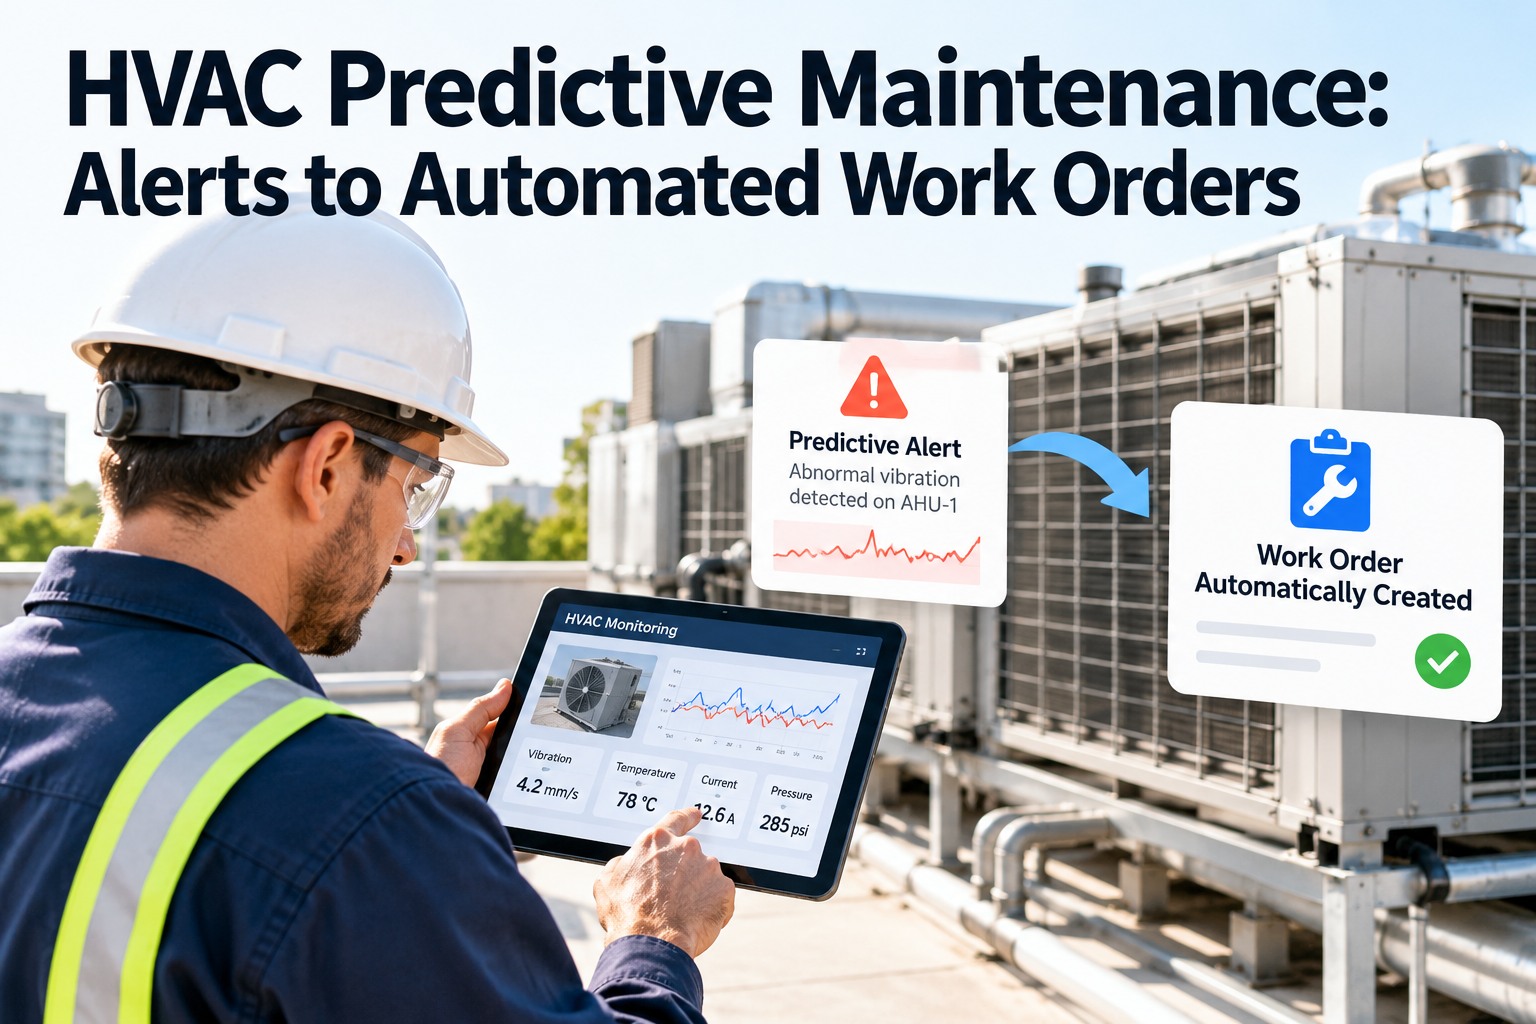
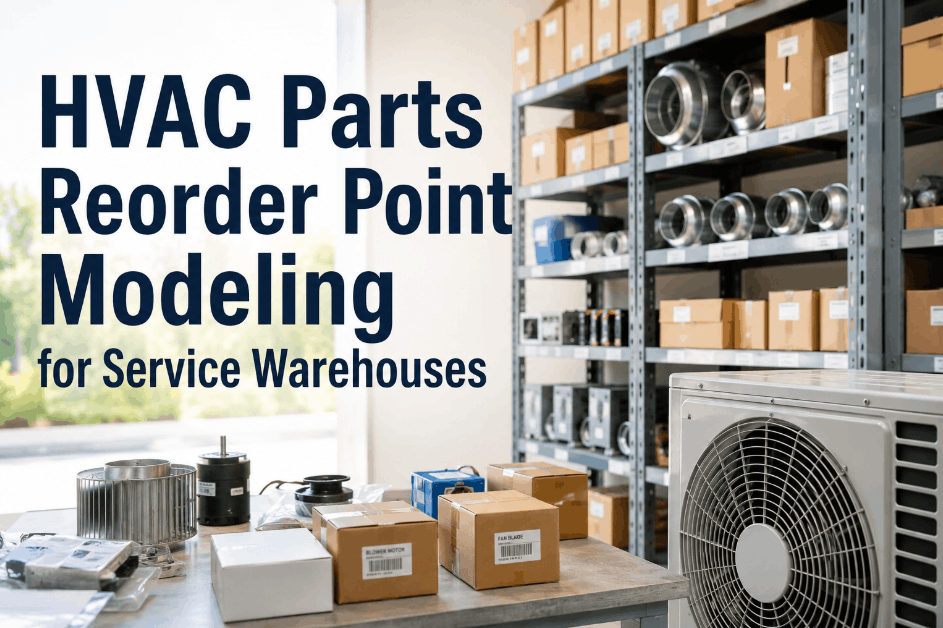
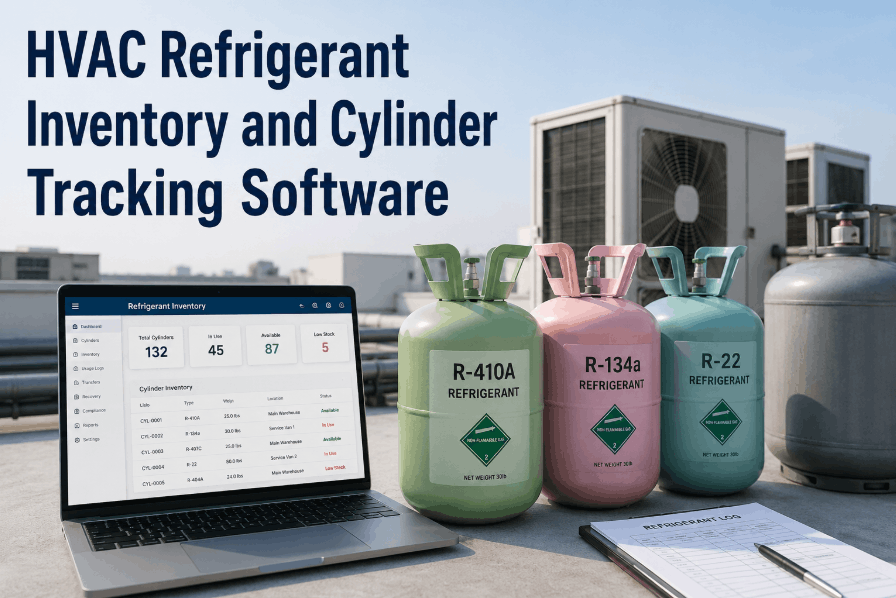
Most HVAC service organizations manage parts inventory the same way they did twenty years ago—someone walks through the warehouse, eyeballs the shelves, and writes down what looks low. Or worse, a technician arrives at a job site, discovers the compressor or contactor they need isn't on the truck or in the warehouse, and the customer waits 2–5 days for an emergency parts order while their system sits broken. This reactive approach to parts management creates a cascade of hidden costs that most HVAC companies never quantify: emergency overnight shipping premiums that add 40–80% to part costs, lost revenue from jobs that can't be completed on the first visit, technician downtime waiting for parts instead of generating billable hours, customer dissatisfaction that drives callbacks and contract cancellations, and inventory carrying costs from overstocking parts "just in case" that sit on shelves for years and eventually become obsolete. The root cause is simple: without data-driven reorder points and automated purchasing, you're guessing. You're guessing how much of each part you'll need, guessing when to order, and guessing how many to keep on hand. Usage-based reorder points eliminate the guessing by calculating exactly when each part should be reordered based on actual consumption rates, lead times, and service demand patterns. Automatic purchasing takes it further—triggering purchase orders the moment inventory drops below the calculated threshold, routing approvals electronically, and confirming delivery before the stockout ever happens. The result is a parts operation that runs itself: the right parts are always available, emergency orders drop by 70–85%, first-time fix rates climb above 90%, and inventory investment drops 15–30% because you're stocking what you actually use instead of what someone guessed you might need.
Stop Guessing. Start Calculating.
Every Stockout Is a Broken Promise. Every Emergency Order Is Profit Lost.
70–85%
Reduction in emergency parts orders
90%+
First-time fix rate with optimized inventory
15–30%
Inventory carrying cost reduction
$0
Revenue lost to parts-related delays
The True Cost of Running Out of Parts
A single parts stockout seems minor—a $35 contactor or a $120 capacitor that isn't in stock. But the downstream costs cascade far beyond the price of the part itself. Every stockout triggers a chain reaction of expenses that most HVAC companies never connect back to the missing part. Facilities that sign up to manage their HVAC parts and maintenance on a centralized platform gain the usage visibility that makes intelligent reorder points possible.
$35 contactor
not in stock
→
$28
Emergency shipping premium
+
$180
Return trip labor & vehicle
+
$350
Lost billable time (tech waiting)
+
$500+
Customer dissatisfaction risk
True cost
$1,093+
31x the part price
$420 compressor
not in stock
→
$165
Emergency overnight freight
+
$360
Rescheduled visit (labor × 2)
+
$700
Lost revenue (delayed completion)
+
$2,000+
Contract cancellation risk
True cost
$3,645+
8.7x the part price
How Usage-Based Reorder Points Work
A reorder point is the inventory level at which a new purchase order should be placed to ensure the part arrives before stock runs out. The math isn't complicated—but it requires data that most HVAC companies don't track: actual usage rates, supplier lead times, and demand variability. When these data points are captured systematically, reorder points calculate themselves.
The Automatic Purchasing Workflow
Calculated reorder points are only valuable if they trigger action without human intervention. Automatic purchasing closes the loop—converting an inventory threshold crossing into a purchase order, routing it through approval, sending it to the supplier, and tracking delivery, all without anyone checking a clipboard or walking the warehouse.
1
Inventory Drops Below Reorder Point
Technician completes a work order consuming a 40µF capacitor. System updates inventory in real time. Stock level hits 13 units — the calculated reorder point. The trigger fires automatically.
Automation: Real-time inventory tracking linked to work order parts consumption — no manual counts required
2
Purchase Order Auto-Generated
System generates a PO with the calculated Economic Order Quantity — the order size that minimizes combined ordering and carrying costs. Pre-populated with preferred supplier, negotiated pricing, delivery address, and required-by date based on projected consumption.
Automation: PO created with all fields populated — supplier, quantity, price, delivery terms — in seconds, not hours
3
Approval Routing & Dispatch
POs below a defined threshold (e.g., $500) are auto-approved and sent to the supplier immediately. POs above the threshold route to the designated approver's mobile device for one-tap authorization. Approved POs transmit electronically to the supplier.
Automation: Configurable approval thresholds eliminate bottlenecks — routine orders process without human delay
4
Delivery Tracking & Receipt
System tracks order status from supplier confirmation through shipment to delivery. Receiving confirmation updates inventory levels automatically. If delivery is delayed beyond the expected date, an escalation alert notifies procurement to take corrective action before a stockout occurs.
Automation: Delivery exceptions flagged proactively — the system alerts you to problems, not the empty shelf
5
Continuous Recalculation
Reorder points are not static. The system continuously recalculates based on rolling usage data, seasonal patterns, and lead time changes. A part that averaged 2.4/day last quarter but is trending to 3.8/day this month gets its reorder point automatically adjusted upward before the old calculation causes a stockout.
Automation: Dynamic reorder points that adapt to changing demand — always optimized, never stale
Parts Available. Trucks Stocked. First Visit Fixed.
OxMaint connects work order parts consumption to inventory management — every part used on every job automatically updates stock levels, triggers reorder points, and generates purchase orders. No clipboards. No guessing. No stockouts.
The Seven Categories of HVAC Parts and Their Reorder Strategies
Not all HVAC parts should be managed the same way. High-volume consumables need different reorder strategies than slow-moving specialty components. Categorizing your inventory and applying the right strategy to each category maximizes availability while minimizing investment.
Examples: Contactors, capacitors, relays, fuses, circuit breakers, transformers
Strategy: Automatic reorder with dynamic safety stock. These parts have high, predictable consumption and short lead times. Set aggressive reorder points with modest safety stock. Auto-approve POs under $300.
Typical usage: 50–200 units/month | Lead time: 1–3 days | Reorder frequency: weekly
Examples: R-410A, R-22, R-407C, brazing alloys, nitrogen, vacuum pump oil, refrigerant oil
Strategy: Weight/volume-based reorder with seasonal adjustment. Refrigerant consumption spikes 3–5x in cooling season. Reorder points must shift seasonally — pre-season bulk purchasing at negotiated pricing with automatic top-up orders during peak.
Typical usage: 200–800 lbs/month | Lead time: 2–5 days | Reorder frequency: bi-weekly to monthly
Examples: Condenser fan motors, blower motors, inducer motors, fan blades, motor mounts, bearings
Strategy: Standard reorder point with moderate safety stock. Moderate consumption with some variability. Stock the most common sizes/voltages; use next-day supply for uncommon configurations. Cross-reference compatibility to reduce SKU count.
Typical usage: 15–60 units/month | Lead time: 2–5 days | Reorder frequency: bi-weekly
Examples: Thermostats, pressure switches, defrost controls, expansion valves, solenoid valves, zone damper actuators
Strategy: Reorder point with vendor-managed inventory option. High SKU variety but predictable per-model usage. Negotiate consignment arrangements with distributors for broad coverage without carrying cost. Automatic reorder on the top 20 highest-usage SKUs.
Typical usage: 10–40 units/month | Lead time: 1–5 days | Reorder frequency: bi-weekly to monthly
Examples: Scroll compressors (residential/light commercial), reciprocating compressors, compressor kits
Strategy: Min/max with distributor partnership. Low consumption but high cost per unit and long lead times for OEM-specific models. Stock 1–2 units of the most common tonnages. Establish guaranteed next-day availability agreements with distributors for all other models.
Typical usage: 5–20 units/month | Lead time: 1–15 days (model dependent) | Reorder frequency: as consumed
Examples: Evaporator coils, condenser coils, heat exchangers, coil assemblies
Strategy: Order-on-demand with lead time buffer. Too many configurations to stock. Use historical data to identify the 3–5 most commonly replaced coil models and stock one of each. All others ordered when the job is diagnosed, with installation scheduled around the delivery timeline.
Typical usage: 3–12 units/month | Lead time: 5–30 days | Reorder frequency: per-job
Examples: Air filters (all sizes), V-belts, PM kits, UV bulbs, drain pan tablets, coil cleaner
Strategy: Scheduled bulk purchasing aligned to PM contract cycles. Consumption is highly predictable from maintenance contract schedules. Calculate exact quantities needed for the upcoming PM cycle and order in bulk at volume pricing. Automatic reorder for ad-hoc usage between PM cycles.
Typical usage: 100–500 units/month | Lead time: 2–7 days | Reorder frequency: quarterly bulk + weekly top-up
Truck Stock Optimization: The Last Mile of Parts Availability
Warehouse reorder points solve the supply problem—but the availability problem is on the service truck. A part sitting in the warehouse doesn't help the technician standing in front of a broken system. Truck stock optimization extends reorder point logic to each service vehicle based on that technician's territory, specialization, and historical job mix.
Before: One-Size-Fits-All
Every truck carries the same standard parts list
Parts selected based on manager's experience
No connection between truck stock and territory demand
Tech returns to warehouse 3–5 times per week for missing parts
First-time fix rate: 65–75%
$3,000–$5,000 in slow-moving truck inventory per vehicle
After: Usage-Optimized
Each truck's stock list customized to territory equipment mix
Parts selected based on actual job history and equipment age data
Truck reorder points trigger warehouse pull-and-stage before morning departure
Warehouse returns drop to 0–1 times per week
First-time fix rate: 88–95%
15–25% less truck inventory carrying higher-value, faster-moving parts
ROI: Automated Parts Management for HVAC Operations
$285K
Eliminated Emergency Order Premiums
70–85% reduction in emergency orders × $40–80 average premium per order × 5,000+ orders/year
$220K
Increased First-Visit Completion Revenue
15–20% improvement in first-time fix rate × additional billable hours recovered per technician per week
$125K
Inventory Carrying Cost Reduction
15–30% reduction in total inventory value through usage-based stocking and dead stock elimination
$95K
Procurement Labor Savings
Automated PO generation eliminates 15–25 hours/week of manual ordering, calling suppliers, and tracking deliveries
$65K
Customer Retention Improvement
Reduced contract cancellations from improved first-visit resolution and faster overall repair completion
Expert Perspective: Automating HVAC Parts Purchasing
"
We used to have two full-time people whose entire job was managing parts — counting inventory, calling suppliers, placing orders, tracking shipments, and restocking trucks. We still ran out of parts constantly. Technicians were making 150+ warehouse trips per month for parts they should have had on their trucks. Our first-time fix rate was 71%, which meant almost one in three jobs required a return visit. When we implemented usage-based reorder points with automatic purchasing, the results were dramatic. Emergency orders dropped 78% in the first quarter. First-time fix rates went from 71% to 92%. We reassigned one of the two procurement people to a higher-value role. But the biggest surprise was the inventory reduction — we cut our total parts investment by 22% while simultaneously increasing availability. We were carrying $180,000 in parts we rarely used and running out of $30 parts we used every day. The data made the problem obvious, and automated reorder points fixed it without anyone having to think about it. The system just works — parts show up before we need them, purchase orders process themselves, and technicians fix things on the first visit.
Start with your top 50 parts by usage volume — they'll cover 80% of your stockouts
Link parts consumption to work orders — you can't calculate reorder points without actual usage data
Optimize truck stock per-technician — generic truck lists are why technicians make warehouse runs
Let seasonal data adjust reorder points automatically — summer and winter demand are different worlds
Automated parts reorder points and purchasing transform HVAC parts management from a labor-intensive, error-prone guessing game into a self-running system that ensures parts availability while reducing total inventory investment. If you're ready to stop running out of the parts your technicians need most, book a free demo to see how work-order-driven inventory management works in practice.
The Right Part. The Right Truck. The Right Time. Every Time.
OxMaint connects every work order to every part consumed — building the usage intelligence that drives automatic reorder points, auto-generated purchase orders, and truck stock optimization. Fix it on the first visit, every visit.
Frequently Asked Questions
How much historical data do we need before reorder points are accurate?
Meaningful reorder points can be established with as little as 60–90 days of parts usage data captured through work orders. This provides enough consumption history to calculate average daily usage and identify the highest-volume parts. However, reorder points become significantly more accurate after 12 months of data because seasonal patterns emerge — summer cooling demand, winter heating demand, and the spring/fall PM cycles create usage patterns that repeat annually. For companies just starting to track parts usage, the recommended approach is to begin with simple min/max levels based on team experience for the first 90 days while the system accumulates data, then transition to calculated reorder points once the usage history is sufficient. The system continuously refines reorder points as more data accumulates, so accuracy improves automatically over time. Within 18–24 months, the system typically has enough data to predict seasonal demand shifts and adjust reorder points proactively before the demand change occurs.
How do automatic reorder points handle seasonal demand spikes?
Seasonal adjustment is one of the most valuable capabilities of data-driven reorder points. The system analyzes historical usage patterns to identify seasonal demand curves for each part category. For example, run capacitor usage might average 2.4/day annually but follow a seasonal pattern: 1.2/day in winter, 2.0/day in spring, 4.8/day in peak summer, and 1.6/day in fall. The reorder point shifts automatically to match: lower in winter (reducing carrying costs on seasonal parts) and higher in summer (ensuring availability during peak demand). Safety stock also adjusts seasonally — summer safety stock is larger because demand variability increases during extreme heat events. The most sophisticated implementations also incorporate weather forecast integration, adjusting reorder points upward when extended heat waves or cold snaps are predicted. Pre-season bulk ordering can be triggered automatically 4–6 weeks before the historical start of peak season to take advantage of volume pricing and avoid the supply constraints that affect the entire industry during peak periods.
Can automatic purchasing work with multiple suppliers and negotiate best pricing?
Yes — modern automatic purchasing systems support multi-supplier management with several pricing optimization strategies. Each part can have a primary supplier (best price), secondary supplier (backup availability), and emergency supplier (fastest delivery). Automatic POs route to the primary supplier under normal conditions and automatically fail over to the secondary if the primary can't meet the required delivery date. Price comparison features can evaluate quotes across suppliers at the time of PO generation and route to the lowest-cost option that meets the delivery timeline. Volume-based pricing tiers are supported — the system can consolidate multiple small orders into fewer, larger orders that hit volume price breaks. Contract pricing is stored and automatically applied to POs, with alerts when negotiated pricing expires. Some systems also support supplier scorecarding that tracks on-time delivery, quality, and pricing accuracy, automatically adjusting supplier priority based on performance. The net effect is procurement optimization that a manual process could never achieve because the system evaluates every purchase against multiple criteria simultaneously.
How do we handle parts that are used rarely but are critical when needed?
Critical low-usage parts — sometimes called "insurance stock" — require a different management strategy than high-volume consumables. Standard reorder point calculations don't work well for parts used 1–5 times per year because the usage data is too sparse for reliable statistical calculation. The recommended approach is a min/max strategy with criticality-weighted safety stock. For each critical low-usage part, set a minimum stock level of 1 unit (or 2 for parts with lead times exceeding 5 days), a maximum of 2–3 units, and a reorder trigger when stock hits the minimum. The key decision factor is the criticality multiplier: what is the cost of not having this part when it's needed? For a $200 circuit board that's the only part that can restore a 100-ton chiller serving a hospital, the cost of a stockout (emergency freight, extended downtime, customer impact) far exceeds the carrying cost of keeping one unit on the shelf. A formal criticality classification — with factors for customer impact, equipment criticality, lead time, and substitutability — provides a systematic framework for these stocking decisions rather than relying on individual judgment.
What is the typical implementation timeline for automated parts purchasing?
Full implementation of automated reorder points and purchasing typically takes 8–16 weeks, following a phased approach. Weeks 1–3: Parts master data setup — cataloging all parts with descriptions, supplier information, current pricing, lead times, and storage locations. This is the most labor-intensive phase if the company doesn't already have a digital parts catalog. Weeks 4–6: Historical usage import and reorder point calculation — importing available usage history (from work orders, purchase records, or supplier reports) and calculating initial reorder points for the top 50–100 highest-volume parts. Weeks 7–10: Workflow configuration — setting up automatic PO generation rules, approval routing, supplier electronic ordering integration, and receiving processes. Weeks 11–14: Pilot operation — running the automated system alongside the existing manual process for the top 50 parts, validating reorder points, and refining thresholds. Weeks 15–16: Full deployment — expanding to all parts and deactivating the manual process. Many companies see measurable results (reduced stockouts, fewer emergency orders) within the first 30 days of the pilot phase because even imperfect reorder points outperform manual guessing.