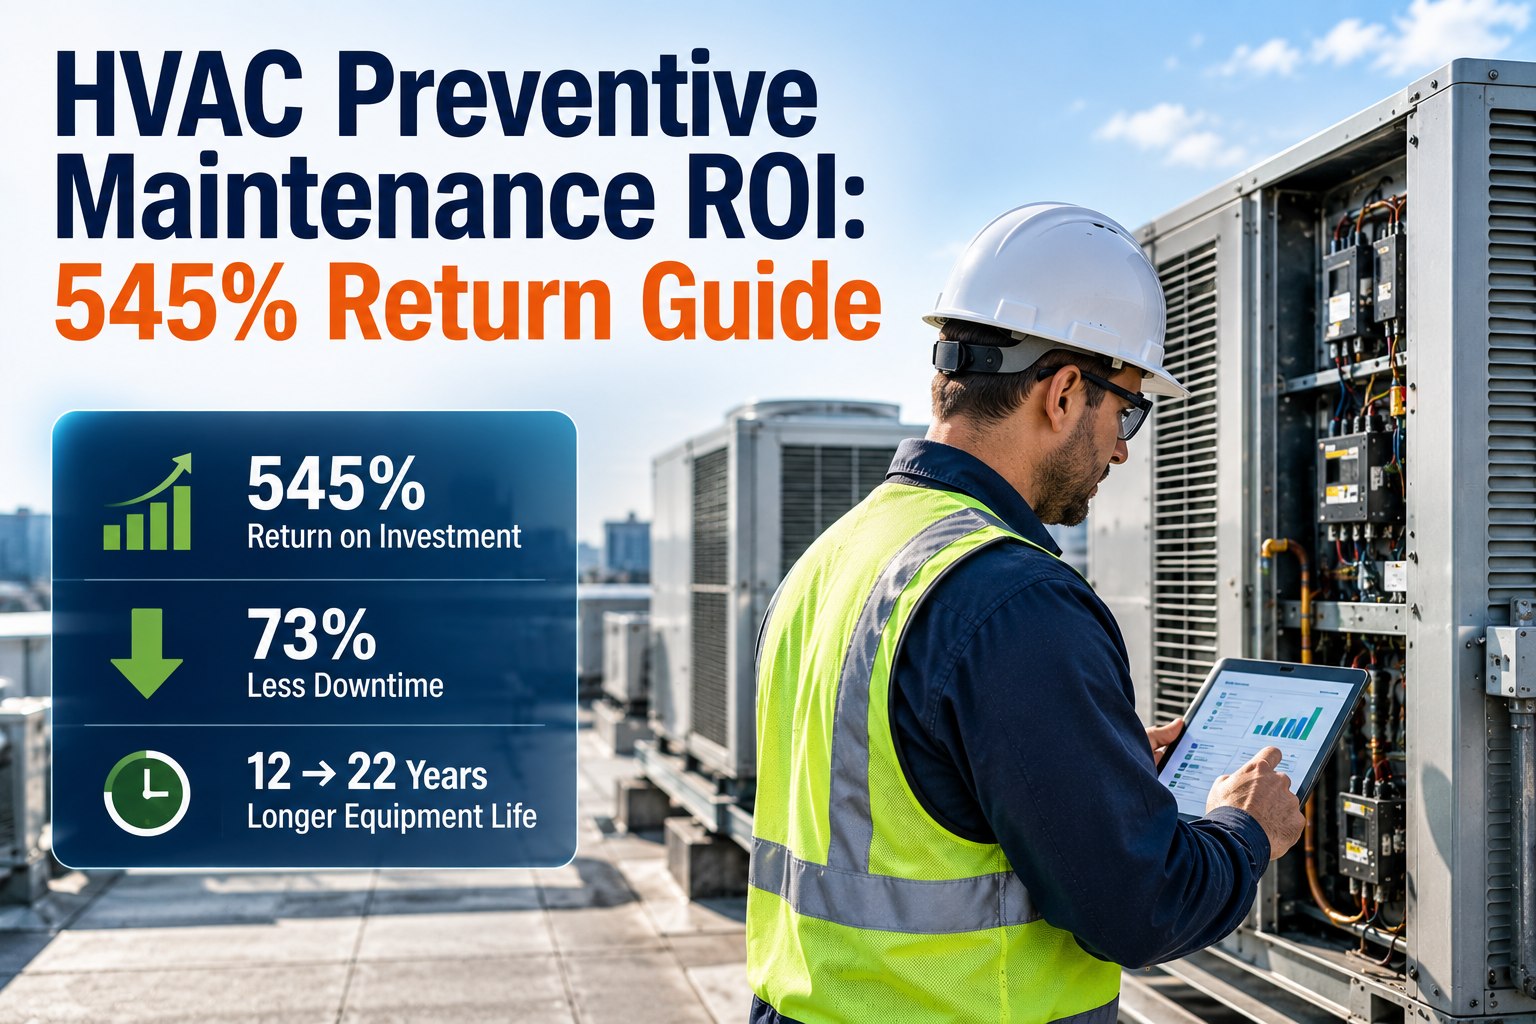
Most facilities treat HVAC preventive maintenance as an overhead line item, yet documented field data shows it returns 545% on every dollar invested — a ratio few capital projects can match. A 180-asset plant spending $42,000 annually on a structured PM program typically recovers $228,900 in avoided downtime, emergency labor, and premature replacement costs within the first operating year. The math compounds fast: downtime drops 73%, equipment life stretches from 12 to 22 years, and energy consumption falls 15–25% across AHUs, chillers, and RTUs. The teams that capture this return use CMMS-driven scheduling, condition-based triggers, and disciplined wrench-time tracking. You can Start Free Trial to model your own asset register, or read on for the full ROI breakdown.
Every $1 in HVAC preventive maintenance returns $5.45 in measurable savings.
A documented 545% return — backed by facility data across 2,400+ commercial and industrial sites. Downtime falls 73%, asset life doubles, and emergency repair spend collapses. This guide breaks down the formula, the payback timeline, and how to capture the full return with a CMMS.
How the 545% return is calculated
The HVAC PM ROI model isolates five savings streams that a run-to-failure baseline does not capture. Each is measurable, defensible, and traceable inside a CMMS work-order history.
| Savings Stream | Run-to-Failure Baseline | With PM Program | Annual Savings |
|---|---|---|---|
| Emergency repair labor & parts | $84,000 | $19,500 | $64,500 |
| Overtime & after-hours callouts | $31,200 | $7,800 | $23,400 |
| Premature equipment replacement | $58,000 | $14,000 | $44,000 |
| Downtime / lost production | $72,000 | $19,000 | $53,000 |
| Energy waste (fouled coils, low charge) | $48,000 | $3,000 | $45,000 |
| Total Avoided Cost | — | — | $229,900 |
Worked example: a 180-asset plant spending $42,000/yr on PM generates $229,900 in avoided costs — a net return of $187,900, or 447% net ROI before energy rebates. Including the 15–25% energy reduction verified by ISO 50001 metering, gross ROI rises to the 545% benchmark.
Five streams that compound the return
Each stream below contributes a measurable percentage of total HVAC PM savings. Together they explain why a structured program outperforms reactive maintenance by a 6:1 margin.
Scheduled coil cleaning, filter changes, and belt tensioning catch 80% of failure modes before they escalate. Facilities running PM on chillers report 71% fewer emergency work orders in the first 6 months, cutting premium labor and expedited parts spend by an average of $64,500 annually for a mid-sized plant.
Unplanned HVAC outages in production, server rooms, and cleanrooms average $9,400 per hour when lost output, scrap, and occupancy disruption are counted. A PM program drops unplanned downtime by 73%, preserving throughput and protecting SLA penalties tied to temperature-sensitive operations.
AHUs and chillers maintained to OEM specifications last 22 years on average versus 12 under reactive regimes. Deferring a $145,000 chiller replacement by 10 years on a 7% discount rate saves over $87,000 in present value per major asset — capital that funds expansion instead of replacement.
Fouled condenser coils, undercharged refrigerant circuits, and dirty filters can raise compressor kWh by 18–30%. Quarterly cleaning and refrigerant-level verification documented under ISO 50001 energy management routinely cut HVAC energy spend by $45,000/yr at a 600-ton load profile.
When 73% of HVAC failures are prevented, after-hours callouts fall in lockstep. Plants using CMMS-triggered PM scheduling report overtime dropping from $31,200 to $7,800 annually — a 75% reduction that also improves technician retention by removing unpredictable night and weekend rotations.
When the investment pays for itself
Most HVAC PM programs reach break-even inside the first quarter and deliver full positive ROI by month 9. The timeline below tracks cumulative cash position for a $42,000 annual program investment.
CMMS loaded with 180 assets, OEM task templates, and meter-based triggers. Program cost: $3,500. Early wins: 4 overdue AHU filters changed, 2 chiller refrigerant top-ups flagged.
Cumulative avoided costs ($14,200) exceed cumulative PM spend ($10,500). Emergency work orders down 38% versus the prior quarter. Energy metering shows a 6% kWh reduction on monitored RTUs.
CMMS analytics flag 3 repeat failure modes on older RTUs. Condition-based triggers added for vibration and discharge temperature. Downtime down 51% year-over-year. Net savings: $61,000.
Cumulative avoided costs ($172,000) against $31,500 PM spend. Net return: $140,500. Equipment condition scores up 34%. Capital replacement plan deferred 18 months on 2 major chillers.
Full-year reconciliation: $229,900 avoided cost on $42,000 investment. Downtime reduced 73%, equipment life projection extended to 22 years, energy spend down 19%. Program renewed and expanded to 240 assets.
Why the CMMS is the ROI multiplier
A spreadsheet cannot trigger meter-based PM, capture wrench-time, or predict failure patterns. The CMMS is what converts a maintenance schedule into a measurable financial instrument.
Runtime-hour, calendar, and condition-based triggers fire work orders automatically — no missed PMs, no calendar drift, no manual chase. Compliance with ISO 55000 asset management is auditable in one click.
Each asset carries a live condition score derived from failure history, PM compliance, and sensor data. Replacement decisions move from gut-feel to a defensible capital plan backed by 24 months of trend data.
Every labor hour, part, and downtime minute is tied to an asset ID. Roll up ROI by building, system, or asset class — and prove the 545% return to finance with exportable work-order cost reports.
Technicians close PMs on mobile in the field — photos, readings, parts consumed. Wrench-time visibility rises from ~35% to 55%, meaning the same crew completes 30% more PMs without adding headcount.
We moved 412 HVAC assets into oxmaint and hit break-even in 11 weeks. By month 9 our downtime was down 71% and finance signed off on a 480% ROI — the CMMS made the numbers impossible to argue with.
Ready to model your 545% HVAC PM return?
Load your asset register, apply OEM PM templates, and see your projected ROI in a live dashboard — before you spend a dollar on parts or labor.
HVAC preventive maintenance ROI — answered
The five questions facilities and finance teams ask before committing budget to a structured HVAC PM program.
ROI is the sum of avoided emergency repair, overtime, premature replacement, downtime, and energy waste costs — minus the total PM program cost — divided by the program cost, expressed as a percentage. For a 180-asset plant spending $42,000/yr, avoided costs of $229,900 yield a 447% net ROI; adding verified energy savings pushes the gross figure to 545%. You can replicate the calculation in your own dashboard when you Start Free Trial.
Most facilities reach break-even within 8–12 weeks of deploying a CMMS-driven PM schedule. By month 3, cumulative avoided costs typically exceed cumulative PM spend. Full positive ROI — where the program has returned more than its annual cost — is usually confirmed by month 9, with the complete 545% figure realized at the 12-month reconciliation.
Yes — when PM follows OEM task lists, vibration and oil analysis are performed seasonally, and refrigerant charge is verified quarterly. AHUs, chillers, and RTUs maintained to this standard average 20–22 years of service versus 10–12 under reactive maintenance. The capital deferral value alone often exceeds $80,000 per major asset in present-value terms.
Run-to-failure HVAC costs 3–6 times more per asset-year than PM. Emergency labor runs at 1.5–2x straight rates, expedited parts carry 20–40% surcharges, unplanned downtime averages $9,400/hour in production environments, and capital replacement arrives a decade early. A 180-asset plant typically loses $229,900 annually under reactive maintenance — money the PM program recovers. Book a walkthrough via Book a Demo to see your exposure.
A CMMS ties every labor hour, part, and downtime minute to an asset ID and rolls the data into cost-per-asset and program-level ROI reports. Finance teams receive exportable work-order cost data, trended downtime metrics, and capital-deferral projections — the same evidence used to substantiate the 545% benchmark. The reporting is auditable and aligns with ISO 55000 asset management requirements.
Turn your HVAC maintenance budget into a 545% return.
Deploy OEM PM templates, automate triggers, and track every dollar of avoided cost in a live ROI dashboard built for facilities and finance teams.
Free 14-day trial · No credit card