Case Study: Office Portfolio Cuts HVAC Energy Costs 25% with Smart Monitoring

By Mark Strong on March 31, 2026

hvac-energy-savings-case-study-office-portfolio-25-percent

HVAC systems consume 25–50% of a commercial building's total energy budget. For a 15-building office portfolio, that number is not an operating footnote — it is the single largest controllable cost on the balance sheet. This case study documents how one portfolio operations team moved from calendar-based guesswork to real-time IoT intelligence, cutting HVAC energy costs by 25% in under 12 months and recovering their full deployment investment in 9 months through OxMaint.

25%
HVAC energy cost reduction

15
Office buildings monitored

$94K
Annual savings across portfolio

9 mo
Full ROI payback period
Monitor Every HVAC Unit Across Every Building — Automatically
IoT sensors, fault detection, and condition-based PM scheduling — one platform, every building, zero surprises

The Situation: 15 Buildings, No Visibility, Rising Bills

The portfolio facilities team was maintaining HVAC on fixed calendar intervals — quarterly filter swaps, bi-annual coil cleans, annual full-unit service. Work was dispatched on schedule, not on condition. No single person had a real-time view across all 15 buildings. Fault conditions were discovered when tenants called, or when the quarterly energy invoice arrived and someone noticed the spike.

Before OxMaint
Calendar-based PM — service regardless of equipment condition
Faults discovered only by tenant complaints or billing spikes
After-hours HVAC running in unoccupied zones — undetected
15 buildings tracked in 15 separate spreadsheets
4–6 day average lag from fault onset to repair
After OxMaint
Condition-based PM — service only when equipment needs it
Faults auto-detected, work orders generated in real time
Occupancy-linked scheduling eliminates after-hours waste
All 15 buildings on a single live dashboard
Zero emergency HVAC callouts in final 6 months of study year

How the 25% Was Achieved: Three-Phase Deployment

The savings did not come from a single fix. They came from three sequential layers of intelligence deployed across 90 days, each one making the next possible.

01

Weeks 1–4
IoT Sensor Network — Real-Time Visibility Across All 15 Buildings

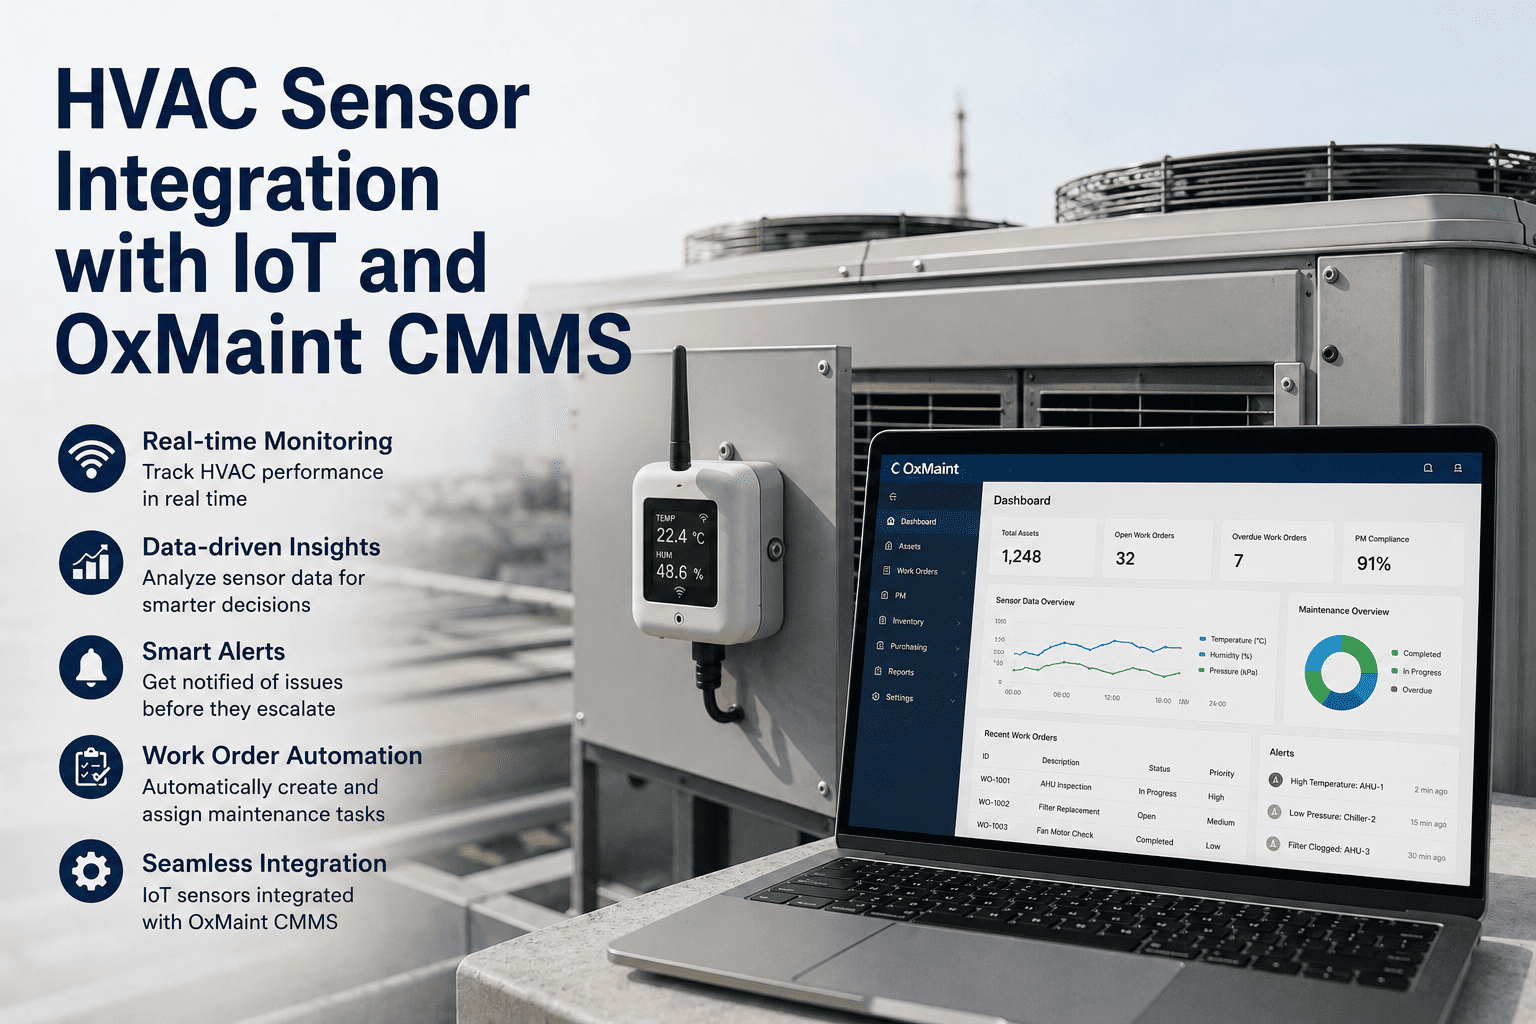
Temperature, humidity, runtime, and energy draw sensors were deployed across every HVAC unit in the portfolio. Data transmitted every 15 minutes to OxMaint. Within the first week, three buildings were identified as running full conditioning schedules during unoccupied hours — a pattern the previous team had no way of detecting. Correcting the scheduling alone eliminated an estimated 18% of total excess consumption.

Phase result: After-hours waste identified and corrected — week 1
02

Weeks 5–8
Fault Detection and Diagnostics — Catching Drift Before It Becomes Damage

OxMaint's fault detection layer began analysing runtime patterns, temperature differentials, and energy draw against baseline. A rooftop unit in Building 7 was found consuming 34% more energy than its rated spec — traced to a refrigerant pressure drop developing for months. The unit was repaired in a single scheduled visit. In total, 11 fault conditions were identified and resolved across the portfolio before any caused equipment failure or a tenant complaint.

Phase result: 11 fault conditions resolved — no emergency callouts
03
Weeks 9–12
Condition-Based PM Scheduling — Stop Servicing What Does Not Need It

Every PM schedule across the 15 buildings was rebuilt in OxMaint against runtime hours and sensor data, replacing calendar-based intervals. Units with low hours and clean sensor profiles were serviced less frequently. Units approaching OEM thresholds were flagged automatically and prioritised. The result was 32% fewer total PM dispatches — and each visit was more effective because it was targeted, not routine.

Phase result: 32% fewer PM dispatches — same fleet, better outcomes

Where the 25% Energy Reduction Came From

Every percentage point of the 25% saving traces back to a specific waste source that was invisible without continuous monitoring. The breakdown below shows how the total reduction was distributed across the four root causes identified during the study year.

HVAC Energy Waste — Portfolio Root Cause Breakdown
After-hours operation in unoccupied zones
Units running full conditioning schedules on weekends and evenings with no occupants
40%
Fault-driven overconsumption
Refrigerant pressure drops, coil fouling, and filter restriction increasing energy draw
30%
Setpoint drift
Units operating outside their programmed temperature range with no alert to facilities team
18%
Pre-conditioning waste
Systems starting too early with no occupancy data link to calibrate actual need
12%

The Numbers: 12-Month Portfolio Outcomes

Across all 15 buildings, total HVAC energy costs dropped by 25% within 12 months of full deployment — translating to $94,000 in annual savings with no reduction in occupant comfort or service levels. That figure came entirely from eliminating waste that the previous maintenance model had no way of identifying. If your portfolio is still running on calendar PM, the same waste sources are almost certainly present. Start a free trial and connect your first building in under a day.

On the maintenance operations side, OxMaint's fault detection layer identified 11 fault conditions — refrigerant pressure anomalies, coil fouling patterns, and filter restriction events — before any of them caused equipment failure or a tenant escalation. Condition-based scheduling cut total PM dispatches by 32%, redirecting technician time from routine calendar visits to equipment that genuinely needed attention. To see how condition-based scheduling applies to your specific asset types, book a demo with the OxMaint team.

The full IoT sensor deployment paid back in 9 months. In the final 6 months of the study year, the portfolio recorded zero emergency HVAC callouts — a result that would have been statistically impossible under the previous reactive maintenance model, which had averaged 4–6 emergency responses per quarter. Sign up free to see what your portfolio's energy and fault baseline looks like from week one.

We thought our HVAC spend was just the cost of running 15 buildings. OxMaint showed us that nearly a quarter of it was waste we simply could not see. Three buildings had units running full conditioning schedules every weekend with nobody in them. That one finding alone covered the platform cost in the first month.
— Portfolio Facilities Director, 15-building office group · OxMaint IoT deployment

The Four OxMaint Capabilities That Drove the Result

IoT Integration
Real-Time Sensor Monitoring
Temperature, humidity, runtime, and energy draw data transmitted every 15 minutes from every HVAC unit to OxMaint. Alerts generate automatically when any parameter drifts outside defined range — before tenants notice and before the energy bill arrives.
Data interval: every 15 min · Alert to work order: automatic
Fault Detection
Automated Fault Diagnostics
OxMaint analyses runtime patterns and energy draw against OEM baselines to surface fault conditions before they cause failure. Each fault generates a contextualised work order — technicians arrive with a diagnosis, not a symptom report.
11 faults caught pre-failure · 0 emergency callouts in final 6 months
Condition-Based PM
Runtime-Triggered Scheduling
PM work orders generate when equipment reaches OEM runtime hour thresholds or sensor data flags service need — not on arbitrary calendar dates. Healthy equipment runs. Equipment nearing a fault threshold gets serviced before it fails.
32% fewer PM dispatches · Each visit targeted, not routine
Portfolio View
Multi-Building Dashboard
All 15 buildings, every HVAC unit, every open work order, and every fault alert on one screen for the Facilities Director. No chasing building managers for weekly updates. No surprise energy invoices at quarter end.
15 buildings · 1 dashboard · Real-time visibility
HVAC Energy Optimisation — OxMaint
One Dashboard. Every Building. Every HVAC Unit Tracked Before It Costs You.
IoT monitoring, fault detection, and condition-based PM scheduling across your entire portfolio — all automated, all visible, all in OxMaint.
25%
HVAC cost reduction

9 mo
average ROI payback

Free
to start today

Frequently Asked Questions

Sensor deployment across a 15-building portfolio typically takes 4–8 weeks depending on building access and unit count. Wireless sensors require no network access and install without tenant disruption. OxMaint begins receiving data and generating alerts from the first day each building goes live.
No — OxMaint works alongside your BAS. Automation systems control setpoints; OxMaint adds the analytical layer to detect performance degradation, fault conditions, and optimisation opportunities the BAS cannot surface on its own. Portfolios running both systems typically achieve 15–25% better energy outcomes than BAS alone.
OxMaint flags refrigerant pressure anomalies, filter restriction indicators, coil fouling patterns, unusual energy draw relative to runtime hours, and units operating outside programmed setpoints. Each fault generates a work order with diagnostic context — technicians arrive prepared, not investigating from zero.
Calendar PM services equipment on fixed dates regardless of actual condition. Condition-based PM schedules service when runtime hours, energy draw, or sensor data indicate need. The result is fewer unnecessary dispatches, lower total maintenance cost, and higher reliability — high-risk equipment gets attention before failure, not on an arbitrary date.
Yes — OxMaint manages HVAC, electrical, plumbing, lifts, fire safety, and any other asset class on one platform. Portfolio Facilities Directors see all open work orders, PM compliance, and fault alerts across every building and every asset type from a single dashboard. Start your free trial to build your portfolio view.
Smart HVAC Maintenance — OxMaint
Stop Paying for Energy Waste You Cannot See.
25%
HVAC cost reduction

$94K
annual savings · 15 buildings

Free
to start today

Share This Story, Choose Your Platform!