Facility directors managing HVAC systems across dozens of buildings know the pain intimately: Building 7 spent three times more on identical repairs than Building 22 last quarter, and nobody flagged it until budget review. When HVAC portfolios span multiple sites, spreadsheets and email chains create invisible cost leaks, compliance gaps, and reactive breakdowns that compound month after month. HVAC systems already account for 30–70% of a commercial building's total energy consumption — managing that inefficiently across multiple locations is not just operationally risky, it is financially dangerous. Sign in to OxMaint to centralize your entire HVAC portfolio on one cloud dashboard, or book a demo to see multi-site analytics in action.
Article · Multi-Site HVAC · Cloud CMMS Platform
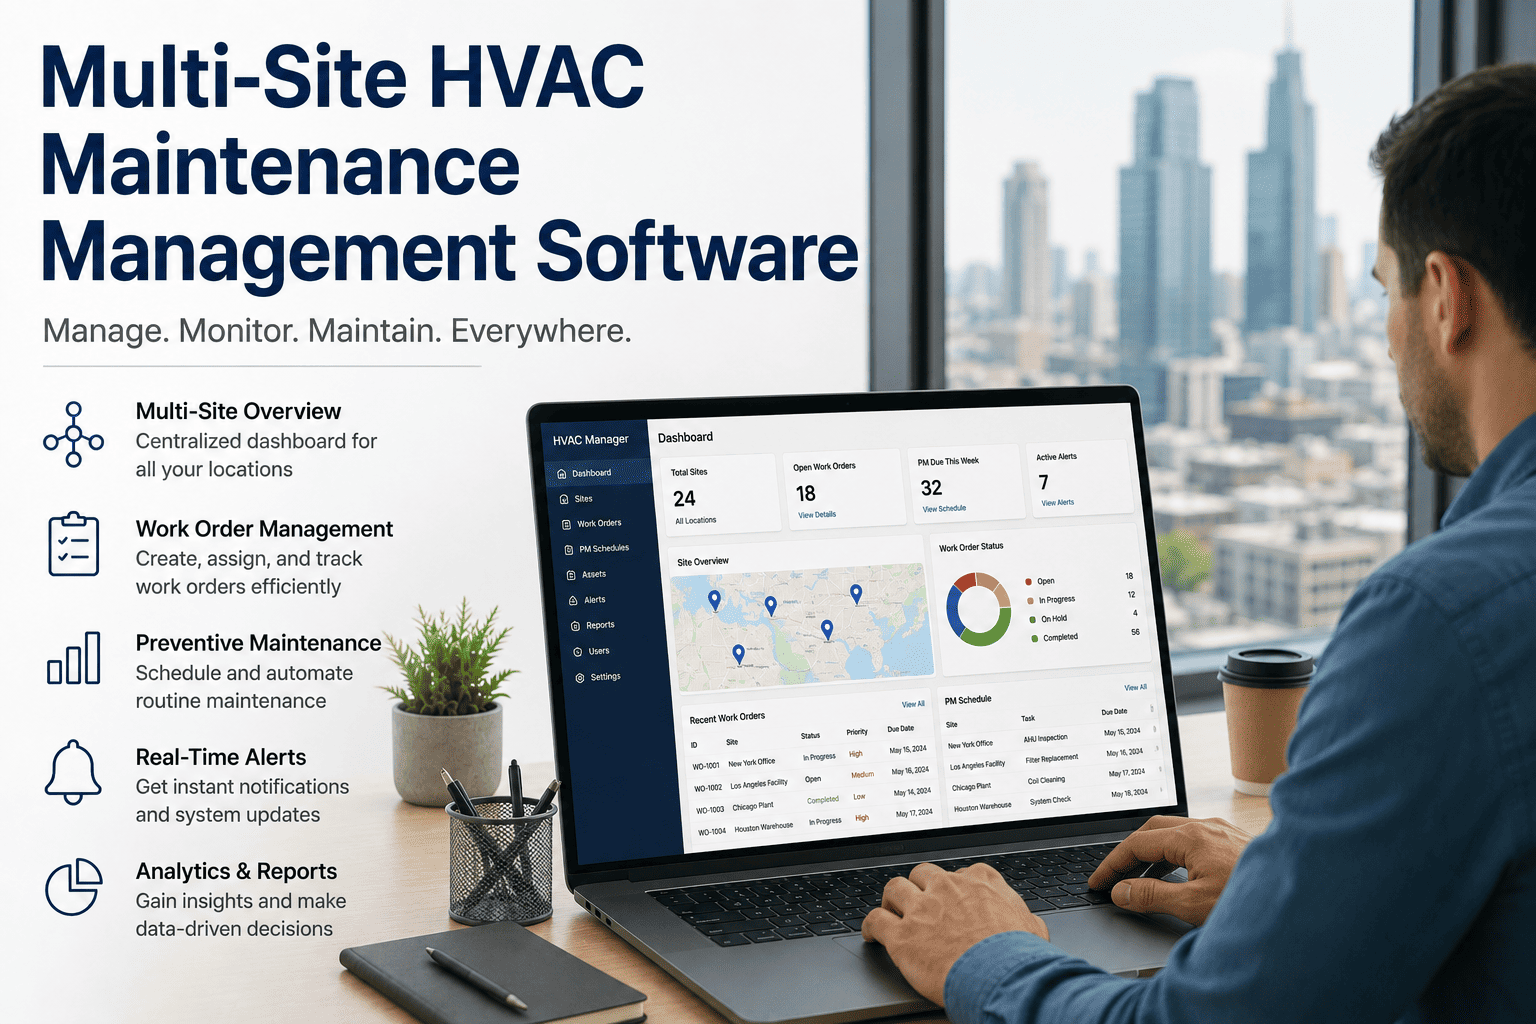
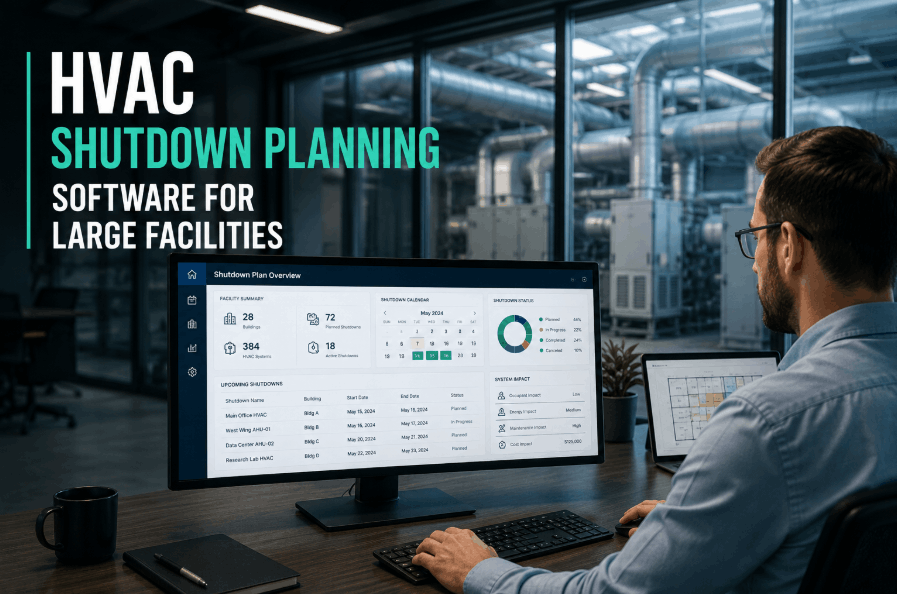
Multi-Site HVAC Maintenance Management Software
One dashboard. Every building. Every unit. Every vendor. OxMaint gives facility directors portfolio-level control over HVAC assets, compliance, energy, and technicians — across 10 or 500 locations — without growing the central team.
30–70%
of commercial building energy consumed by HVAC systems
545%
ROI documented from preventive HVAC maintenance programs
44%
less downtime in CMMS-managed facilities vs manual coordination
3–10x
more expensive to run HVAC to failure vs planned preventive maintenance
The Portfolio Problem
What Managing HVAC Across Sites Actually Looks Like Without a Central System
Most multi-site facility teams are not failing at HVAC maintenance — they are failing at visibility. The work gets done, but nobody can see the whole picture at once.
01
Invoice Variance No One Catches
The same compressor replacement invoiced at $1,200 in one region and $4,800 in another. Without a central benchmark, both get approved. Across 50 buildings and 14 vendors, that variance adds up to hundreds of thousands every year.
02
PM Completion Nobody Tracks
Quarterly filter changes completed at 9 of 20 sites. Annual coil cleaning done at 6. But the central team finds out when a tenant complaint arrives or a unit fails mid-summer — not before. Reactive maintenance costs 3–10x more than planned work.
03
Energy Waste Invisible at Scale
A fouled coil or undercharged refrigerant system runs 20–30% less efficiently than a maintained one. Multiplied across 100+ HVAC units at 30 sites, unmeasured energy degradation becomes a material cost center that never appears on any maintenance report.
04
Vendor Performance Is Invisible
Which contractor has the best first-call resolution rate? Which region consistently misses SLA response windows? Without a unified work order system feeding into one dashboard, the portfolio manager cannot answer those questions without weeks of manual data gathering.
OxMaint Portfolio Dashboard
What the Facility Director Sees Every Morning
Portfolio Health
Building Heat-Map
Every building in your portfolio — color-coded green, amber, or red based on open work orders, PM compliance, and asset age. The entire estate reviewed in under 30 seconds.
Building 01–08On Track
Building 09–12Review Needed
Building 13–14At Risk
Cost Intelligence
Contractor Invoice Benchmarking
Every invoice tagged by task type and equipment class. Outliers flagged automatically when cost exceeds the regional benchmark by more than 40% — before approval.
Compliance
PM Completion by Site
Quarterly PM tracked per unit per building. Sites falling behind are surfaced automatically — not discovered after failure. Regional FM gets a weekly digest.
Capital Planning
HVAC Age and Replacement Forecast
Asset age distribution across the portfolio with replacement cost forecasting. Buildings with 3+ units over 12 years flagged for capital budget inclusion — before emergency replacement.
Manage Every HVAC Asset Across Every Building — From One Dashboard
PM compliance, contractor benchmarks, energy tracking, and capital planning — all centralized in OxMaint. Go live across your portfolio in 60 days.
Measured Impact
Before vs. After OxMaint — Portfolio-Level Results
| Metric |
Without Central CMMS |
With OxMaint |
Improvement |
| Emergency callout rate |
23+ per week across portfolio |
8–9 per week |
63% reduction |
| Contractor invoice variance |
Up to 340% between regions |
Reduced to under 30% |
Variance eliminated |
| PM completion rate |
51% average across sites |
92%+ portfolio-wide |
+41 percentage points |
| Energy cost per building |
Unmeasured, degrading |
6–8% average reduction |
Measurable savings |
| Compliance documentation time |
Days of manual assembly |
Single dashboard export |
60% time saved |
| HVAC downtime |
Reactive — unpredictable |
44% less unplanned downtime |
Structural reduction |
How It Works
Three Phases to Portfolio-Wide HVAC Control
Phase 1
Asset Registry — Weeks 1–3
All HVAC units entered into OxMaint with model, serial, refrigerant type, age, and criticality class. Buildings ranked by asset age and callout frequency — highest-risk sites prioritized for immediate PM attention. QR tags deployed for field-scan access.
Phase 2
Standard PM Scope — Weeks 4–6
One standardized PM checklist deployed across all buildings and all vendors. Filter replacement, coil cleaning, refrigerant check, electrical inspection — all mandatory. Contractors submit completion records against the standard scope, not their own format. Comparable data from day one.
Phase 3
Contractor Benchmark — Ongoing
OxMaint surfaces contractor performance across all vendors: average invoice per task type, first-call resolution, PM completion rate, and response time. Bottom-quartile performers renegotiated. Volume consolidated to top performers. Portfolio cost drops within 6 months.
"
The single biggest misconception in multi-site facility management is that managing multiple contractors is a cost-saving strategy. It is not — it is a cost-obscuring strategy. You cannot benchmark what you cannot measure, and without a centralized CMMS that normalizes work order data, invoice amounts, and PM completion records across every site and every vendor simultaneously, you have no idea whether your maintenance spend is competitive or not. The facilities that figured this out first did not do it by hiring more staff — they did it by building one system that made the whole portfolio visible at once.
MR
Marcus Reid, CFM, FMA
Certified Facility Manager · Facility Management Administrator · 22 years multi-site commercial real estate operations · Former Director of Engineering, 200+ building institutional portfolio · Specialist in HVAC portfolio analytics, multi-contractor management, and CMMS-driven cost benchmarking
Frequently Asked Questions
How does OxMaint handle HVAC assets managed by different contractors across different regions?
OxMaint assigns contractors at the building level — each site's work orders route to the designated vendor, while all completion records, invoices, and performance data flow into one central dashboard. The portfolio team benchmarks every contractor's cost-per-task and PM completion rate across all buildings simultaneously, making regional variance visible and actionable. This is the mechanism that eliminates the 300–340% invoice variance seen in unmanaged multi-site portfolios.
Sign in to configure your contractor structure from day one.
How long does it take to deploy OxMaint across a multi-building HVAC portfolio?
Most multi-site portfolios reach full operational coverage within 60–90 days. The typical deployment begins with asset registry in weeks 1–3, PM scope standardization in weeks 4–6, and contractor onboarding and live work order management from week 7 onward. No hardware installation is required — technicians and vendors access OxMaint via mobile app from their first assigned work order. Portfolios with existing spreadsheet data can migrate that asset history directly into the system without rebuilding from scratch.
Book a demo to see the multi-site onboarding workflow.
Can OxMaint track energy performance across multiple buildings?
Yes. OxMaint links HVAC maintenance records to energy performance data at the asset and building level. Coil fouling, refrigerant undercharge, and filter neglect are the most common causes of energy degradation — all tracked through the PM completion record. Buildings showing energy cost increases are cross-referenced against maintenance compliance to identify the root cause before it becomes a budget item. Facilities using OxMaint report average energy reductions of 6–8% per monitored unit within year one.
Sign in to start tracking energy performance alongside maintenance data.
What HVAC data does OxMaint need to generate portfolio-level insights?
The minimum viable dataset is asset name, building location, equipment model and serial number, refrigerant type, and installation year. OxMaint begins generating PM schedule recommendations as soon as unit age and model data are entered. Full portfolio analytics — failure probability scoring, replacement forecasting, contractor benchmarks — develop over the first 3–6 months as work order history accumulates. Most portfolios start with the data they already have in spreadsheets or invoices and validate it during the first PM cycle.
Book a demo to see the portfolio onboarding process.
Every Building. Every Unit. Every Vendor. One Dashboard.
OxMaint Multi-Site gives facility teams portfolio-level visibility, standardized PM scope, contractor benchmark data, and capital planning intelligence — without growing the central team proportional to the portfolio.